
Key Fact & Findings
- 205,146,421 Americans are aged 18 to 64, 60.0% of the population, down from 61.0% in 2020.
- The group grew only 1.5% since 2020, while the 65-plus group grew 16.2%.
- The old-age dependency ratio rose from 27.5 to 31.5; there are now 3.2 working-age adults per person 65 or older.
- The prime-age group (25 to 54) numbers 132,019,846.
- The 25-to-44 group grew 5.9%; the 45-to-64 group shrank 3.2%.
- The South added 57.6% of the national gain in 25-to-44-year-olds.
- The Census Bureau projects the 18-to-64 population to fall 231,913 in the year to July 2026.
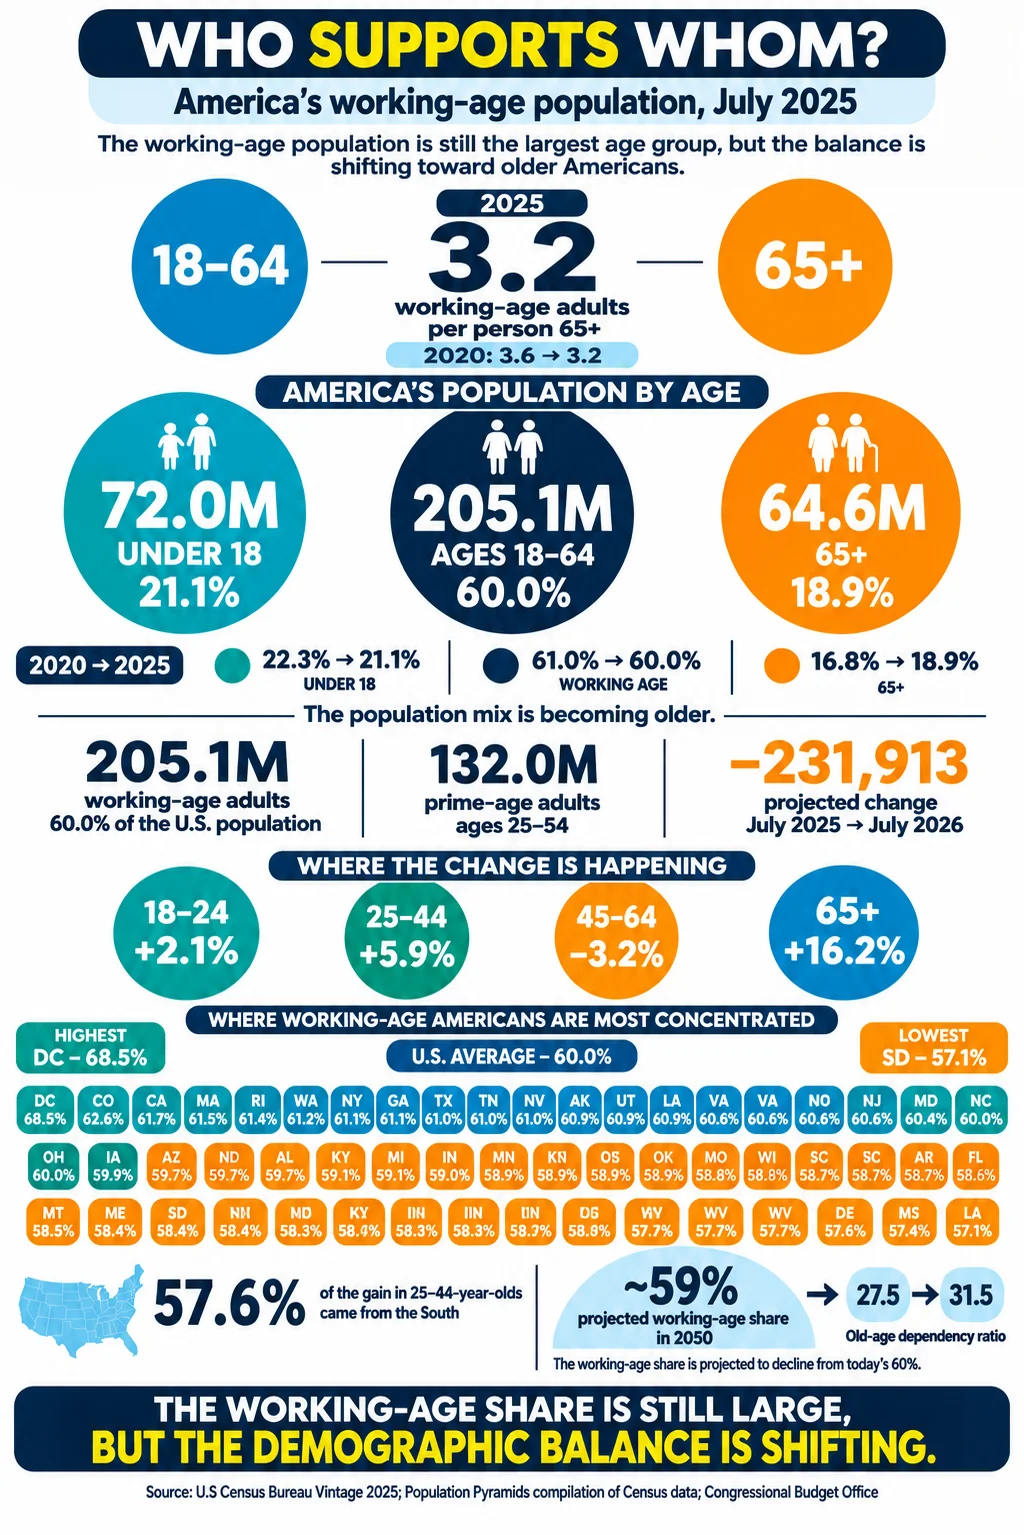
There are 205,146,421 Americans between 18 and 64, the age range most associated with working, but they now make up 60.0% of the population, down from 61.0% in April 2020. In those five years, the working-age population grew by 3.08 million (1.5%) while the number of people 65 and older grew by 8.99 million (16.2%). The result is that the nation has 3.2 working-age adults for every person 65 or older, compared with 3.6 in 2020, and the Census Bureau’s short-term projection shows the 18-to-64 group shrinking by another 231,913 in the year to July 2026.
Working age is a demographic category, not a measure of employment. This article counts people by age using Census Bureau Vintage 2025 estimates for July 1, 2025, and uses the Census Bureau’s standard adult range of 18 to 64. Other definitions exist: the United Nations and OECD use 15 to 64, and labor economists often focus on prime-age workers aged 25 to 54. How many of these people have jobs depends on participation and employment rates, which are outside the scope of population estimates.
Data Snapshot
| Metric | Figure | Reference |
|---|---|---|
| Population aged 18 to 64 | 205,146,421 (60.0%) | July 1, 2025 |
| Same group, April 2020 | 202,065,795 (61.0%) | |
| Growth, 2020 to 2025 | +3,080,626 (+1.5%) | |
| Prime-age population (25 to 54) | 132,019,846 (38.6%) | July 1, 2025 |
| Old-age dependency ratio | 31.5 per 100 working-age adults (27.5 in 2020) | |
| Working-age adults per person 65 or older | 3.2 | July 1, 2025 |
| Projected change, July 2025 to July 2026 | -231,913 (-0.1%) |
The Working-Age Population by Age Group
| Age group | April 2020 | July 2025 | Change | Percent |
|---|---|---|---|---|
| 18 to 24 | 31,271,950 | 31,936,859 | +664,909 | +2.1% |
| 25 to 44 | 86,789,265 | 91,885,062 | +5,095,797 | +5.9% |
| 45 to 64 | 84,004,580 | 81,324,500 | -2,680,080 | -3.2% |
| 18 to 64 | 202,065,795 | 205,146,421 | +3,080,626 | +1.5% |
The 25-to-44 group supplied more than all of the net growth, since the 45-to-64 group shrank by 2.68 million as the largest Boomer cohorts moved past 64. The five-year groups inside the range show where the peak is.
| Age group | July 2025 population |
|---|---|
| 18 to 24 (seven ages) | 31,936,859 |
| 25 to 29 | 23,342,365 |
| 30 to 34 | 23,221,682 |
| 35 to 39 | 23,171,303 |
| 40 to 44 | 22,149,712 |
| 45 to 49 | 20,356,102 |
| 50 to 54 | 19,778,682 |
| 55 to 59 | 20,112,899 |
| 60 to 64 | 21,076,817 |
The 25-to-54 prime-age group totals 132,019,846 and is made up almost evenly of the 25-to-44 group (91.9 million) and the 45-to-54 group (40.1 million). The three five-year groups from 25 to 39 are each above 23 million, which is where the Millennial generation sits.
By contrast, the groups aged 45 to 59 are all under 20.4 million, so the working-age population gets smaller as it gets older until the 60-to-64 group, which reflects the end of the large baby boom cohorts.
Dependency Ratios
Dependency ratios compare the number of people outside working age with the number inside it.
| Measure | 2020 | 2025 | 2026 projection |
|---|---|---|---|
| Old-age dependency ratio (65 and older per 100 aged 18 to 64) | 27.5 | 31.5 | 32.4 |
| Child dependency ratio (under 18 per 100 aged 18 to 64) | 36.5 | 35.1 | about 34.8 |
| Total dependency ratio | 64.0 | 66.6 | about 67.2 |
| Potential support ratio (aged 18 to 64 per person 65 and older) | 3.6 | 3.2 | about 3.1 |
The child dependency ratio fell as the number of children declined, and the old-age ratio rose by four points in five years. The total ratio went up from 64.0 to 66.6, so even though there are fewer children to support, the shift toward older ages raised the overall load. The Census Bureau reports the 2020 and 2025 old-age ratios, and the other lines are calculated from the same age-group totals. The 2026 child and total ratios are estimated from the July 2026 projection of 71,300,560 children, 204,914,508 working-age adults and 66,405,075 older adults.
Regional Differences
Regional population changes for the two largest working-age groups show where the supply of workers is growing.
| Region | 25 to 44, change since 2020 | 45 to 64, change since 2020 |
|---|---|---|
| Northeast | +4.2% | -7.1% |
| Midwest | +3.3% | -6.2% |
| South | +9.0% | +0.1% |
| West | +4.4% | -2.7% |
| United States | +5.9% | -3.2% |
The South accounted for 2,935,043 of the nation’s 5,095,797 additional 25-to-44-year-olds (57.6%) and was the only region where the 45-to-64 group did not fall. In micropolitan counties the 45-to-64 group fell between 4.7% (South) and 10.3% (Northeast). Outlying counties of Southern metro areas grew fastest in every age group, which means labor supply is shifting toward the suburbs of Sun Belt metros.
Working-Age Share by State
The share of each state’s population aged 18 to 64 is the remainder after subtracting the under-18 and 65-plus shares, so it carries a rounding error of about 0.1 point. Counts are calculated from state populations and are approximate. Ties share a rank.
| Rank | State | Share aged 18 to 64 | Approximate population aged 18 to 64 |
|---|---|---|---|
| 1 | District of Columbia | 68.5% | 475,000 |
| 2 | Colorado | 62.6% | 3,764,000 |
| 3 | California | 61.7% | 24,282,000 |
| 4 | Massachusetts | 61.5% | 4,400,000 |
| 5 | Rhode Island | 61.4% | 684,000 |
| 6 | Washington | 61.3% | 4,905,000 |
| 7 | New York | 61.2% | 12,241,000 |
| 8 | Georgia | 61.1% | 6,906,000 |
| 8 | Texas | 61.1% | 19,375,000 |
| 10 | Nevada | 61.0% | 2,002,000 |
| 11 | Alaska | 60.9% | 449,000 |
| 11 | Utah | 60.9% | 2,155,000 |
| 13 | Illinois | 60.7% | 7,721,000 |
| 13 | Virginia | 60.7% | 5,390,000 |
| 15 | New Jersey | 60.6% | 5,786,000 |
| 16 | Maryland | 60.3% | 3,778,000 |
| 17 | Connecticut | 60.1% | 2,217,000 |
| 18 | North Carolina | 60.0% | 6,719,000 |
| 18 | Oregon | 60.0% | 2,564,000 |
| 20 | Tennessee | 59.9% | 4,382,000 |
| 21 | New Hampshire | 59.7% | 845,000 |
| 22 | North Dakota | 59.2% | 473,000 |
| 23 | Alabama | 59.1% | 3,069,000 |
| 23 | Kentucky | 59.1% | 2,723,000 |
| 23 | Michigan | 59.1% | 5,986,000 |
| 26 | Indiana | 59.0% | 4,114,000 |
| 27 | Minnesota | 58.9% | 3,434,000 |
| 27 | Pennsylvania | 58.9% | 7,692,000 |
| 27 | Vermont | 58.9% | 380,000 |
| 30 | Oklahoma | 58.8% | 2,424,000 |
| 31 | Missouri | 58.7% | 3,681,000 |
| 31 | Wisconsin | 58.7% | 3,506,000 |
| 33 | Arkansas | 58.6% | 1,825,000 |
| 34 | Louisiana | 58.5% | 2,702,000 |
| 34 | Ohio | 58.5% | 6,962,000 |
| 36 | Arizona | 58.4% | 4,452,000 |
| 36 | Mississippi | 58.4% | 1,725,000 |
| 38 | Florida | 58.3% | 13,679,000 |
| 38 | South Carolina | 58.3% | 3,247,000 |
| 40 | Kansas | 58.2% | 1,733,000 |
| 40 | New Mexico | 58.2% | 1,237,000 |
| 42 | Maine | 58.1% | 822,000 |
| 43 | Idaho | 58.0% | 1,177,000 |
| 43 | Nebraska | 58.0% | 1,170,000 |
| 43 | West Virginia | 58.0% | 1,024,000 |
| 46 | Hawaii | 57.7% | 827,000 |
| 46 | Iowa | 57.7% | 1,869,000 |
| 46 | Wyoming | 57.7% | 340,000 |
| 49 | Montana | 57.6% | 659,000 |
| 50 | Delaware | 57.4% | 608,000 |
| 51 | South Dakota | 57.1% | 534,000 |
The District of Columbia has by far the highest working-age share (68.5%), followed by Colorado (62.6%), California (61.7%), Massachusetts (61.5%) and Rhode Island (61.4%). The lowest shares are in South Dakota (57.1%), Delaware (57.4%), Montana (57.6%), Iowa, and Wyoming (both 57.7%). Low shares come from two different causes: South Dakota, Iowa and Wyoming have high shares of both children and older adults, while Delaware, Montana and Maine (58.1%) have especially large older populations.
What Is Driving the Change
Three developments account for the national picture. First, the baby boom is aging out of the range. The 45-to-64 group fell 2.68 million between 2020 and 2025 as people born through 1964 reached 65. Second, birth cohorts are smaller: the under-18 population fell 2.4%, and the Congressional Budget Office projects that the number of people 24 or younger will decline for three decades, so fewer young adults will enter the range. Third, immigration is the main source of growth. The CBO projects that deaths will exceed births from 2030, which means all US population growth, and thus all growth in the working-age population, would come from net immigration. Net international migration fell from 8.08 to 3.70 per 1,000 residents in the year to July 2025.
The Census Bureau’s 2023 projections show the working-age share falling from about 61% in 2022 to 59% in 2050, as the 18-to-44 share drops from 36% to 33% and the 45-to-64 share rises from 25% to 26%. The 65-and-older share rises from 17% to 23% over the same period. In absolute terms, the working-age population stays near 205 million rather than collapsing, but it stops growing while the older population climbs to 78 to 82 million.
Conclusion
The United States has about as many working-age people as it did five years ago, and fewer of them per retiree. That is the point of the numbers: a 1.5% rise in the 18-to-64 group against a 16.2% rise in the 65-and-older group moved the potential support ratio from 3.6 to 3.2 in half a decade. Where the next generation of workers will come from depends on immigration, because the age structure already in place, with smaller cohorts of children behind it, will not supply them.
Frequently Asked Questions
1. How many working-age Americans are there?
205,146,421 aged 18 to 64 as of July 1, 2025, which is 60.0% of the population.
2. What age range counts as working age?
The Census Bureau commonly uses 18 to 64. The UN and OECD use 15 to 64, and economists often track prime-age workers at 25 to 54 (132.0 million in 2025).
3. Is the working-age population growing?
Slowly. It grew 1.5% between April 2020 and July 2025, and the Census Bureau’s short-term projection shows a small decline of 231,913 in the year to July 2026.
4. What is the old-age dependency ratio?
The number of people 65 and older per 100 people aged 18 to 64. It was 31.5 in 2025, up from 27.5 in 2020.
5. How many workers are there for each retiree-age American?
About 3.2 working-age adults for every person 65 or older, down from 3.6 in 2020.
6. Which state has the highest share of working-age residents?
The District of Columbia (68.5%), followed among the states by Colorado (62.6%) and California (61.7%).
7. Which state has the lowest working-age share?
South Dakota, at about 57.1%, followed by Delaware (57.4%) and Montana (57.6%).
8. Which age group within working age is growing fastest?
Ages 25 to 44, up 5.9% (5.1 million) since 2020. The 45-to-64 group shrank 3.2%.
9. Does working-age population equal the labor force?
No. The working-age population is a count by age. The labor force depends on participation and employment, which are measured by other surveys.
10. What will the working-age share be in 2050?
About 59% in the Census Bureau’s 2023 projections, down from about 61% in 2022.
Recommended Articles in the USA Population Series:
- USA Baby Boomer Population Falls to 64.4 Million, Down 14 Million From Its Peak
- Generation X Population in the USA Reaches About 65 Million, Nearly Matching Boomers
- Number of Children Under 18 in America Falls to 72 Million as the South Gains
- US Aging Population Statistics: 64.6 Million Seniors, 7 Million Over 85, 119,100 Centenarians
- USA States With the Oldest Populations: Maine Has 142 Seniors for Every 100 Children
- How Will America’s Age Structure Change by 2050? Key Shifts to Watch
- US Population Pyramid Is Turning Into a Column With a Heavy Middle
- US States With the Youngest Populations: Utah Has Twice as Many Children as Seniors
- US Population Over 65 by State Ranges From 24.6% in Maine to 13.0% in Utah
- Generation Alpha Population in America Reaches 51 Million
- Generation Z Population in the USA Reaches 71 Million, With Nearly 2 Million More Boys
- Millennial Population in America Tops 74 Million and Dominates the Middle of the Age Pyramid
- Median Age in the United States Reaches 39.4, With Maine 12.3 Years Older Than Utah
- Largest Cities in America by Population: The 25 Biggest Urban Centers
- Most Densely Populated Cities in America: A Tiny Jersey Town Outranks New York
- US Metropolitan Population Projections for 2050: Where Growth Will Be Concentrated
- Fastest-Growing Metropolitan Areas in the USA Are Concentrated in Smaller Southeast Metros
- How America’s Biggest Cities Changed Places Between 1900 and 2027
- Cities Losing Population in the USA: New York Falls by 166,000 as St. Louis Drops 7.4%
- Largest Urban Areas in the United States: The Metro Regions With the Most Residents
- Largest Metropolitan Areas in the USA: Where 86% of Americans Live
- Fastest-Growing Cities in the US Are Texas Suburbs, While Charlotte Leads in New Residents
- Top 25 Most Populated Cities in the USA in 2027: America’s Biggest Urban Centers
Sources
- U.S. Census Bureau, “Populations in All Age Groups Growing in the South,” press release CB26-105 (Vintage 2025), June 25, 2026.
- Business Stats, “How Many Adults Live in the US” (age groups, dependency ratios, July 2026 projection).
- SmartAsset via Boston 25 News, “US population trends by state,” September 17, 2026.
- Congressional Budget Office, “The Demographic Outlook 2026 to 2056,” January 2026.
- Population Reference Bureau, “Fact Sheet Aging in the United States” (Census 2023 projections).
- Congressional Research Service, “Recent Census projections” (Census 2023 age shares).