Key Fact & Findings
- New York (20,112,448), Los Angeles (12,844,441), and Chicago (9,434,123) remain the top three, but Dallas-Fort Worth (8,477,157) and Houston (7,904,627) are closing in.
- The 25 largest metros hold 143.2 million people, 41.9% of the US population.
- Dallas-Fort Worth gained 809,741 residents since 2020; Los Angeles lost 338,236.
- Los Angeles, Miami, and San Diego were the only top-25 metros to shrink in 2024 to 2025.
- Atlanta city is about 8% of its metro area; San Antonio city is about 55%.
- Eighty-six percent of Americans live in a metro area, 8.3% in a micro area, and 5.3% elsewhere.
- Los Angeles and Phoenix metros equal the sums of two counties each.
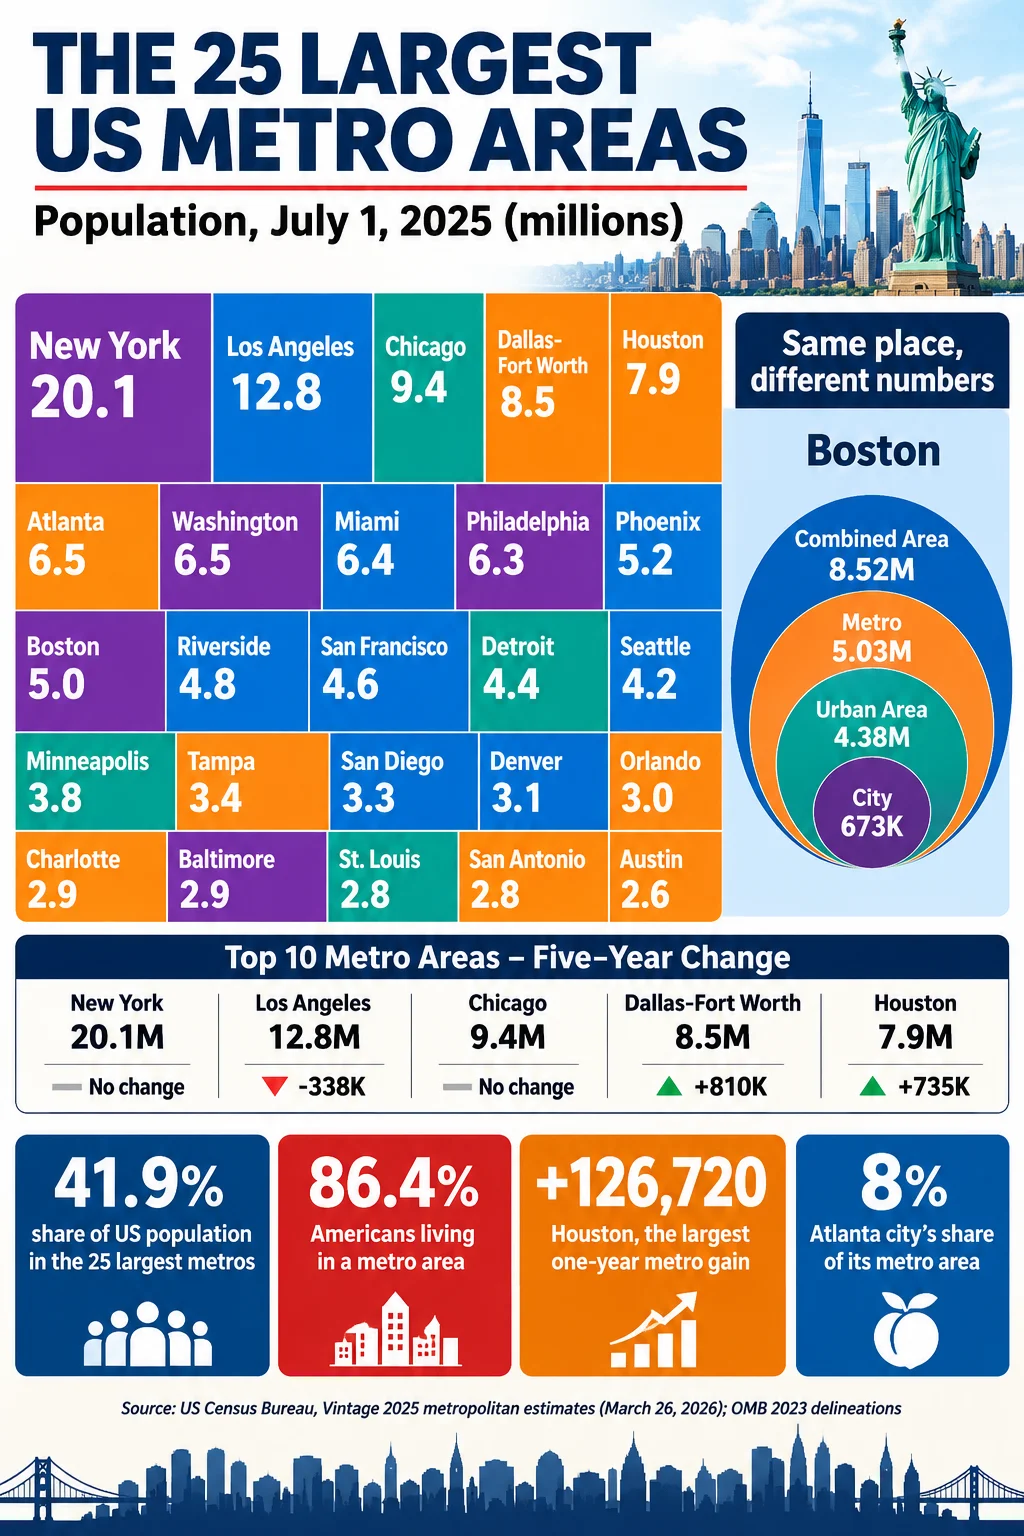
The New York metro area has 20,112,448 residents, 1.57 times as many as second-ranked Los Angeles (12,844,441), and the 25 largest metro areas together hold 143.2 million people, or 41.9% of the country. Those figures come from the Census Bureau’s Vintage 2025 metropolitan estimates, released March 26, 2026, for July 1, 2025, and they describe a country that is overwhelmingly metropolitan: 295,450,885 of 341,784,857 residents, or 86.4%, live in one of 387 metropolitan statistical areas.
This ranking uses metropolitan statistical areas (MSAs), defined by the Office of Management and Budget in its July 2023 delineations: an urban core of at least 50,000 people plus whole counties tied to it by commuting. MSAs are not cities, not urban areas and not combined statistical areas, and mixing those geographies is the most common source of error in population rankings. Each is treated separately below.
Data Snapshot
| Metric | Figure | Date |
|---|---|---|
| Largest metro area | New York-Newark-Jersey City, 20,112,448 | July 1, 2025 |
| Metro areas in the United States | 387 | 2023 delineation |
| Share of US population in metro areas | 86.4% | July 1, 2025 |
| Combined population of the 10 largest metros | 89.7 million (26.2% of the US) | July 1, 2025 |
| Combined population of the 25 largest metros | 143.2 million (41.9% of the US) | July 1, 2025 |
| Metro area growth, all metros | +0.6% (from +1.1%) | 2024-25 vs 2023-24 |
| Largest numeric metro gain | Houston, +126,720 | 2024 to 2025 |
| Largest numeric metro loss among the 25 largest | Los Angeles, -62,454 | 2024 to 2025 |
The 25 Largest Metropolitan Areas
Five-year change runs from July 1, 2020 to July 1, 2025. The table is based on Census Bureau Vintage 2025 data as compiled by Business Stats, and percentages are calculated from those figures.
| Rank | Metropolitan area | States | July 2025 | Change 2024-25 | Percent | Change since July 2020 | Percent |
|---|---|---|---|---|---|---|---|
| 1 | New York-Newark-Jersey City | NY-NJ | 20,112,448 | +32,361 | +0.2% | +112,455 | +0.6% |
| 2 | Los Angeles-Long Beach-Anaheim | CA | 12,844,441 | -62,454 | -0.5% | -338,236 | -2.6% |
| 3 | Chicago-Naperville-Elgin | IL-IN | 9,434,123 | +22,925 | +0.2% | -1,848 | 0.0% |
| 4 | Dallas-Fort Worth-Arlington | TX | 8,477,157 | +123,557 | +1.5% | +809,741 | +10.6% |
| 5 | Houston-Pasadena-The Woodlands | TX | 7,904,627 | +126,720 | +1.6% | +735,343 | +10.3% |
| 6 | Atlanta-Sandy Springs-Roswell | GA | 6,482,182 | +61,953 | +1.0% | +361,412 | +5.9% |
| 7 | Washington-Arlington-Alexandria | DC-VA-MD-WV | 6,465,724 | +50,206 | +0.8% | +205,086 | +3.3% |
| 8 | Miami-Fort Lauderdale-West Palm Beach | FL | 6,391,072 | -8,909 | -0.1% | +257,913 | +4.2% |
| 9 | Philadelphia-Camden-Wilmington | PA-NJ-DE-MD | 6,329,118 | +15,960 | +0.3% | +86,954 | +1.4% |
| 10 | Phoenix-Mesa-Chandler | AZ | 5,228,938 | +59,065 | +1.1% | +353,682 | +7.3% |
| 11 | Boston-Cambridge-Newton | MA-NH | 5,034,221 | +11,991 | +0.2% | +112,812 | +2.3% |
| 12 | Riverside-San Bernardino-Ontario | CA | 4,769,007 | +21,131 | +0.4% | +161,361 | +3.5% |
| 13 | San Francisco-Oakland-Fremont | CA | 4,630,041 | +6,607 | +0.1% | -115,812 | -2.4% |
| 14 | Detroit-Warren-Dearborn | MI | 4,390,913 | +13,868 | +0.3% | +5,560 | +0.1% |
| 15 | Seattle-Tacoma-Bellevue | WA | 4,161,883 | +43,068 | +1.0% | +134,069 | +3.3% |
| 16 | Minneapolis-St. Paul-Bloomington | MN-WI | 3,790,295 | +29,400 | +0.8% | +96,164 | +2.6% |
| 17 | Tampa-St. Petersburg-Clearwater | FL | 3,418,895 | +13,538 | +0.4% | +231,064 | +7.2% |
| 18 | San Diego-Chula Vista-Carlsbad | CA | 3,282,248 | -5,294 | -0.2% | -18,862 | -0.6% |
| 19 | Denver-Aurora-Centennial | CO | 3,092,037 | +10,945 | +0.4% | +121,938 | +4.1% |
| 20 | Orlando-Kissimmee-Sanford | FL | 2,957,672 | +37,690 | +1.3% | +277,242 | +10.3% |
| 21 | Charlotte-Concord-Gastonia | NC-SC | 2,938,830 | +54,122 | +1.9% | +270,488 | +10.1% |
| 22 | Baltimore-Columbia-Towson | MD | 2,857,781 | +4,259 | +0.1% | +10,643 | +0.4% |
| 23 | St. Louis | MO-IL | 2,814,421 | +3,027 | +0.1% | -5,390 | -0.2% |
| 24 | San Antonio-New Braunfels | TX | 2,813,140 | +38,402 | +1.4% | +244,368 | +9.5% |
| 25 | Austin-Round Rock-San Marcos | TX | 2,620,945 | +53,796 | +2.1% | +320,773 | +13.9% |
Texas and California each hold four of the 25 largest metros and Florida holds three. The gap between Chicago and Dallas-Fort Worth shrank from 1,768,555 residents in 2020 to 956,966 in 2025. Since July 2020 five of the 25 (Los Angeles, San Francisco, San Diego, St. Louis and Chicago) have become smaller, and Los Angeles lost 338,236 residents.
Rank Changes Since 2020
Phoenix passed Boston, Tampa passed San Diego, and Charlotte and Orlando both passed Baltimore and St. Louis. Washington moved ahead of Miami in 2024 and held seventh place in 2025 with a lead of 74,652. San Antonio now trails St. Louis by only 1,281 residents, after trailing by 251,039 in 2020.
The Top 10 in Brief
New York’s 20.1 million make the region larger than Chicago and Dallas-Fort Worth combined (17.9 million). Los Angeles-Long Beach-Anaheim is exactly the sum of two counties, Los Angeles County (9,694,934) and Orange County (3,149,507). Dallas-Fort Worth and Houston are the fastest-growing of the five largest, adding 809,741 and 735,343 residents since July 2020, about 1.5 million combined. Atlanta, Washington, Miami and Philadelphia sit within 153,064 residents of one another between sixth and ninth, and Phoenix, at 5,228,938, rounds out the group. The Phoenix metro is the sum of Maricopa County (4,689,558) and Pinal County (539,380).
Core County Versus Metro
A metro area is built from whole counties, so the share held by the central county varies widely.
| Metro | Central county | County population | Metro population | County share |
|---|---|---|---|---|
| Los Angeles | Los Angeles County | 9,694,934 | 12,844,441 | 75.5% |
| Phoenix | Maricopa County | 4,689,558 | 5,228,938 | 89.7% |
| Houston | Harris County | 5,045,026 | 7,904,627 | 63.8% |
| Seattle | King County | 2,344,939 | 4,161,883 | 56.3% |
| Charlotte | Mecklenburg County | 1,233,383 | 2,938,830 | 42.0% |
Outer counties are where growth often concentrates. In Houston, Montgomery County (781,194) added 30,011 residents in a year, and Fort Bend County (975,191) added 24,163, while Collin County in Dallas-Fort Worth added 42,966, second only to Harris County nationally.
City Population Versus Metro Population
The principal city is often a minority of its metro area.
| Metro | Principal city population | Metro population | City share of metro |
|---|---|---|---|
| San Diego | 1,406,106 | 3,282,248 | 42.8% |
| New York | 8,584,629 | 20,112,448 | 42.7% |
| Austin | 1,002,632 | 2,620,945 | 38.3% |
| Charlotte | 964,784 | 2,938,830 | 32.8% |
| Phoenix | 1,665,481 | 5,228,938 | 31.9% |
| Houston | 2,397,315 | 7,904,627 | 30.3% |
| Los Angeles | 3,869,089 | 12,844,441 | 30.1% |
| Chicago | 2,731,585 | 9,434,123 | 29.0% |
| Philadelphia | 1,574,281 | 6,329,118 | 24.9% |
| Denver | 740,613 | 3,092,037 | 24.0% |
| Seattle | 784,777 | 4,161,883 | 18.9% |
| San Francisco | 826,079 | 4,630,041 | 17.8% |
| Dallas (city only) | 1,329,491 | 8,477,157 | 15.7% |
| Detroit | 649,095 | 4,390,913 | 14.8% |
| Boston | 672,973 | 5,034,221 | 13.4% |
| Washington | 693,645 | 6,465,724 | 10.7% |
| Atlanta | 529,110 | 6,482,182 | 8.2% |
| Miami | 489,812 | 6,391,072 | 7.7% |
Atlanta city holds fewer than one in 10 of its metro residents, and Miami fewer than one in 12. San Antonio is the reverse: the city (1,548,422) accounts for about 55% of its metro area. This is why Phoenix city (1,665,481) is larger than Philadelphia city (1,574,281) while the Philadelphia metro area is about 1.1 million residents larger than Phoenix’s.
Three Definitions of the Same Region
| Geography (Boston example) | Population | Reference |
|---|---|---|
| Boston city | 672,973 | July 2025 |
| Boston urban area (Census) | 4,382,009 | 2020 Census |
| Boston-Cambridge-Newton MSA | 5,034,221 | July 2025 |
| Boston-Worcester-Providence CSA | 8,521,063 | July 2025 |
The combined statistical area is 1.69 times the size of the MSA because it joins neighboring metro and micro areas whose commuting links are weaker. Urban areas, which follow continuous development rather than county lines, are covered in the companion article on largest urban areas. Under the 2023 OMB delineation there are 393 MSAs (387 in the US and 6 in Puerto Rico), 542 micropolitan areas and 184 combined statistical areas.
What Is Driving Metro Growth
Metro areas as a group grew 0.6% in 2024 to 2025, down from 1.1%, and 310 of the 387 metros grew more slowly than a year earlier. Metro growth of 1,704,826 came from net international migration (+1,209,432) and natural increase (+613,743), partly offset by net domestic migration (-119,205). In other words, international migration supplied about 71% of net metro growth even in a year when it slowed sharply. The metro rate of net international migration fell from 8.92 to 4.11 per 1,000 residents.
Conclusion
The metro ranking has two speeds. At the top, New York, Los Angeles and Chicago are essentially flat over five years, while two Texas metros added a combined 1.5 million people and reduced the gap with Chicago by almost half. Below them, Sun Belt metros such as Charlotte, Orlando, San Antonio and Austin passed older Northern and coastal regions. How long that continues depends heavily on international migration, which supplied roughly seven of every 10 metro additions in a year when it was already falling by half.
Frequently Asked Questions
1. What is the largest metropolitan area in the USA?
New York-Newark-Jersey City, with 20,112,448 residents on July 1, 2025. Los Angeles-Long Beach-Anaheim has 12,844,441, and Chicago-Naperville-Elgin has 9,434,123.
2. What are the 10 largest metropolitan areas in America?
New York, Los Angeles, Chicago, Dallas-Fort Worth, Houston, Atlanta, Washington, Miami, Philadelphia, and Phoenix, in that order for July 2025.
3. How many metropolitan areas are in the United States?
There are 387 in the 50 states and the District of Columbia under the 2023 OMB delineation, plus 6 in Puerto Rico.
4. Is New York the largest metropolitan area in America?
Yes. Its 20.1 million residents are 1.57 times those of Los Angeles. New York City alone has 8,584,629, which is 42.7% of the metro population.
5. What is the difference between a city and a metropolitan area?
A city counts residents inside municipal limits. A metro area counts whole counties linked to an urban core through commuting, so it includes suburbs and sometimes other cities.
6. Which US metropolitan areas cross state borders?
New York (NY-NJ), Chicago (IL-IN), Washington (DC-VA-MD-WV), Philadelphia (PA-NJ-DE-MD), Boston (MA-NH), Minneapolis (MN-WI), Charlotte (NC-SC), and St. Louis (MO-IL) are among the 25 largest.
7. What is the difference between an MSA and a CSA?
An MSA is a core plus its commuting counties. A combined statistical area joins adjacent metro and micro areas with weaker links; the Boston CSA (8.52 million) is 1.69 times the Boston MSA.
8. Are metropolitan areas the same as urban areas?
No. Urban areas follow continuously developed land from the 2020 Census. The New York urban area had 19,426,449 residents in 2020, while the New York MSA had 20,112,448 in 2025.
9. Which large metro lost the most population since 2020?
Los Angeles, down 338,236 (2.6%), followed by San Francisco (-115,812) and San Diego (-18,862).
10. Which large metro is growing fastest?
Among the 25 largest, Austin grew 2.1% in 2024 to 2025 and 13.9% since July 2020, followed by Charlotte (1.9%) and Houston (1.6%).
Sources
- U.S. Census Bureau, “Slow Growth Impacts Nation’s Largest Counties Hardest,” press release CB26-56 (Vintage 2025 county, metro and micro estimates), March 26, 2026.
- Business Stats, “The 25 Largest US Metro Areas in 2025” (top-25 table, five-year changes, CSA and share calculations, based on Census Bureau CBSA-EST2025-ALLDATA and FRED series).
- U.S. Census Bureau, “Population Growth Holds Steady in Midsized Cities Amid Widespread Slowdown,” press release CB26-80, May 14, 2026.
- U.S. Census Bureau, 2020 Census Urban Areas Facts.
- Office of Management and Budget, Bulletin No. 23-01 (July 2023 metropolitan delineations).