
World Population: 8.3 Billion People in October 2026
Based on UN World Population Prospects 2024 · ~140M births/year · ~58M deaths/year
Net growth ≈ +82M/year · Base population set to 8,282,474,995 as of Mar 21, 2026
Sources: UN DESA, WHO, PRB · Counters reset at midnight UTC daily
| # | Flag | Country | Population ▾ | World Share | Share Bar | Growth Rate | Density /km² | Births/Day | Deaths/Day |
|---|
Population figures based on UN World Population Prospects 2024 · All country populations sum to world total 8,282,474,995
Growth rates, births & deaths derived from UN DESA demographic indicators · Density based on UN land area data
Live counters update every second · Sources: UN DESA, PRB, World Bank, CIA World Factbook
Population estimates based on UN World Population Prospects 2024 · All continents sum to world total 8,282,474,995
North & South America split based on UN geoscheme · Antarctica has no permanent civilian population
Sources: UN DESA, PRB, World Bank, CIA World Factbook · Counters reset at midnight UTC daily
“Behind every population number is a life, a story, and a shared responsibility to shape a future where growth is guided by care, balance, and opportunity for all.”
Current World Population: 8.3 Billion
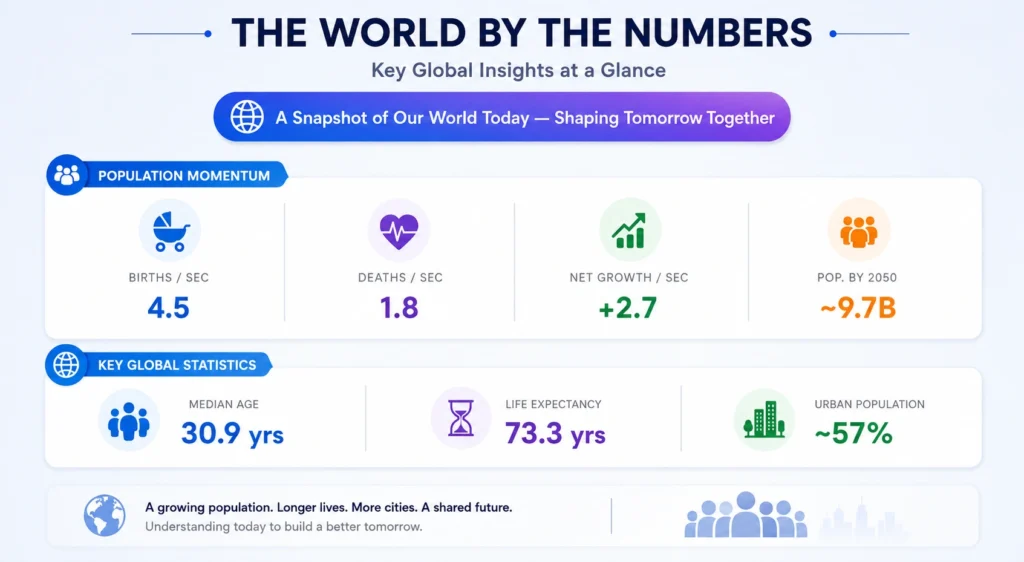
Somewhere on Earth right now, a child is being born. Statistically, approximately 470,113 live births occur every day in 2026, a figure so staggering it demands a moment of pause. And yet, for the first time in decades, the demographic story of the 21st century is not primarily about how fast the world population is growing, but about how quickly that growth is decelerating, and what that means for economies, governments, and societies across every continent.
The total world population as of 2026 stands at approximately 8.3 billion, with an annual growth rate of 0.825%. That number, tracked in real time by population counters drawing on United Nations and World Bank data, represents a milestone of a particular kind. It took all of human prehistory and recorded history until around 1800 for the world population to reach one billion, and only 218 more years from there to reach 8 billion. The acceleration was extraordinary. The deceleration now underway is equally significant.
What makes the current world population moment so analytically rich is its layered complexity. Raw headcount numbers tell only part of the story. The deeper shifts, including declining fertility rates in Asia and Europe, explosive youth demographics in sub-Saharan Africa, rapid urbanization, and the quiet arithmetic of aging populations, collectively determine how civilization will function over the next century. The live world population counter ticks upward every second, but the forces shaping where it stops, and when, are already in motion.
Humanity's Extraordinary Population Acceleration
Global Population and Demographic Change: 1900–2025
| Year | World Population | Annual Growth Rate | Median Age | Fertility Rate | Population Density |
|---|---|---|---|---|---|
| 1900 | 1.60 billion | 0.6% | 20.5 yrs | 5.0 | 11/km² |
| 1905 | 1.69 billion | 0.7% | 20.4 yrs | 5.0 | 11/km² |
| 1910 | 1.77 billion | 0.7% | 20.3 yrs | 5.0 | 12/km² |
| 1915 | 1.84 billion | 0.7% | 20.2 yrs | 4.9 | 12/km² |
| 1920 | 1.92 billion | 0.8% | 20.2 yrs | 4.9 | 13/km² |
| 1925 | 2.04 billion | 0.8% | 20.3 yrs | 4.8 | 14/km² |
| 1930 | 2.07 billion | 0.8% | 20.4 yrs | 4.8 | 14/km² |
| 1935 | 2.13 billion | 0.8% | 20.7 yrs | 4.7 | 14/km² |
| 1940 | 2.30 billion | 0.9% | 21.1 yrs | 4.6 | 15/km² |
| 1945 | 2.34 billion | 1.0% | 21.6 yrs | 4.5 | 16/km² |
| 1950 | 2.49 billion | 1.8% | 23.6 yrs | 4.9 | 17/km² |
| 1955 | 2.74 billion | 1.9% | 22.4 yrs | 5.0 | 18/km² |
| 1960 | 3.02 billion | 1.9% | 21.5 yrs | 4.7 | 20/km² |
| 1965 | 3.33 billion | 2.0% | 20.8 yrs | 5.1 | 22/km² |
| 1970 | 3.69 billion | 2.1% | 20.3 yrs | 4.8 | 25/km² |
| 1975 | 4.07 billion | 2.0% | 20.7 yrs | 4.1 | 27/km² |
| 1980 | 4.45 billion | 1.8% | 21.5 yrs | 3.7 | 30/km² |
| 1985 | 4.87 billion | 1.8% | 22.0 yrs | 3.5 | 33/km² |
| 1990 | 5.33 billion | 1.8% | 22.9 yrs | 3.3 | 36/km² |
| 1995 | 5.76 billion | 1.6% | 24.0 yrs | 2.9 | 39/km² |
| 2000 | 6.17 billion | 1.4% | 25.1 yrs | 2.8 | 41/km² |
| 2005 | 6.59 billion | 1.3% | 26.1 yrs | 2.6 | 44/km² |
| 2010 | 7.02 billion | 1.3% | 27.2 yrs | 2.6 | 47/km² |
| 2015 | 7.47 billion | 1.3% | 28.3 yrs | 2.5 | 50/km² |
| 2020 | 7.89 billion | 1.1% | 29.6 yrs | 2.3 | 53/km² |
| 2025 | 8.23 billion | 0.9% | 30.9 yrs | 2.2 | 55/km² |
*Approximate density calculated against global land area; it is intended as a broad demographic indicator rather than a measure of where people actually live.
Source: United Nations, World Population Prospects 2024 Revision. Historical values and demographic indicators are presented in rounded/approximate form for readability and should not be interpreted as exact counts.
The table reveals three broad phases. From 1900 to around 1950, the world population increased from approximately 1.60 billion to 2.49 billion, while fertility remained high. From the 1950s through the 1970s, population growth accelerated dramatically, with the annual growth rate reaching roughly 2% or more and the global population passing 3 billion in 1960 and 4 billion in the 1970s.
The pattern changed substantially after 1980. Fertility began falling across much of the world, while population continued to increase because of demographic momentum and improvements in survival. The global population reached approximately 6.17 billion in 2000, 7.02 billion in 2010, 7.89 billion in 2020, and 8.23 billion in 2025. Meanwhile, the median age rose from roughly 25 years in 2000 to nearly 31 years in 2025.
The most important takeaway is that population growth is slowing even as the total population continues to rise. The fertility rate has moved much closer to the long-term replacement level, while the world's population has become substantially older than it was during the population-growth surge of the mid-twentieth century. This combination marks a major transition from a period dominated by rapid population expansion toward one increasingly shaped by population ageing, lower fertility, regional divergence, and eventual global population stabilization.
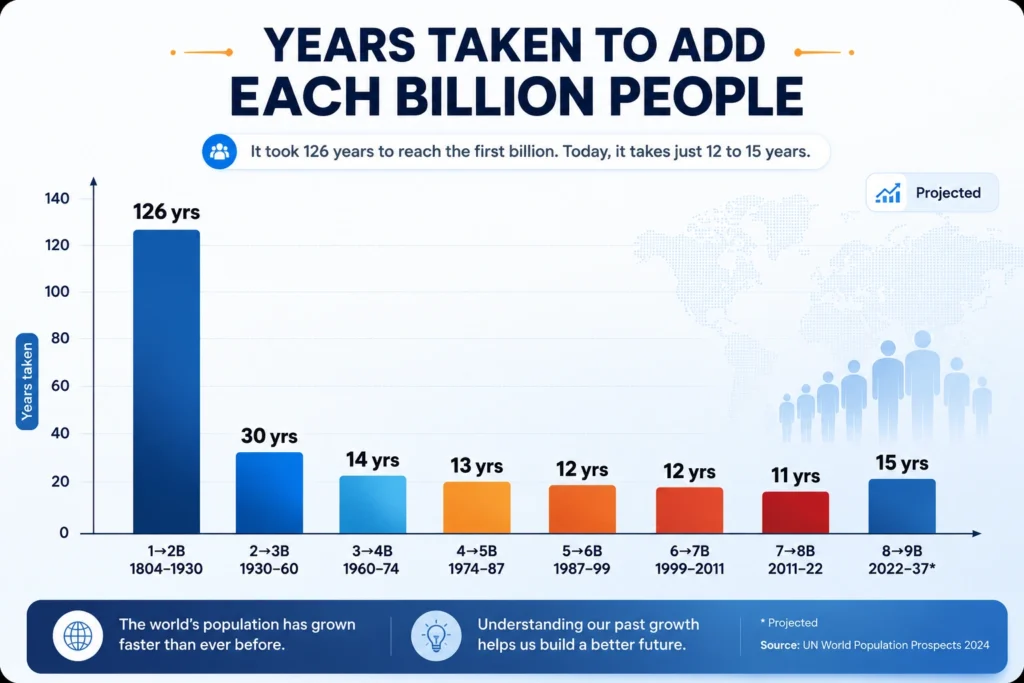
For most of human history, population growth was remarkably slow. It took approximately 126 years for the global population to increase from 1 billion to 2 billion, reaching that milestone around 1930. But the pace changed dramatically afterward. The world reached 3 billion in 1960, 4 billion in 1974, 5 billion in 1987, 6 billion in 1999, 7 billion in 2011, and 8 billion in 2022. Each additional billion people arrived faster than the one before it.
This acceleration was driven by major improvements in survival, healthcare, sanitation, nutrition, agriculture, and living conditions. As fewer children died young and people lived longer, populations expanded rapidly. The period from 1950 onward was particularly significant, producing one of the fastest episodes of population growth in human history.
The demographic environment is now changing. Moving from 8 billion to 9 billion is expected to take approximately 15 years, compared with just 11 years for the previous billion. The world is still adding people, but the pace is slowing. This transition marks the beginning of a new demographic era in which population aging, declining fertility, and eventual population stabilization will become increasingly important.
Asia-Pacific Is Home to More Than Half of Humanity
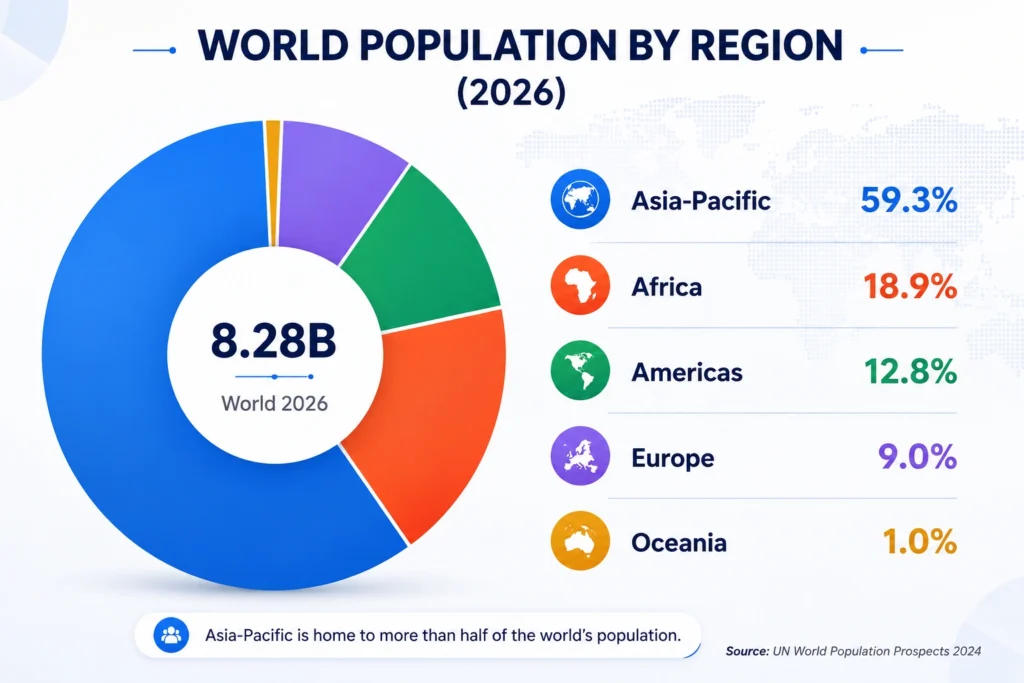
With a global population of approximately 8.28 billion in 2026, humanity is distributed very unevenly across the planet. Asia-Pacific accounts for approximately 59.3 percent of the world's population, representing roughly 4.89 billion people. No other broad region comes close to this level of demographic concentration.
Africa is the second-largest population region, with approximately 1.56 billion people, representing 18.9 percent of the global population. The Americas account for approximately 12.8 percent, Europe for 9.0 percent, and Oceania for approximately 1.0 percent. Together, these numbers demonstrate how strongly global population remains concentrated in Asia-Pacific.
However, the future distribution of people is changing. Asia is moving toward slower growth and, in some countries, population decline, while Africa is experiencing much stronger expansion. This means that although Asia-Pacific will remain enormously important, a growing share of future global population growth will come from Africa, changing the demographic and economic balance of the world.
Population by Continent: Africa Emerges as the Growth Leader
| Region | Population (approx.) | Share of World Total | Growth Trajectory |
|---|---|---|---|
| Asia-Pacific | 4.889 billion | 59.27% | Slowing significantly |
| Africa | 1.558 billion | 18.89% | Accelerating |
| The Americas | 1.057 billion | 12.81% | Moderate, stable |
| Europe | 744 million | 9.02% | Declining in most nations |
| Oceania | ~45 million | ~0.5% | Modest growth |
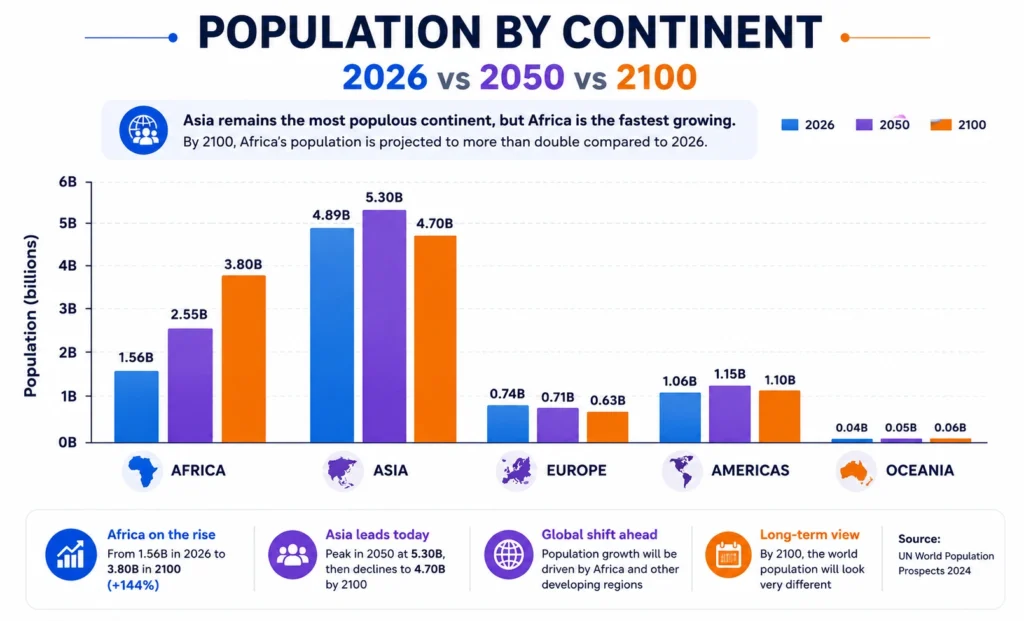
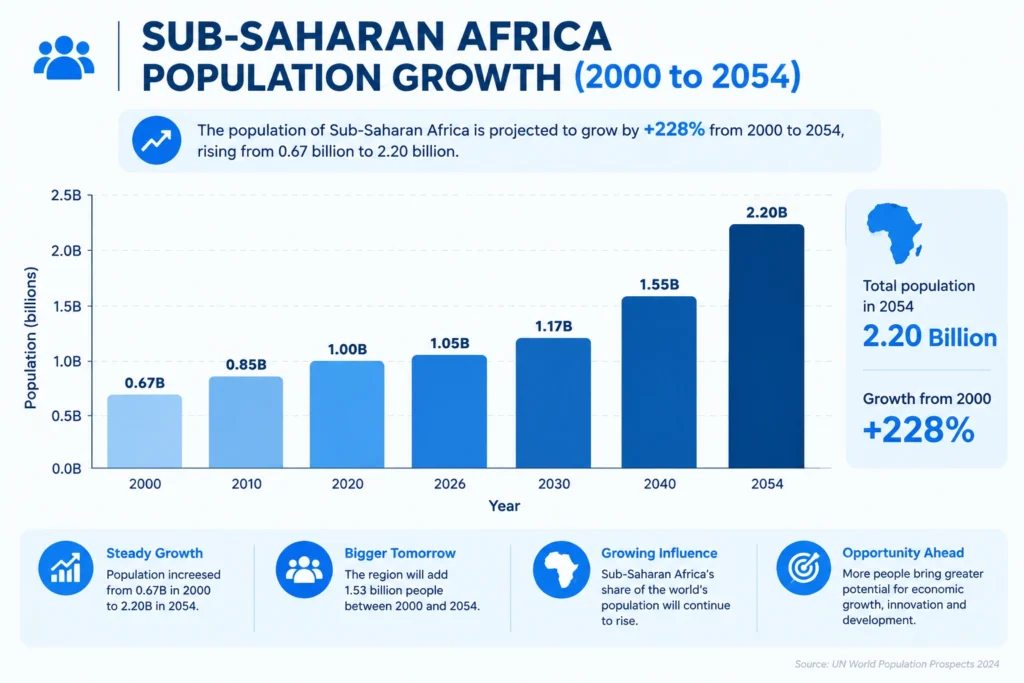
Asia remains the world's most populous continent, with approximately 4.89 billion people in 2026. Its population is projected to rise to 5.30 billion by 2050, before declining to approximately 4.70 billion by 2100. Africa follows a very different trajectory, increasing from 1.56 billion in 2026 to 2.55 billion in 2050 and reaching approximately 3.80 billion by 2100. Over the full period, Africa's population is projected to grow by approximately 144 percent.
The other continents experience considerably smaller changes. Europe's population is projected to decline from approximately 0.74 billion in 2026 to 0.71 billion in 2050 and 0.63 billion by 2100. The Americas remain comparatively stable, moving from approximately 1.06 billion to 1.15 billion and then approximately 1.10 billion. Oceania remains the smallest population region, increasing from approximately 0.04 billion in 2026 to 0.05 billion in 2050 and 0.06 billion by 2100.
These different trajectories point toward a major redistribution of global population growth. Asia is expected to remain the largest population center, but its eventual decline contrasts sharply with Africa's continued expansion. By 2100, Africa is projected to have more than twice its 2026 population, while Europe becomes smaller and the Americas remain relatively stable. The result will be a world in which future population growth is increasingly concentrated in Africa and other developing regions, creating major implications for employment, infrastructure, education, healthcare, cities, markets, and economic development.
Africa's Population Is Rising as Asia Approaches a Turning Point
Africa is entering one of the most significant periods of population growth in its history. Its population is approximately 1.56 billion in 2026 and is projected to reach approximately 2.55 billion by 2050 and 3.80 billion by 2100. This represents a dramatic expansion over the course of the century.
Asia is following a very different trajectory. Its population is approximately 4.89 billion in 2026, rising to around 5.30 billion by 2050 before declining to approximately 4.70 billion by 2100. Europe is also expected to contract, moving from approximately 0.74 billion to 0.63 billion over the same period.
These contrasting trajectories will gradually reshape the geography of humanity. Asia will remain the world's largest population region for a long time, but Africa will account for an increasingly large share of future growth. This shift has implications for global investment, labor markets, consumer markets, migration, infrastructure, food demand, and economic development.
The World's Population Is Concentrated in a Small Number of Countries
Population size varies enormously between countries. India has approximately 1.5 billion people, while China also has approximately 1.5 billion. The United States follows with approximately 357 million, Indonesia with approximately 297 million, and Pakistan with approximately 257 million.
Other major population centers include Nigeria at approximately 235 million, Bangladesh at approximately 226 million, Brazil at approximately 149 million, Russia at approximately 149 million, Ethiopia at approximately 139 million, and Mexico at approximately 137 million. Japan, the Philippines, Egypt, DR Congo, Vietnam, Iran, Germany, Thailand, and the United Kingdom also rank among the world's largest populations.
The concentration of people in these countries has major global consequences. Large populations create enormous domestic markets and workforce pools while also generating substantial requirements for food, housing, infrastructure, healthcare, education, and energy. The future demographic importance of countries such as Nigeria, Ethiopia, DR Congo, Pakistan, India, and the Philippines will extend well beyond their borders as their populations influence global economic and social trends.
India and China: The World's Population Balance Is Changing
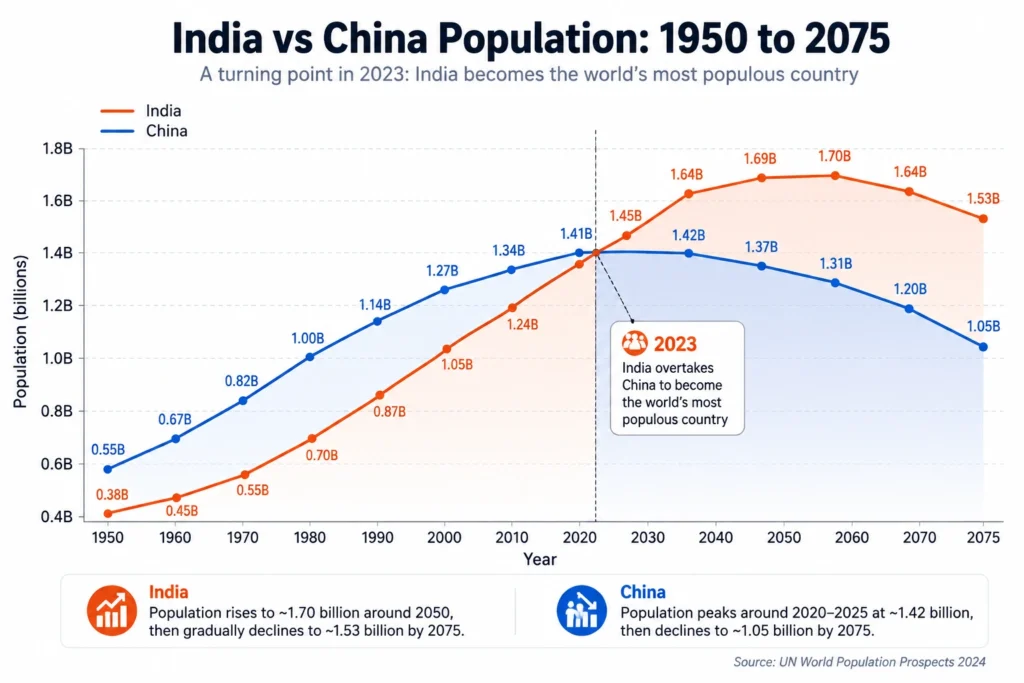
India and China have dominated the global population landscape for decades, but their demographic paths are now moving in different directions. In 1950, India had approximately 0.38 billion people, compared with 0.55 billion in China. Over the following decades, both populations grew substantially. India reached approximately 1.05 billion in 2000 and 1.24 billion in 2010, while China reached approximately 1.27 billion in 2000 and 1.34 billion in 2010.
The relationship changed dramatically around 2023, when India overtook China to become the world's most populous country. By 2026, India is projected at approximately 1.45 billion people, compared with approximately 1.40 billion in China. India's population is expected to continue rising, reaching approximately 1.64 billion in 2040, 1.69 billion in 2050, and around 1.70 billion by 2055, before gradually declining to approximately 1.53 billion by 2075.
China is following a very different trajectory. Its population is projected to peak around 2020 to 2025 at approximately 1.42 billion, followed by a sustained decline. China is projected to fall to approximately 1.37 billion by 2050, 1.31 billion by 2055, 1.20 billion by 2070, and approximately 1.05 billion by 2075. The contrast between India's continued growth and China's population decline represents a major demographic shift that will influence labor forces, consumer markets, economic growth, urbanization, and the balance of population between the two countries.
Global Population Growth Is Losing Momentum
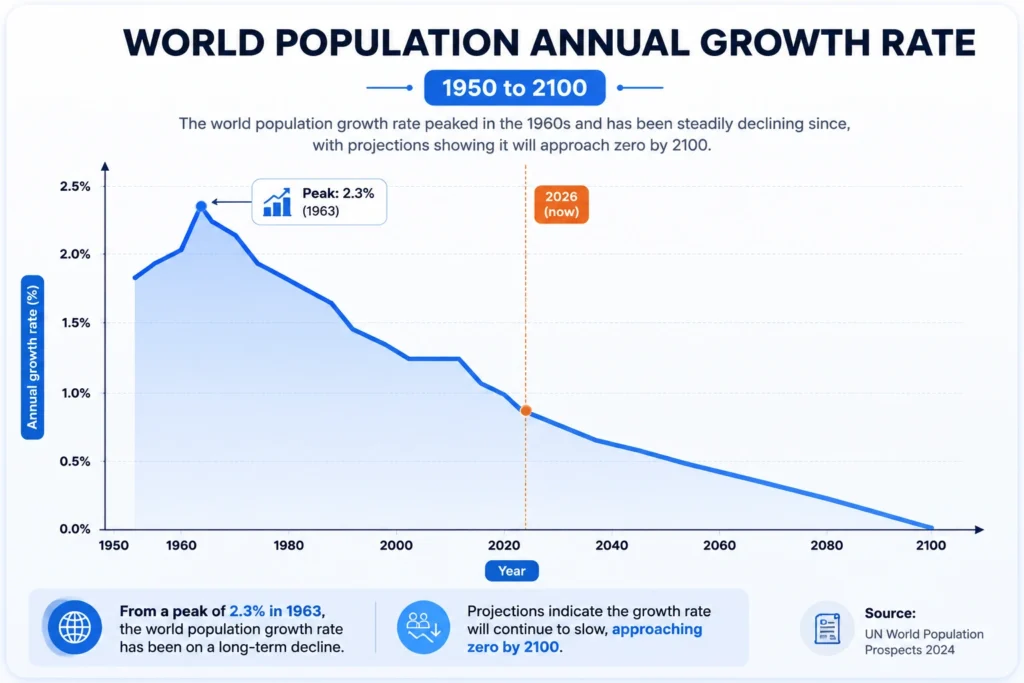
The world once experienced population growth at an extraordinary pace. Annual global population growth reached approximately 2.3 percent in 1963, representing the peak of the modern population expansion. Since then, the rate has steadily declined, reaching approximately 0.8 percent in 2026.
A falling growth rate does not mean that the global population immediately begins shrinking. The number of births can still exceed the number of deaths while the rate of increase becomes progressively smaller. This distinction is essential for understanding modern population dynamics. A world population of more than 8 billion can continue increasing even while the percentage growth rate falls substantially.
The underlying demographic shift is closely connected with declining fertility. The global fertility rate was approximately 2.3 births per woman in 2024, only slightly above the replacement level of 2.1. As fertility continues to fall in many countries, population growth will increasingly depend on existing population structure, longevity, and demographic momentum rather than high birth rates.
Fastest Growing vs Fastest Declining Countries in 2026
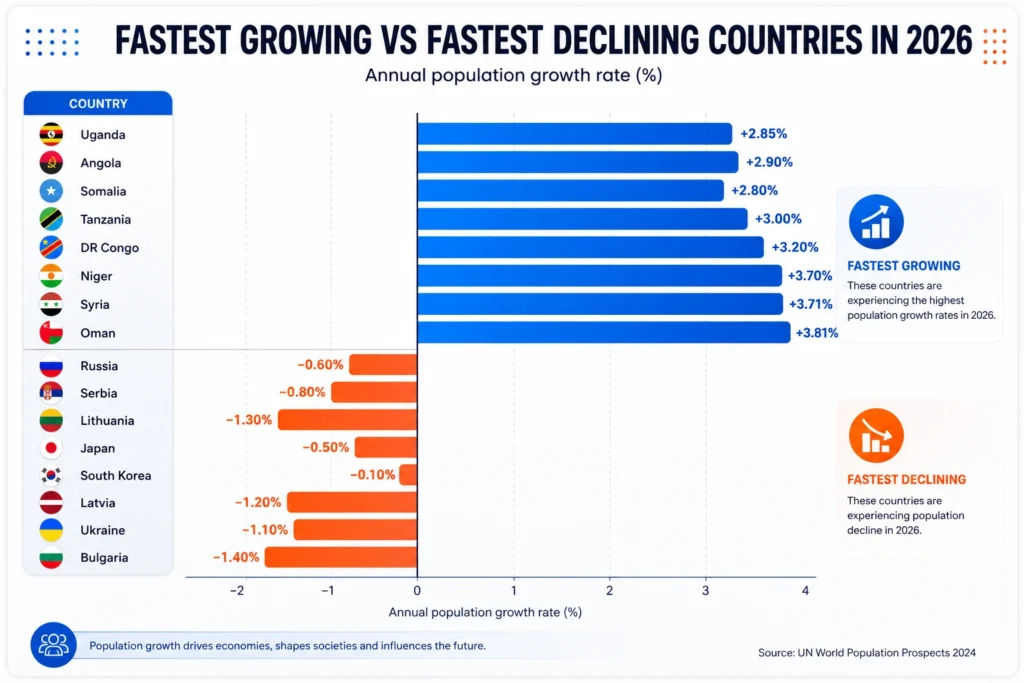
Population growth is moving in very different directions across the world in 2026. Countries such as Uganda, Angola, Somalia, Tanzania, DR Congo, Niger, Syria, and Oman are experiencing some of the fastest annual population growth rates. Their growth rates range from approximately 2.80 percent to 3.81 percent, with Oman at around 3.81 percent, Syria at 3.71 percent, Niger at 3.70 percent, and DR Congo at 3.20 percent.
At the other end of the demographic spectrum, several countries are experiencing population decline. Bulgaria has an annual decline rate of approximately 1.40 percent, followed by Lithuania at 1.30 percent, Latvia at 1.20 percent, and Ukraine at 1.10 percent. Serbia is declining by approximately 0.80 percent, Russia by 0.60 percent, Japan by 0.50 percent, and South Korea by approximately 0.10 percent.
These contrasting growth rates reflect two very different demographic realities. Countries with rapid population growth are likely to see expanding demand for housing, education, healthcare, jobs, infrastructure, food, and other essential services. Countries experiencing population decline face a different set of pressures, including shrinking workforces, aging populations, fewer young people, and increasing demands on social support systems. Population growth is therefore not simply about having more or fewer people. It can fundamentally reshape the economic and social structure of a country.
The Global Population Is Getting Older
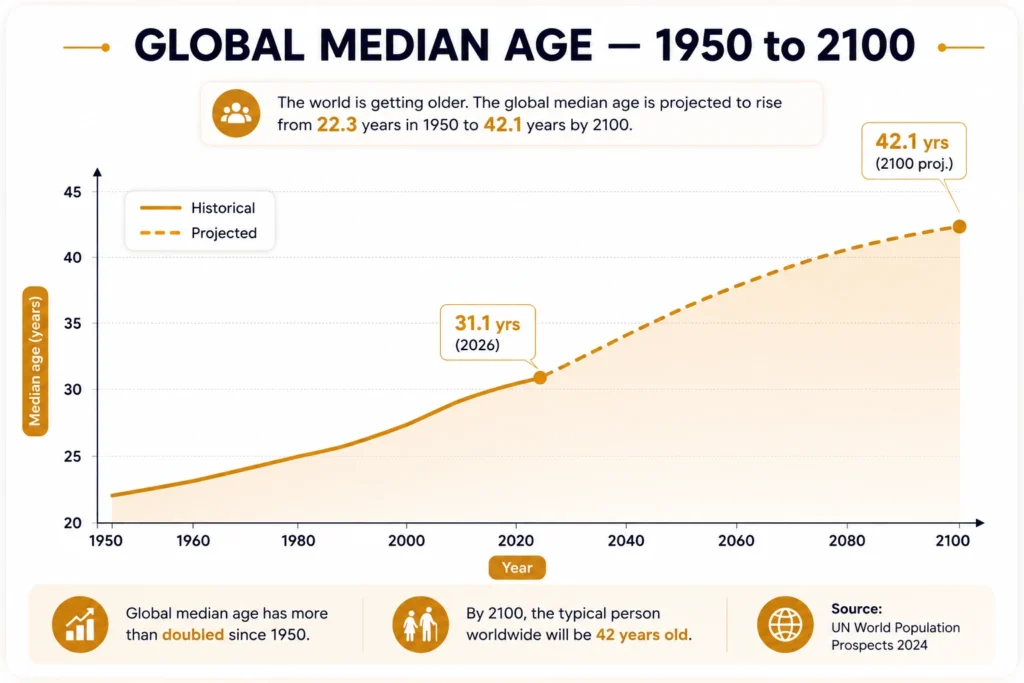
The age of humanity is changing alongside its size. In 2026, the global median age is approximately 31.1 years, meaning half of the world's population is younger than this age and half is older. This is considerably different from the much younger population structure that characterized earlier periods of rapid population growth.
The long-term direction is even more striking. The global median age is projected to reach approximately 42.1 years by 2100. The combination of fewer births and longer lives is gradually shifting the balance toward older age groups.
An aging population affects almost every part of society. Countries need to rethink healthcare systems, retirement arrangements, pensions, employment, housing, and social support. At the same time, businesses must adapt to changing consumer needs and potentially smaller workforces. Population aging is therefore not simply a demographic statistic. It is an economic and social transformation.
The World's Largest Population Group Is Working Age
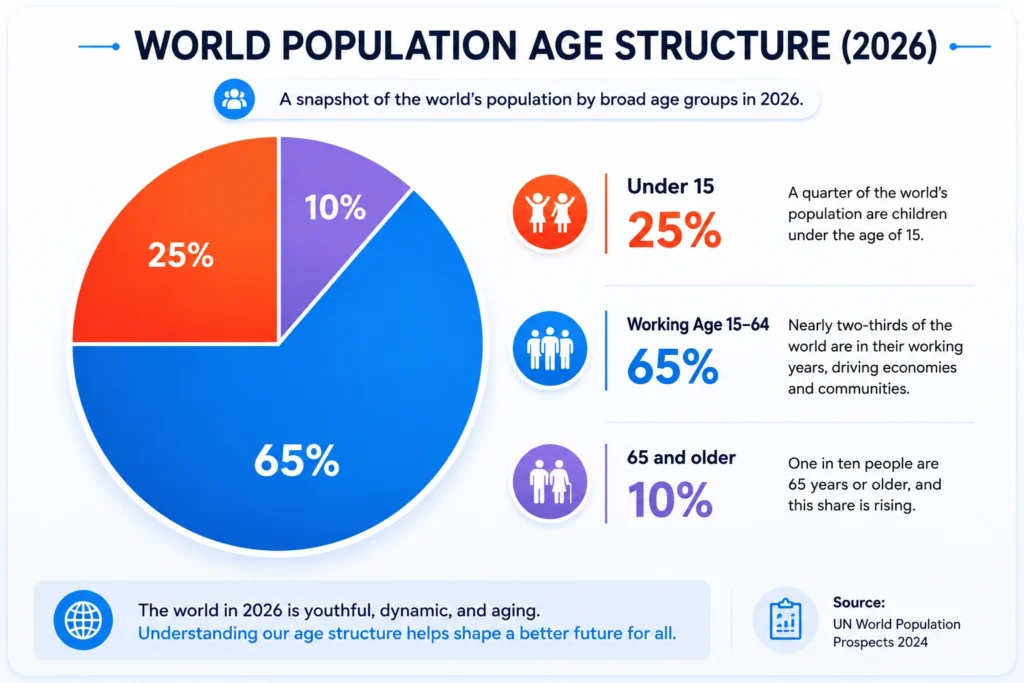
Approximately 65 percent of the world's population in 2026 falls between the ages of 15 and 64. Another 25 percent is under the age of 15, while approximately 10 percent is aged 65 and older. This means that working-age people currently represent nearly two-thirds of humanity.
A large working-age population can provide a significant economic advantage. Millions of people entering employment can expand production, consumption, entrepreneurship, taxation, and investment. Countries with growing working-age populations can benefit enormously when they are able to provide sufficient education, skills, employment opportunities, healthcare, and infrastructure.
The opportunity, however, is not automatic. A large working-age population becomes a demographic advantage only when economies can productively absorb it. Countries with rapidly expanding young populations therefore face a race between population growth and economic opportunity. Creating enough productive jobs and developing human capital will be critical to determining whether demographic growth becomes an economic dividend.
More Than Half of Humanity Lives in Urban Areas
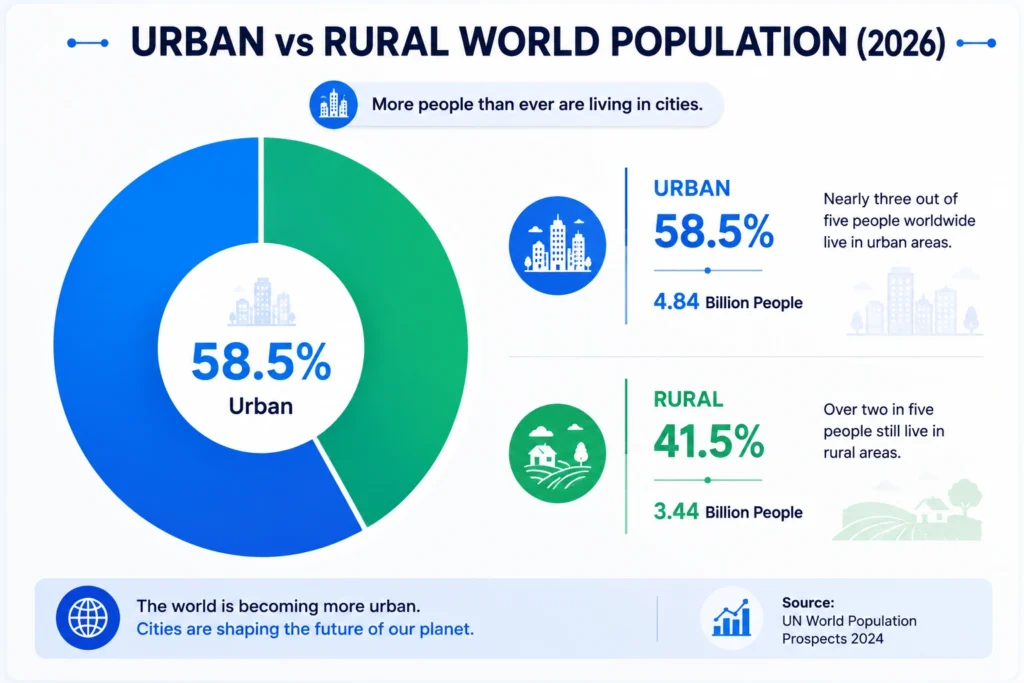
Approximately 58.5 percent of the global population lives in urban areas in 2026. That represents roughly 4.84 billion people, compared with approximately 3.44 billion people living in rural areas. Humanity has therefore become predominantly urban.
Urbanization fundamentally changes the way people live and economies function. Cities concentrate jobs, businesses, universities, hospitals, transportation networks, technology, financial services, and cultural activity. They can generate enormous economic productivity because large numbers of people and businesses operate within relatively concentrated geographic areas.
Rapid urban growth also creates significant challenges. Cities need enough housing, roads, public transport, electricity, water, sanitation, schools, hospitals, and employment opportunities to accommodate growing populations. The future of urbanization will therefore depend not only on how many people move into cities, but on whether cities can expand efficiently, affordably, and sustainably.
The Global Population Is Almost Evenly Divided
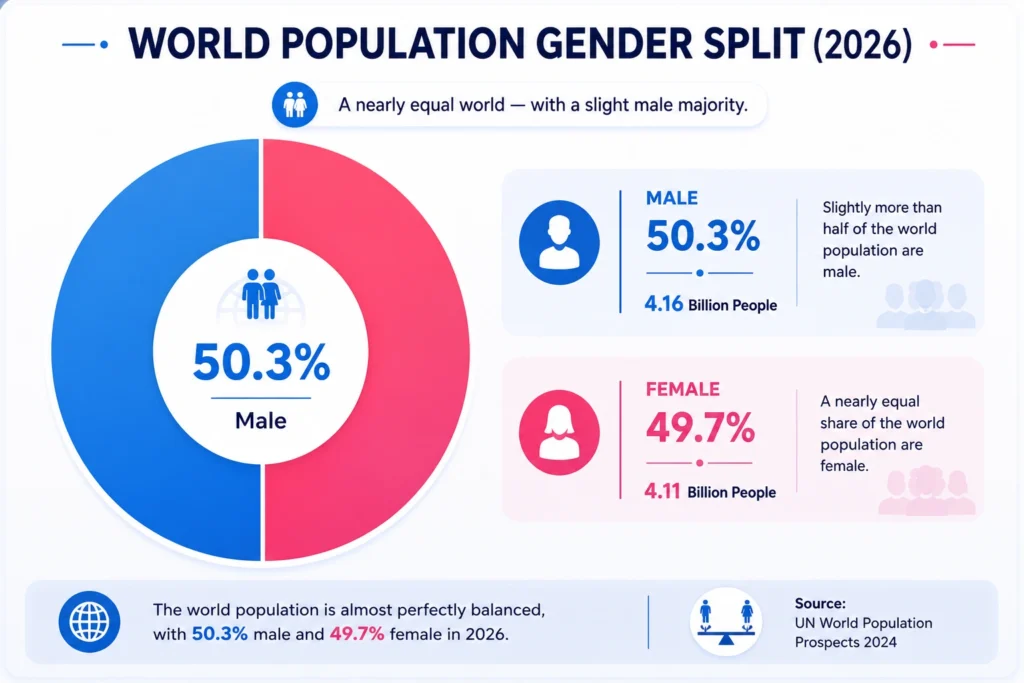
The global population is remarkably close to an even split between males and females. In 2026, males account for approximately 50.3 percent, or around 4.16 billion people, while females account for approximately 49.7 percent, or around 4.11 billion people.
A difference of only a few percentage points can appear small when viewed globally, but demographic composition varies considerably across countries and age groups. Birth rates, mortality, migration, and differences in life expectancy all influence the balance between males and females within individual populations.
The global numbers nevertheless provide an important perspective on humanity as a whole. More than 8 billion people form an incredibly diverse population, but at the broadest level, the male and female populations remain remarkably balanced. Understanding these demographic structures is important for analyzing households, labor markets, healthcare demand, migration, and population change.
World Religion: A Diverse Global Landscape
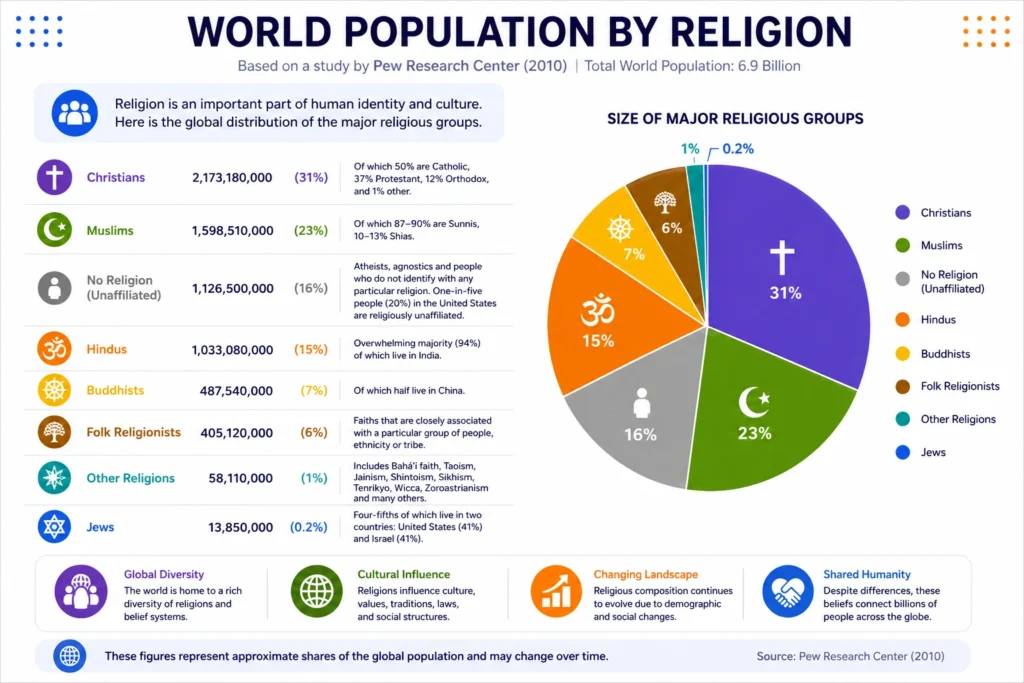
Religion remains one of the most significant dimensions of the world’s population structure, shaping cultures, traditions, values, communities, and social institutions across regions. The global religious landscape is dominated by Christianity and Islam, while Hinduism, Buddhism, folk religions, Judaism, other faiths, and religiously unaffiliated populations together represent a substantial share of humanity. The figures provided in the source are based on a 2010 world population of approximately 6.9 billion and a Pew Research Center study, so they should be understood as a historical demographic snapshot rather than a current 2026 estimate.
Christianity was the largest religious group in the source, accounting for approximately 31% of the world’s population, or about 2.17 billion people. Muslims represented around 23%, with approximately 1.60 billion people, followed by people with no religious affiliation at 16%, or about 1.13 billion. Hinduism accounted for approximately 15%, representing about 1.03 billion people, while Buddhists represented roughly 7%, or 488 million. Folk religions accounted for around 6%, while other religions and Judaism represented smaller portions of the global population.
The geographic distribution of these populations is particularly important because religious communities are highly concentrated in particular parts of the world. The source notes that approximately 94% of Hindus lived in India, while around half of the world’s Buddhists lived in China. Christianity was distributed across multiple regions, including Europe, the Americas, and other parts of the world, while Islam had major population concentrations across North Africa, the Middle East, and Asia. This geographic concentration means that global religious change is closely connected to population growth, fertility patterns, migration, urbanisation, and changing age structures in different regions.
Key facts and findings
- Christianity: approximately 2.17 billion people, or 31% of the 2010 global population
- Islam: approximately 1.60 billion people, or 23%
- Religiously unaffiliated: approximately 1.13 billion people, or 16%
- Hinduism: approximately 1.03 billion people, or 15%
- Buddhism: approximately 488 million people, or 7%
- Folk religions: approximately 405 million people, or 6%
- Other religions: approximately 58 million people, or 1%
- Judaism: approximately 13.9 million people, or 0.2%
- Around 94% of Hindus in the source population lived in India
- Approximately half of Buddhists lived in China
The figures represent a 2010 demographic snapshot based on Pew Research Center data, not a current 2026 population estimate
World Population Density: Where People Live Matters
Population density is distributed very unevenly across the world. The highest concentrations are found across South Asia, East Asia, Southeast Asia, parts of Europe, and other regions with large urban and agricultural populations. These areas support very large numbers of people within relatively limited land areas. Coastal regions and major cities also tend to have much higher densities because they provide access to jobs, transport, trade, services, and economic opportunities.
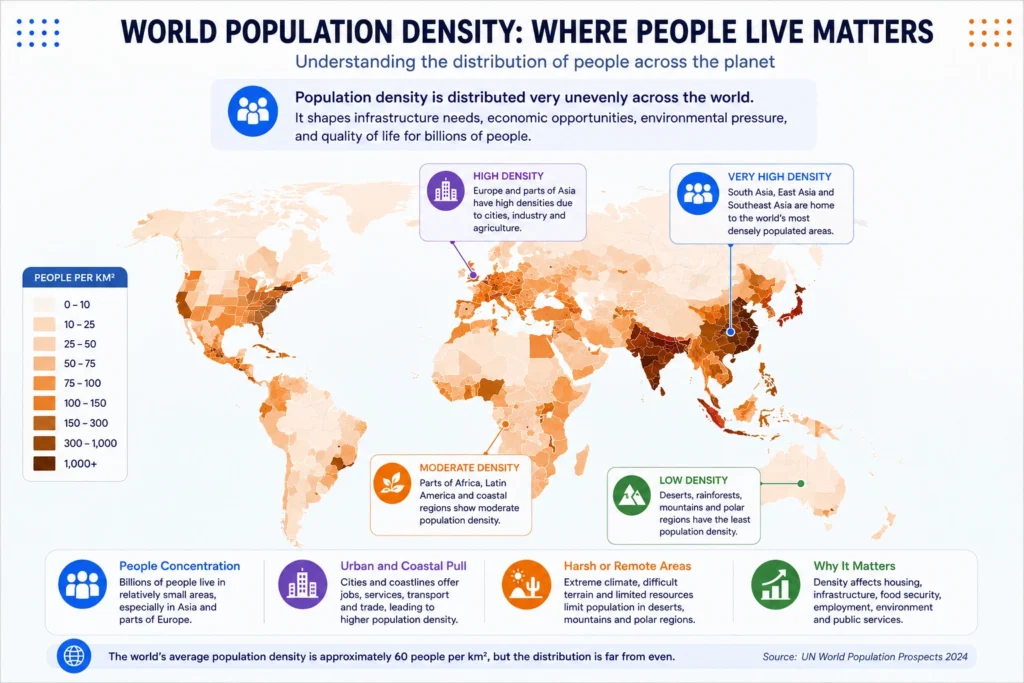
At the other extreme, vast areas such as the Sahara Desert, the Arctic, Australia’s interior, and the Amazon rainforest have relatively low population densities because climate, terrain, water availability, or limited infrastructure restrict large-scale settlement. This uneven distribution is important because population totals alone do not explain where demographic pressure is concentrated. Density influences housing demand, infrastructure, food security, transportation, employment, public services, and environmental pressure, making the geography of population just as important as the size of the global population.
People Are Living Longer Than Ever
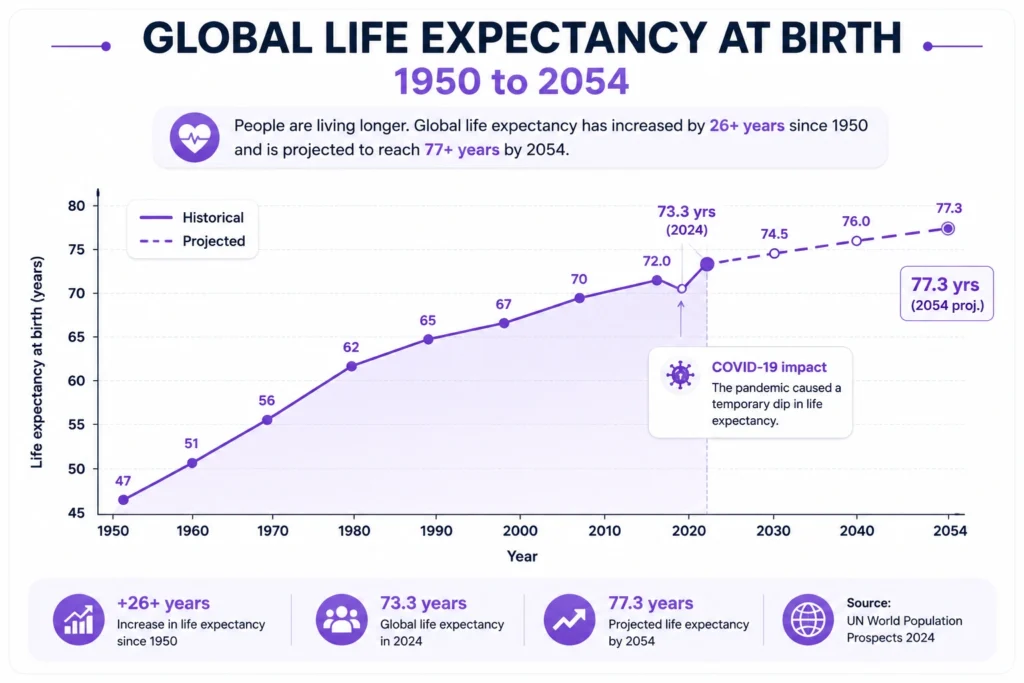
Global life expectancy at birth has increased dramatically over the past several decades. It was approximately 47 years in 1950 and had reached 73.3 years by 2024. This represents an extraordinary improvement in the average length of human life within just a few generations.
The increase reflects decades of progress in medicine, sanitation, nutrition, disease prevention, maternal and child health, living conditions, and access to healthcare. There was a significant disruption around 2020 associated with the COVID-19 pandemic, but global life expectancy subsequently recovered to approximately 73.3 years in 2024.
The longer-term outlook remains positive, with life expectancy projected to move toward approximately 77 years in the coming decades. Longer lives are a major human achievement, but they also require societies to rethink retirement, healthcare, employment, savings, and long-term care. Living longer changes not only how many people exist, but how societies are structured across an entire lifetime.
The Future of World Population: Projections to 2100
| Population Milestone | Year Reached / Projected | Approx. Interval Since Previous Milestone | Status | Key Demographic Significance |
|---|---|---|---|---|
| 1 Billion | ~1804 | — | Historical | Beginning of the modern era of large-scale global population growth |
| 2 Billion | 1930 | ~126 years | Historical | Population growth began accelerating substantially |
| 3 Billion | 1960 | ~30 years | Historical | Rapid post-war population expansion |
| 4 Billion | 1974 | ~14 years | Historical | Continued acceleration driven by high fertility and improving survival |
| 5 Billion | 1987 | ~13 years | Historical | Global population continued expanding rapidly |
| 6 Billion | 1999 | ~12 years | Historical | Population growth remained strong despite declining fertility in many regions |
| 7 Billion | 2011 | ~12 years | Historical | Global population crossed another major demographic threshold |
| 8 Billion | November 2022 | ~11 years | Historical | Population reached 8 billion amid a broad global fertility decline |
| 8.3 Billion | April 2026 | ~3.5 years | Current | Current approximate world population |
| 9 Billion | ~2037 | ~11 years | Projected | Growth continues, but at a slower pace than during the 20th century |
| 10 Billion | ~2058 | ~21 years | Projected | Global population approaches the upper range of the century's central projection |
| Peak: ~10.3 Billion | ~2084 | ~26 years | Projected | Population is expected to reach its projected maximum before gradually declining |
Key facts and findings
- The fastest historical growth occurred between 1950 and 2000, when improvements in healthcare, sanitation, nutrition and survival coincided with relatively high fertility in many developing regions.
- The time required to add another 1 billion people fell dramatically, from about 126 years between 1 and 2 billion to roughly 12–14 years between 4 and 7 billion.
- The world reached 8 billion in 2022 and is estimated at approximately 8.3 billion in 2026.
- The projected journey from 8.3 billion to 9 billion takes about 11 years, while the increase from 9 billion to 10 billion takes roughly 21 years. This widening interval illustrates the expected slowdown in global population growth.
- Under the projection represented here, the global population reaches approximately 10.3 billion around 2084, after which a gradual decline is expected.
- The overall pattern represents a major demographic transition: rapid expansion is gradually giving way to slower growth, population stabilization and eventual decline.
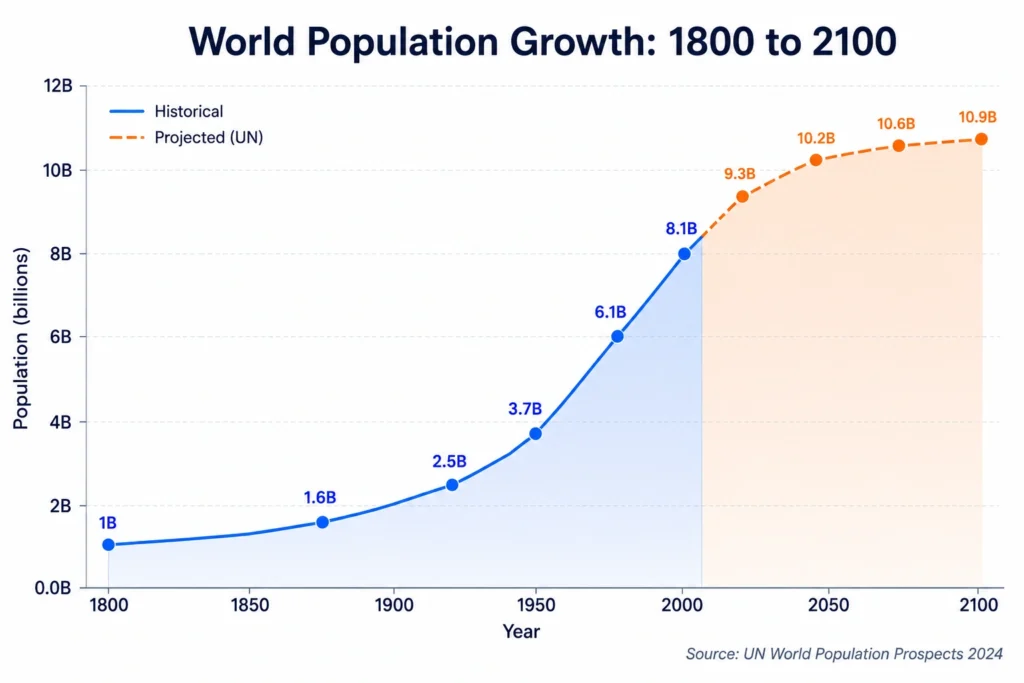
The transformation of the global population over the past two centuries has been extraordinary. Around 1800, humanity numbered approximately 1 billion people. Population growth then accelerated rapidly, with the world reaching 2 billion around 1930, 3 billion in 1960, 4 billion in 1974, 5 billion in 1987, 6 billion in 1999, 7 billion in 2011, and 8 billion in 2022. By 2026, the global population stands at approximately 8.3 billion. The speed at which successive billion-person milestones were reached illustrates how dramatically population growth changed during the 20th and early 21st centuries.
The next stage of population growth is expected to be fundamentally different from the period of rapid expansion that came before it. The United Nations projects that the world population will pass 9 billion around 2037 and reach 10 billion around 2058. Under the UN World Population Prospects 2024 medium-fertility projection, the global population is expected to reach approximately 10.3 billion around 2084, followed by a gradual decline. Although different fertility assumptions can produce different outcomes, the peak-and-decline scenario is increasingly treated as the central demographic pathway rather than a future of unlimited population growth.
Global growth will also become increasingly concentrated in a relatively small number of countries. More than half of the world's expected population growth between now and 2050 is projected to come from just eight countries: DR Congo, Egypt, Ethiopia, India, Nigeria, Pakistan, the Philippines, and Tanzania. Five of these countries are in Africa, highlighting the continent's growing importance to the future global population. While Asia remains home to the largest absolute population, Africa's continued demographic expansion means that the continent will play an increasingly important role in determining the direction of global population growth.
At the same time, several major population centers are moving in the opposite direction. China is projected to experience the largest absolute population loss between 2024 and 2054, declining by approximately 204 million people, followed by Japan and Russia. China's longer-term trajectory is particularly significant, with its population projected to fall to less than half of its current level by 2100. These changes illustrate that global population growth does not mean every country will continue expanding. Some nations will experience population decline, aging workforces, and increasing pressure on systems designed for larger and younger populations.
What the World Population Means for Resources and Sustainability
Every billion people added to the global total sharpens the question of whether the Earth can support them. The aggregate demands on food systems, freshwater availability, energy infrastructure, and housing stock scale with population size, but not linearly. Consumption patterns, technological capacity, and policy choices mediate the relationship between headcount and impact.
Food production has historically outpaced population growth. Between 1960 and 2020, the world's population more than doubled, while caloric availability per person rose significantly in most regions. That achievement reflects the Green Revolution, advances in agricultural science, improved logistics, and trade liberalization. Whether similar productivity gains can be sustained through the next two billion people depends on continued investment in agricultural research and effective governance of shared resources.
The 2026 world population density is 56 people per square kilometer of land area, a figure that varies enormously by geography. Bangladesh and the Netherlands are among the most densely populated nations on Earth, while Canada, Australia, and Mongolia are among the most sparsely settled. The mismatch between where people live and where natural resources exist drives migration, geopolitical tension, and long-term planning challenges for both governments and international institutions.
Climate adaptation intersects with population dynamics in direct and complex ways. Regions facing the fastest population growth, including the Sahel, the Horn of Africa, and parts of South and Southeast Asia, are frequently among those most exposed to climate-related disruption, including drought, flooding, and rising temperatures. The demographic pressure amplifies the urgency of adaptation investment.
A Closing Perspective on 8.3 Billion and Beyond
The current world population of approximately 8.28 billion represents both a peak of human achievement and a pressure test for the systems that sustain modern life. That growth is decelerating is not automatically reassuring. Slower population growth concentrated in aging high-income nations creates different but equally demanding challenges than rapid growth in younger, lower-income regions. Pension systems, healthcare delivery, labor force composition, and social cohesion all shift in response to demographic structure, not just demographic size.
The real significance of tracking live world population figures lies in what they reveal about direction. The 21st century, unlike the 20th, will not be defined by exponential population expansion. It will be defined by managing demographic divergence, the simultaneous reality of countries that have too few people entering the workforce and countries with enormous youth populations that cannot yet absorb them productively. That divergence will shape migration policy, trade relationships, educational investment, and the character of global governance in ways that are already visible and will intensify through mid-century. Understanding the world population today is not merely an exercise in arithmetic. It is a way of reading the structural pressures that will determine how the next generation of institutions, economies, and societies either adapt or struggle.
How the World Population Counter Works
Population data is not collected in real time by governments or international bodies, a fact that surprises many casual observers. The world population clock, displayed on platforms like Worldometer and the U.S. Census Bureau's official portal, is a calculated projection, not a direct tally. The world population counter is based on the latest estimates released in July 2024 by the United Nations, elaborated using national census data, birth and death registration records, and survey results from countries worldwide.
The methodology behind these projections involves layering national-level demographic data, adjusting for known reporting gaps, and applying fertility and mortality assumptions calibrated to recent trends. Most recent data for a single country is often two years old on average, making the current world population figure necessarily a projection of past data based on assumed trends. As new data become available, assumptions are reevaluated, and past figures may be revised.
This means the live world population counter is best understood as a sophisticated estimate rather than a literal real-time measurement. Two major sources govern the global figure: the United Nations Population Division and the U.S. Census Bureau's International Programs Center. Their methodologies differ slightly, which occasionally produces headline-level disagreements. The U.S. Census Bureau estimated the world reached 8 billion on September 26, 2023, while the UN placed that milestone on November 15, 2022. These discrepancies reflect genuine uncertainty in demographic science, not error.
Growth & History
1. What is the total world population right now?
The world population stands at approximately 8.28 billion as of 2026, based on UN and World Bank projections. This figure rises by roughly 2.2 people every second.
2. When did the world population reach 8 billion?
The United Nations declared the global population reached 8 billion on November 15, 2022. The U.S. Census Bureau placed the same milestone on September 26, 2023, reflecting methodological differences.
3. How long did it take to go from 7 billion to 8 billion?
It took approximately 11 to 12 years. The 7 billion mark was crossed in 2011, and 8 billion arrived in 2022, a slower interval than the 12 years it took to go from 6 to 7 billion.
4. When did the world population first reach 1 billion?
The global population crossed 1 billion around 1804, after hundreds of thousands of years of human existence. The acceleration to subsequent billions took less time dramatically.
5. How fast does the world population grow per day?
Approximately 292,000 people are added to the world population every day in 2026, the net result of roughly 470,000 daily births minus around 179,000 daily deaths.
6. What was the world population 100 years ago?
In 1926, the world population was approximately 2 billion people. It has since grown more than four times over, primarily due to advances in medicine, sanitation, and food production.
7. Has world population growth always been this fast?
No. For most of human history, population growth was extremely slow. The sharp acceleration began with industrialization in the 1800s and peaked in the 1960s at over 2% annual growth.
8. What caused the population explosion in the 20th century?
Dramatic declines in infant mortality, breakthroughs in vaccines and antibiotics, improved nutrition, and agricultural modernization all combined to sharply reduce death rates while birth rates remained high.
9. Is world population growth slowing down?
Yes. The annual growth rate has fallen from a peak of about 2.3% in the 1960s to roughly 0.83% in 2026, driven primarily by declining fertility rates across most regions of the world.
10. How many people have ever lived on Earth?
Estimates suggest approximately 106 billion people have been born since the emergence of modern Homo sapiens, meaning people alive today represent about 6% of all humans who have ever lived.
11. What is natural population increase?
Natural increase is the difference between births and deaths in a given period, excluding migration. A country has a natural increase when births exceed deaths and a natural decrease when the opposite occurs.
12. What is zero population growth?
Zero population growth occurs when births and deaths are balanced, resulting in no net increase or decrease. Some demographers and environmentalists consider it a desirable long-term target for global sustainability.
13. What was the world population at the start of the 20th century?
At the beginning of 1900, the global population was approximately 1.6 billion people. By 2000, it had grown to 6.1 billion, a nearly fourfold increase in a single century driven by industrialization and medical advances.
14. What is the doubling time of the world population?
At the current growth rate of approximately 0.83%, the world population would take about 84 years to double. This compares to a doubling time of just 35 to 40 years during the high-growth period of the 1960s.
15. How is the world population measured and estimated?
Population estimates combine national census data, birth and death records, survey results, and demographic modeling. The UN updates its World Population Prospects every two years, applying adjustments for known reporting gaps in each country.
Countries and Regions
16. Which country has the largest population in the world?
India is the most populous country in 2026, with over 1.64 billion people. It surpassed China in 2023, marking a major shift in global demographic rankings.
17. What is the population of China in 2026?
China's population is estimated at approximately 1.42 billion in 2026. Unlike India, China's population has begun a structural decline driven by decades of low fertility.
18. Which continent has the most people?
Asia is the most populous continent, home to approximately 4.7 billion people, representing nearly 57% of the global population. China and India alone account for more than a third of all humans.
19. Which continent has the fastest population growth?
Africa has the fastest-growing population. Sub-Saharan Africa, in particular, is projected to double its population by 2050, driven by high birth rates and a young demographic structure.
20. What is the population of the United States in 2026?
The United States has a population of approximately 340 to 345 million in 2026, making it the third most populous country in the world after India and China.
21. Which country is losing population the fastest?
China is projected to experience the largest absolute population loss of any nation, potentially losing over 200 million people between 2024 and 2054 due to sustained low fertility.
22. What percentage of the world lives in Asia?
Approximately 59% of the global population lives in the Asia-Pacific region. That translates to nearly 4.9 billion people, making it by far the most densely inhabited part of the planet.
23. What is Europe's share of the world population?
Europe holds approximately 9% of the world's population, around 744 million people. Most European nations have fertility rates well below the 2.1 replacement level.
24. What is Africa's population in 2026?
Africa's population is approximately 1.56 billion in 2026. The continent accounts for nearly 19% of the global total and is expected to drive the majority of the world population growth this century.
25. Which country has the smallest population in the world?
Vatican City holds the distinction of the world's smallest population, with approximately 500 residents. It is also the smallest sovereign state by total land area.
26. What is population distribution vs. population size?
Population size refers to the total headcount, while distribution describes how that population is spread across geography. Uneven distribution creates very different resource and governance challenges than size alone suggests.
27. Which countries are most densely populated?
Monaco, Singapore, Bahrain, Bangladesh, and the Maldives rank among the most densely populated nations. Among large countries, Bangladesh and South Korea stand out for their extremely high population per square kilometer.
28. What is the population of Nigeria, and why does it matter globally?
Nigeria's population is approximately 230 to 240 million in 2026 and is growing rapidly. It is projected to become the third most populous country in the world by mid-century, overtaking the United States.
29. What is the population of the world's smallest countries?
The smallest countries by population include Vatican City, Nauru, Palau, and San Marino. Together, the ten least populous nations hold fewer people than a single mid-sized city.
30. How does Latin America compare to other regions in population growth?
Latin America and the Caribbean have approximately 660 million people with moderate growth rates. Fertility has declined significantly across most of the region, and several countries, including Brazil and Cuba, face aging population challenges.
Fertility and Birth
31. What is the global fertility rate in 2026?
The global total fertility rate is approximately 2.3 children per woman as of 2024, down from roughly 5 in the 1950s. Fertility at 2.1 is the replacement level needed to maintain a stable population.
32. Which countries have the highest fertility rates?
Countries in sub-Saharan Africa, including Niger, Chad, Somalia, and the Democratic Republic of Congo, consistently report the world's highest fertility rates, often exceeding 5 to 6 children per woman.
33. Which countries have the lowest fertility rates?
South Korea holds one of the world's lowest fertility rates at approximately 0.72, followed closely by several other East Asian nations, including Japan and Taiwan, and several Southern European countries.
34. How many babies are born every year globally?
Approximately 132 to 140 million babies are born worldwide each year. This figure is projected to peak around 2040 to 2045 before gradually declining through the end of the century.
35. How many births happen every second in the world?
Roughly 4.5 babies are born every second globally in 2026. Over the course of a full year, that translates to approximately 470,000 births per day.
36. What is replacement-level fertility?
Replacement-level fertility refers to a total fertility rate of 2.1 children per woman, the threshold at which a population exactly replaces itself over generations without relying on immigration.
37. Why are birth rates falling around the world?
Rising education levels, increased female workforce participation, urbanization, greater access to contraception, and the financial cost of raising children in modern economies all contribute to declining birth rates.
38. Does education affect birth rates?
Yes, significantly. Research consistently shows that higher female educational attainment correlates with lower fertility. Women with more years of schooling tend to have fewer children and delay childbearing.
39. What is the birth rate in developing countries vs. developed countries?
Developing nations, particularly in sub-Saharan Africa and parts of South Asia, still have birth rates well above the replacement level. Most developed nations have fallen below 2.1 children per woman.
40. Is teenage pregnancy a factor in world population growth?
Early childbearing contributes meaningfully to population growth in high-fertility regions. The UN notes that eliminating births to girls under 18 in sub-Saharan Africa would reduce the projected 2054 population by nearly 4%.
Aging and Death
41. How many people die every day in the world?
Approximately 179,600 people died each day globally in 2026. Deaths are currently outpaced by births at a ratio of roughly 2.6 to 1, producing the net daily population increase.
42. What is the average global life expectancy in 2026?
Global life expectancy at birth reached 73.3 years in 2024, up from about 65 years in 1990. The UN projects it will rise further to around 77.4 years by 2054.
43. Which country has the highest life expectancy?
Japan consistently ranks among the top countries for life expectancy, with averages exceeding 84 years. Monaco, Hong Kong, and several Northern European nations are also consistently at the top.
44. What is the global median age in 2026?
The global median age is 31.1 years in 2026. This figure has been climbing steadily from 22.2 years in 1950 and is projected to reach 42.1 years by the end of the century.
45. What is population aging, and why does it matter?
Population aging refers to an increasing share of older individuals within a society. It strains pension systems, healthcare infrastructure, and labor markets, and is already a structural challenge across Europe and East Asia.
46. When will elderly people outnumber children globally?
The UN projects that by 2080, the number of people aged 65 and older will exceed the number of children under 18 for the first time in recorded human history.
47. What is the death rate per 1,000 people globally?
The global crude death rate is approximately 7.7 per 1,000 people per year. As populations age, this rate is expected to rise gradually even as individual life expectancy continues to increase.
48. How did COVID-19 affect world population growth?
COVID-19 caused a temporary dip in global life expectancy and a measurable spike in mortality in 2020 and 2021. Since 2022, life expectancy has largely recovered to pre-pandemic levels.
49. Which age group makes up the largest share of the world population?
People between the ages of 15 and 64, the conventional working-age bracket, comprise the largest share of the global population. However, the share of those 65 and older is growing in every region.
50. What is the dependency ratio, and how is it changing?
The dependency ratio measures non-working-age populations relative to working-age populations. It is rising in aging high-income countries as fewer workers support more retirees, creating fiscal pressure on social systems.
51. What is the youth bulge, and which regions have it?
A youth bulge occurs when a large proportion of the population is young. Sub-Saharan Africa and parts of South Asia currently have significant youth bulges, which can fuel economic growth if job opportunities exist or instability if they do not.
52. How will an aging world population affect healthcare systems?
An older global population will dramatically increase demand for chronic disease management, long-term care, and elder-specific medical services. Countries without adequate healthcare infrastructure or financing will face severe strain.
53. What is a population pyramid?
A population pyramid is a graphical representation of a population's age and sex structure. Expansive pyramids with wide bases indicate young, fast-growing populations, while constrictive ones indicate aging or declining societies.
54. What does an aging population mean for pension systems?
When fewer workers support more retirees, pension systems face financial pressure. Many high-income nations are raising retirement ages, adjusting benefit formulas, or increasing immigration to sustain adequate workforce-to-retiree ratios.
55. How does infant mortality affect overall population size?
Lower infant mortality allows more children to survive to reproductive age, initially accelerating population growth. As families recognize higher child survival rates, they typically choose to have fewer children, eventually slowing growth.
Migration and Urbanization
56. How many people migrate each year internationally?
Roughly 281 million people, about 3.6% of the world population, live outside their country of birth. Annual international migration flows total in the tens of millions, driven by economic, environmental, and conflict factors.
57. What percentage of the world population lives in cities?
Approximately 58.5% of the global population, around 4.85 billion people, lived in urban areas in 2026. This share continues to rise as rural-to-urban migration accelerates, especially in Africa and Asia.
58. Will more than half the world always live in cities?
Urban populations are projected to keep expanding. The UN anticipates that by 2050, nearly 70% of the world will live in urban areas, with the majority of that growth occurring in African and Asian cities.
59. What drives rural-to-urban migration?
Economic opportunity, access to education and healthcare, reduced agricultural employment, and the cultural pull of cities are the primary factors driving people from rural areas into urban centers worldwide.
60. How does migration affect population growth in developed countries?
In many developed nations, immigration is the primary or even sole driver of population growth. Countries like Canada, Australia, and Germany depend on immigrant arrivals to offset births falling below the replacement level.
61. Which countries receive the most international migrants?
The United States hosts the world's largest stock of international migrants. Germany, Saudi Arabia, Russia, and the United Kingdom also rank among the top destination countries by total migrant population.
62. What is internal migration?
Internal migration refers to people moving within their own country, typically from rural areas to cities or from economically depressed regions to more prosperous ones. It is far larger in scale than international migration.
63. How does climate change affect population movement?
Climate-related disruptions, including droughts, floods, and extreme heat, are increasingly displacing populations. The World Bank estimates over 200 million people could be internal climate migrants by 2050.
64. What is a refugee, and how many exist worldwide?
A refugee is a person who has fled their country due to persecution, conflict, or violence. The UN Refugee Agency reported over 100 million forcibly displaced people globally in 2023, a record figure.
65. What is population density, and where is it highest?
Population density measures people per unit of land area. Bangladesh and Monaco are among the most densely populated nations, while countries like Canada, Australia, and Mongolia have vast territories with sparse populations.
66. What is the net migration rate, and how does it affect the population?
Net migration rate is the difference between immigrants entering and emigrants leaving a country per 1,000 people. Countries with high positive net migration rates, like the UAE, can grow rapidly even with low birth rates.
67. How does urbanization affect the environment?
Urban expansion converts farmland and natural habitats, increases per-capita energy use, raises waste generation, and concentrates pollution. However, cities also tend to produce lower per-capita carbon footprints than dispersed rural living.
68. What are megacities, and how many are there?
Megacities are urban agglomerations with populations exceeding 10 million. As of 2026, there are approximately 37 megacities worldwide, led by Tokyo, Delhi, Shanghai, and São Paulo.
69. How will climate migration reshape global population distribution?
Climate-driven displacement could shift large populations from low-lying coastal areas, drought-prone interiors, and extreme-heat zones toward higher-latitude regions. Demographers consider this one of the defining population movements of the 21st century.
70. What is brain drain, and how does it affect developing countries?
Brain drain refers to the emigration of highly educated or skilled workers from developing to developed nations. It can deprive origin countries of talent critical for economic growth while benefiting destination countries.
Future Projections
71. When will the world population reach 9 billion?
The UN projects the global population will cross 9 billion around 2037, approximately 15 years after the 8 billion milestone. The longer interval reflects the ongoing deceleration in global population growth.
72. When will the world population reach 10 billion?
Based on the UN's 2024 medium-fertility scenario, the world population is projected to reach 10 billion around 2058 and peak at approximately 10.3 billion around 2084.
73. Will the world population ever start declining?
Most demographic projections indicate a peak around 2084 at roughly 10.3 billion, followed by a slow decline. Alternative models suggest decline could begin sooner if fertility continues falling faster than expected.
74. What will the world population be in 2050?
The UN's 2024 World Population Prospects projects approximately 9.7 billion people by 2050, with an 80% confidence interval ranging from around 9.4 to 10.1 billion depending on fertility outcomes.
75. What will the world population be in 2100?
The UN projects the world population to be approximately 10.2 to 10.9 billion by 2100. Some alternative models project a decline back below 8 billion if fertility rates fall faster than the central scenario assumes.
76. Which regions will grow the most by 2050?
Sub-Saharan Africa is projected to experience the most dramatic growth, potentially doubling or tripling its current population. South Asia and parts of the Middle East will also see significant increases.
77. Will Europe's population decline in the future?
Yes. Most European countries are already below replacement-level fertility, and many face long-term population decline without sustained immigration. Eastern Europe in particular is experiencing significant demographic contraction.
78. What demographic scenario could keep the world population below 9 billion?
A lower-fertility scenario, driven by accelerated education for women, expanded access to family planning, and faster urbanization, could see the global population peak well below 9 billion before mid-century.
79. How accurate are long-range population projections?
Projections carry significant uncertainty, especially beyond 50 years. Small changes in fertility assumptions produce dramatically different outcomes. The UN acknowledges these models are scenarios, not predictions.
80. What is population momentum, and why does it matter?
Population momentum means a population keeps growing even after fertility falls below replacement level, because large youth cohorts move into reproductive age. It explains why the global population will still grow for decades even as fertility declines.
81. What is the projected population of India in 2050?
India's population is projected to reach approximately 1.67 to 1.70 billion by 2050 before beginning to plateau. India is expected to remain the world's most populous country throughout the rest of the century.
82. How will technology change the relationship between population and resources?
Advances in precision agriculture, renewable energy, desalination, vertical farming, and synthetic proteins could allow a world of 10 billion to consume resources more efficiently than today's 8 billion do under current practices.
Society and Resources
83. Will there be enough food for 10 billion people?
Agricultural scientists broadly conclude that Earth can produce enough food for 10 billion people, but doing so requires reducing waste, improving distribution systems, and transforming diets in high-consumption nations.
84. How does population growth affect climate change?
More people mean higher aggregate demand for energy, food, water, and manufactured goods. However, per-capita consumption in high-income nations generates far more emissions than population growth in low-income regions.
85. What is the relationship between poverty and population growth?
High fertility rates are strongly correlated with poverty. As incomes rise, child mortality falls, and access to education and family planning improves, birth rates typically decline, a pattern known as the demographic transition.
86. How does population size affect water scarcity?
Population growth increases aggregate freshwater demand for drinking, agriculture, and industry. The UN estimates that by 2030, global water demand could exceed sustainable supply by up to 40% under current consumption patterns.
87. What is the demographic transition model?
The demographic transition model describes the shift from high birth and death rates in pre-industrial societies to low ones in modern societies. Most high-income countries have completed this transition; many low-income nations are still moving through it.
88. How does gender equality affect population growth?
Empowering women through education, economic participation, and reproductive rights consistently reduces fertility rates. The UN identifies gender equality as one of the most effective long-term levers for managing population trajectories.
89. Does population growth cause deforestation?
Population growth, particularly in tropical regions, drives demand for agricultural land, fuel, and housing, contributing to deforestation. However, governance, land rights, and market forces often play a larger role than population size alone.
90. What is overpopulation, and is the world overpopulated?
Overpopulation refers to a population exceeding the carrying capacity of its environment. Whether the world is overpopulated depends on resource distribution, consumption patterns, and technology, making it a contested question among demographers.
91. How does population affect housing demand globally?
Growing populations, particularly in urban areas of Africa and South Asia, drive enormous demand for new housing. The UN estimates roughly 96,000 homes need to be built every day to meet global demand through 2030.
92. What is the gender ratio of the world population?
Men slightly outnumber women globally, with approximately 50.3% male and 49.7% female. However, women outnumber men among older age groups, particularly above age 48, due to differences in life expectancy.
93. What share of the world population lives in poverty?
The World Bank defines extreme poverty as living on less than $2.15 per day. Approximately 700 million people, or roughly 9% of the world population, live below this threshold as of the most recent data.
94. How does literacy relate to population growth?
Higher literacy rates, especially female literacy, consistently correlate with lower fertility and slower population growth. Education delays marriage, improves access to family planning, and raises awareness of child development costs.
95. What is the average household size globally?
Global average household size has been declining and is now approximately 3.5 people per household. This reflects urbanization, lower fertility, rising rates of single-person living, and longer life expectancy.
96. How does religion influence birth rates and population growth?
Religious traditions vary widely in their guidance on family size and contraception. Countries with high proportions of religiously conservative populations often, though not universally, show higher fertility rates than more secular societies.
97. What is the relationship between GDP and population growth?
Higher-income nations consistently have lower birth rates. As GDP per capita rises, individuals tend to invest more in fewer children rather than having large families, one of the most robust patterns in demography.
98. What is the link between population growth and inequality?
Rapid population growth can strain public services, intensify competition for jobs and land, and widen economic gaps if growth outpaces institutional capacity. Well-managed demographic transitions have historically enabled periods of shared prosperity.
99. How does population size affect political representation globally?
Population differences create significant disparities in geopolitical influence. Large-population countries carry disproportionate weight in multilateral institutions, trade negotiations, and global governance, often marginalizing smaller nations.
100. Is the world population problem really about numbers or about consumption?
Most demographers and environmental scientists argue that resource strain comes more from patterns of consumption, particularly in wealthy nations, than from population size alone. A small, high-consuming population can generate more environmental pressure than a large, low-consuming one.
The population figures displayed on this website are estimates, not exact counts. No organization can measure the global population in real time. The numbers shown here are generated using statistical models based on historical census data, demographic surveys, birth and death rates, and migration trends.
Because population change is continuous and complex, all values involve uncertainty.
Small differences may occur between sources, and the figures should not be interpreted as precise or definitive totals. Digits are rounded to reflect realistic accuracy and to avoid a false sense of precision.
The population clock is anchored to a baseline dataset derived from publicly available sources such as Census.gov, the United Nations, and other recognized demographic research institutions. The baseline date and source, along with the most recent update or rebase, are clearly displayed to maintain transparency.
This website is intended for educational and informational purposes only. The data should not be used for legal, medical, financial, or policy decisions. For official statistics, always consult national statistical offices or international organizations.
The World Population clock is an online tool that shows an estimate of the number of people alive at a given moment and often displays related real-time indicators such as births per second, deaths per second, and net migration flows.
Population clocks do not count people in real time. Instead, they combine the latest estimates and short-term rates to produce an updated projection intended to communicate scale and trends quickly.
Why a World Population Clock Matters
- Communicates global scale and momentum of population change in a single glance.
- Helps journalists, educators, policy makers, and the public visualize births, deaths, and migration as continuous processes.
- Serves as an entry point to deeper demographic data and projections from authoritative sources such as the United Nations and national statistical agencies.
Core components of a population clock
Population clocks typically rely on three demographic components to update counts in near real time:
- Births
- Deaths
- Net international migration
Each component is represented by a rate derived from recent estimates or short-term projections. These rates are applied to a snapshot population and then aggregated into a continuously updating total.
Common sources behind World Population clocks
- United Nations Population Division, World Population Prospects for baseline estimates and long-term projections.
- U S Census Bureau International Database and population clock notes for world and country-level short-term projections.
- World Bank population datasets for cross-country comparisons and historical series.
- Aggregators and real-time statistic sites that combine publicly available data and apply algorithms to produce live counters.
- Academic and open data projects, such as Our World in Data, compile and harmonize multiple sources for visualization and research.
Typical methodology followed for the World Population Clock
- Establishing a baseline population estimate for a reference date using an authoritative source such as the UN or a national statistical office.
- Estimate short-term rates for births, deaths, and net migration using the most recent year's data or rolling averages from vital statistics and migration surveys.
- Convert rates into per-second increments to allow smooth updating of the displayed counter.
- Apply the per-second increments cumulatively from the baseline to the current clock time to produce the live estimate.
- Periodically rebase the clock when new official estimates or revised methodologies are released. Rebaselining corrects drift between modelled projections and subsequent empirical estimates.
How accuracy is measured and reported
- Accuracy depends on the quality of the baseline estimate and the precision of the rates used for births, deaths, and migration. High-quality vital registration systems increase accuracy.
- For many high-income countries with strong registration systems, short-term population estimates are very close to the true count. For low-income countries with sparse data, uncertainty is larger.
- Global population totals are robust to small local errors because many country-level errors offset each other, but regional and country estimates can still be off by several percent. Research suggests recent global estimates are likely accurate within a few percent for the contemporary period.
Main sources of error and uncertainty
- Outdated or incomplete civil registration and vital statistics in some countries.
- Difficulty measuring international migration flows, especially irregular migration and rapid policy-driven shifts.
- Time lags between data collection, processing, and publication force clocks to rely on projections rather than counts.
- Differences in methodology between major data providers lead to small discrepancies in totals and dates for milestones such as the eight billion mark.
Examples of different population clock implementations
- The United Nations provides official estimates and projections with detailed methodological documentation. These form the basis for many authoritative clocks.
- The U S Census Bureau operates a World Population Clock that uses the International Database and specific short-term projection techniques described in notes and data gems.
- Several major sites produce live counters that combine published rates and algorithms to show rapid updates to a wide set of indicators. These sites are useful for quick visualization but are not authoritative by themselves.
How to interpret numbers on the World Population clock
- Treat the clock as an estimate and an educational visualization rather than a literal live census.
- Use the clock to understand approximate scale, direction, and relative speed of population change rather than exact integers.
Common questions answered
- Question 1: How often does the clock get updated
- Answer: The visible display updates continuously using per-second increments, but the underlying baseline and rates are updated only when new official estimates or revisions are published.
- Question 2: Which source is most authoritative
- Answer: The United Nations World Population Prospects is the global reference for official estimates and projections. National statistics offices are authoritative for country-specific counts.
- Question 3: Can population clocks predict future demographic shocks
- Answer: Clocks rely on short-term rates and cannot foresee sudden events such as pandemics, wars, or rapid migration policy changes. Those events require revised projections once measured data become available.
Use cases for a World Population clock
- Educational widget for schools and classrooms illustrating demographic concepts.
- Homepage engagement tool to attract visitors and encourage exploration of demographic content.
- Research gateway linking to datasets, country profiles, and projection scenarios.
United Nations World Population Prospects: United Nations, Department of Economic and Social Affairs, Population Division (World Population Prospects 2024).
World Bank Open Data for Population: Total population and demographic indicators from the World Bank’s global database.
Population Reference Bureau (PRB) (World Population Data Sheet): Annual data sheets with population and demographic indicators for 200+ countries.
UNdata: United Nations Statistical Database
U.S. Census Bureau International Database (IDB): Global population estimates and projections maintained by the U.S. Census Bureau.
Our World in Data (Population Statistics): Long-run population estimates combining multiple authoritative sources with visualization tools.
Gapminder Population Data: Historical and projected population figures curated with metadata and documentation.
Eurostat Demographic Statistics: Official EU demographic data, including population size and structure for member states.
World Health Organization (Global Health Observatory (Population Indicators)): Population figures linked with health data (age structure, life expectancy, etc.).
Key Insights & Trends
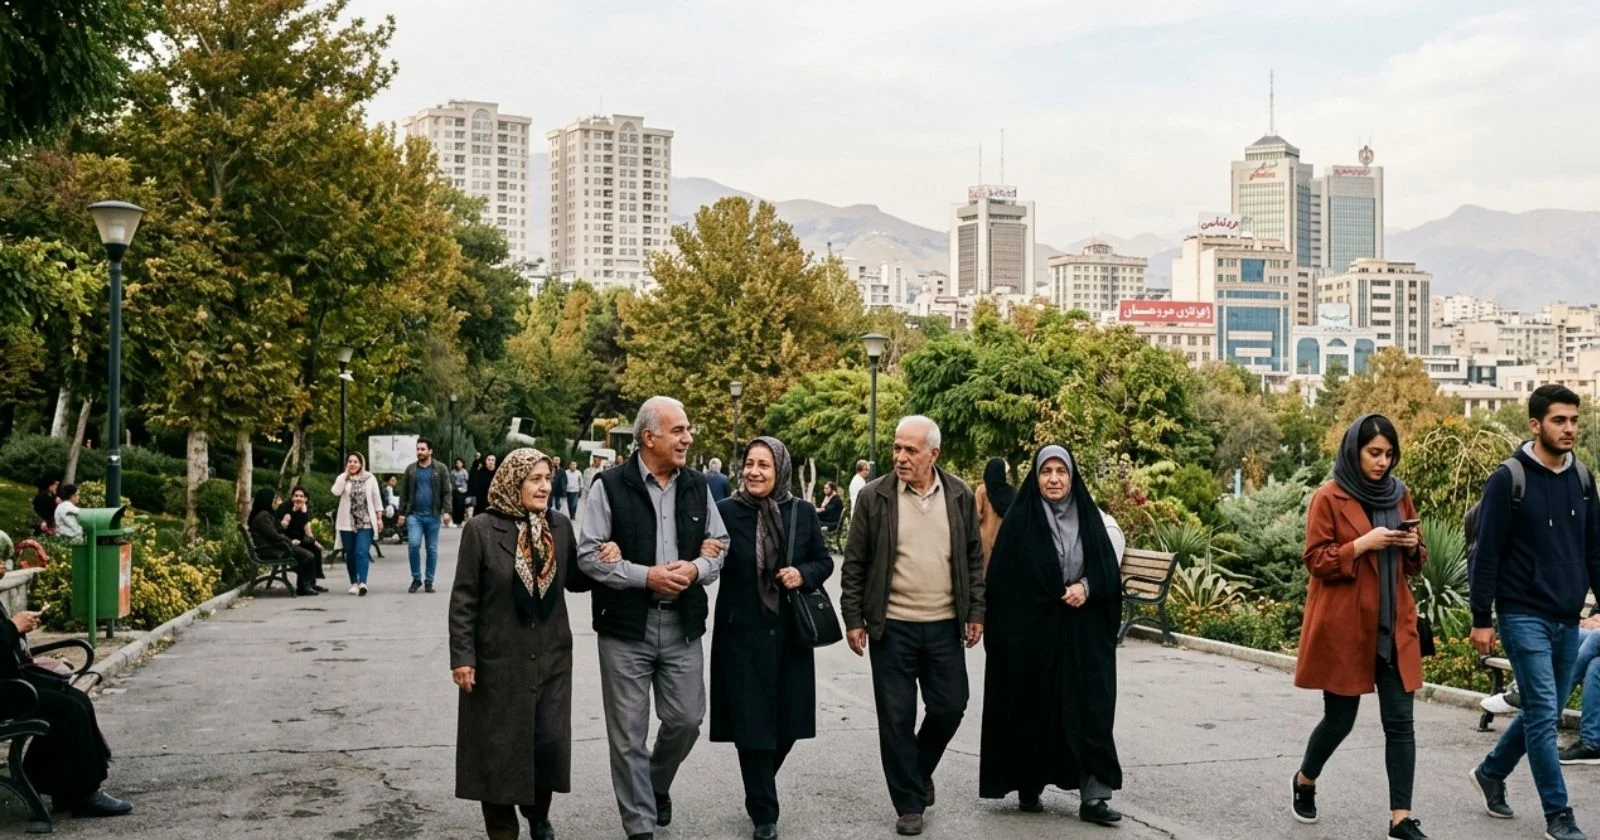
Iran’s Aging Population and What It Means for the Future of Regional Power
Iran's fertility rate collapsed from 6.6 to 1.7 in four decades. Its population is still growing, bu…
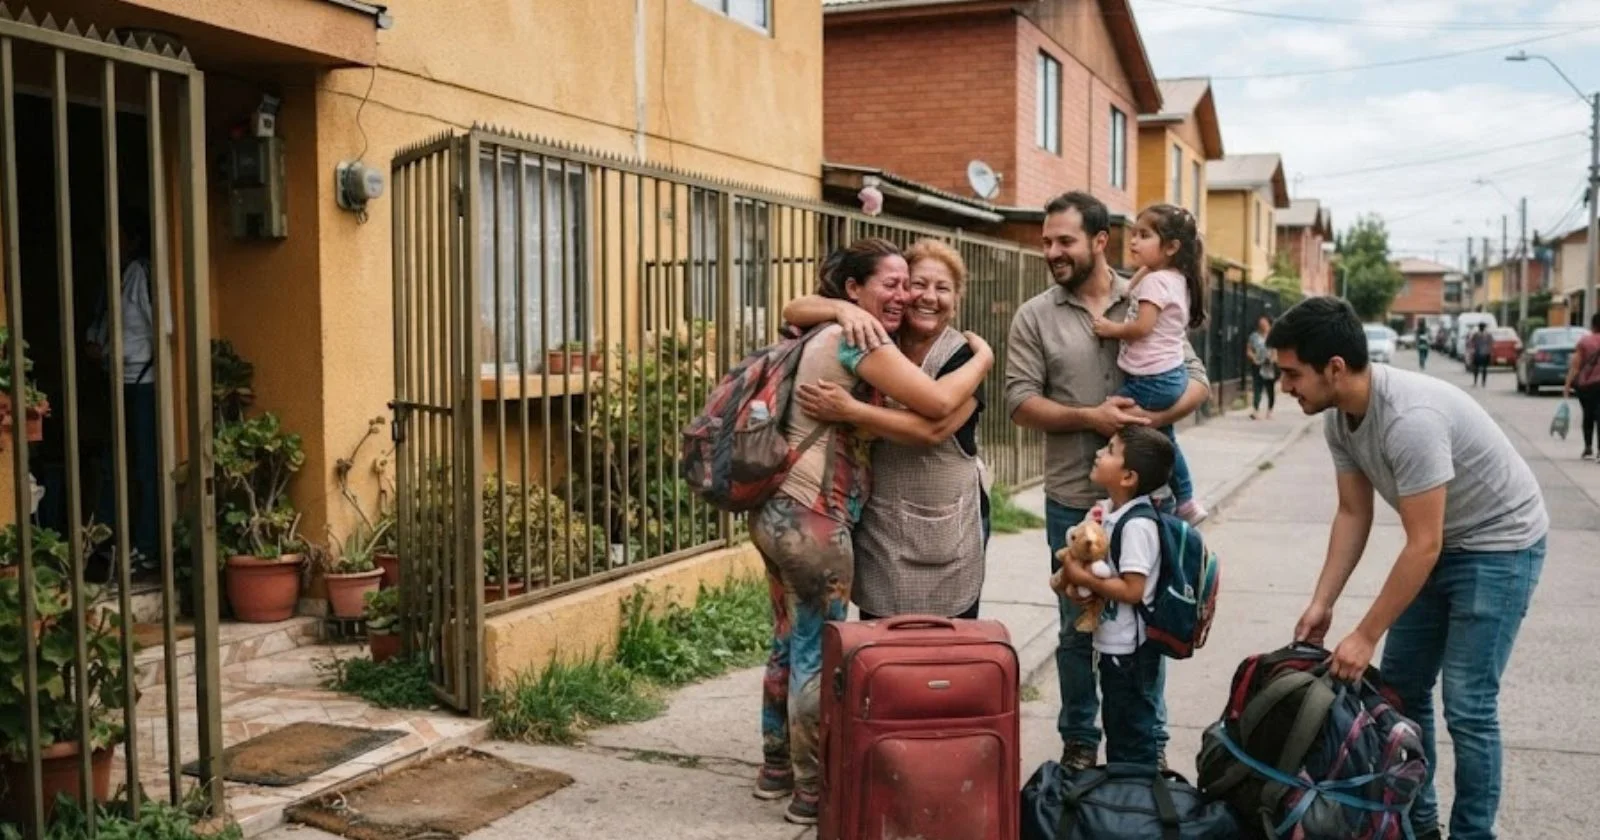
Venezuela’s Population After Mass Migration: How Emigration Changed the Country’s Demographics
Almost a quarter of Venezuelans now live outside the country. Here is the migration data reshaping V…
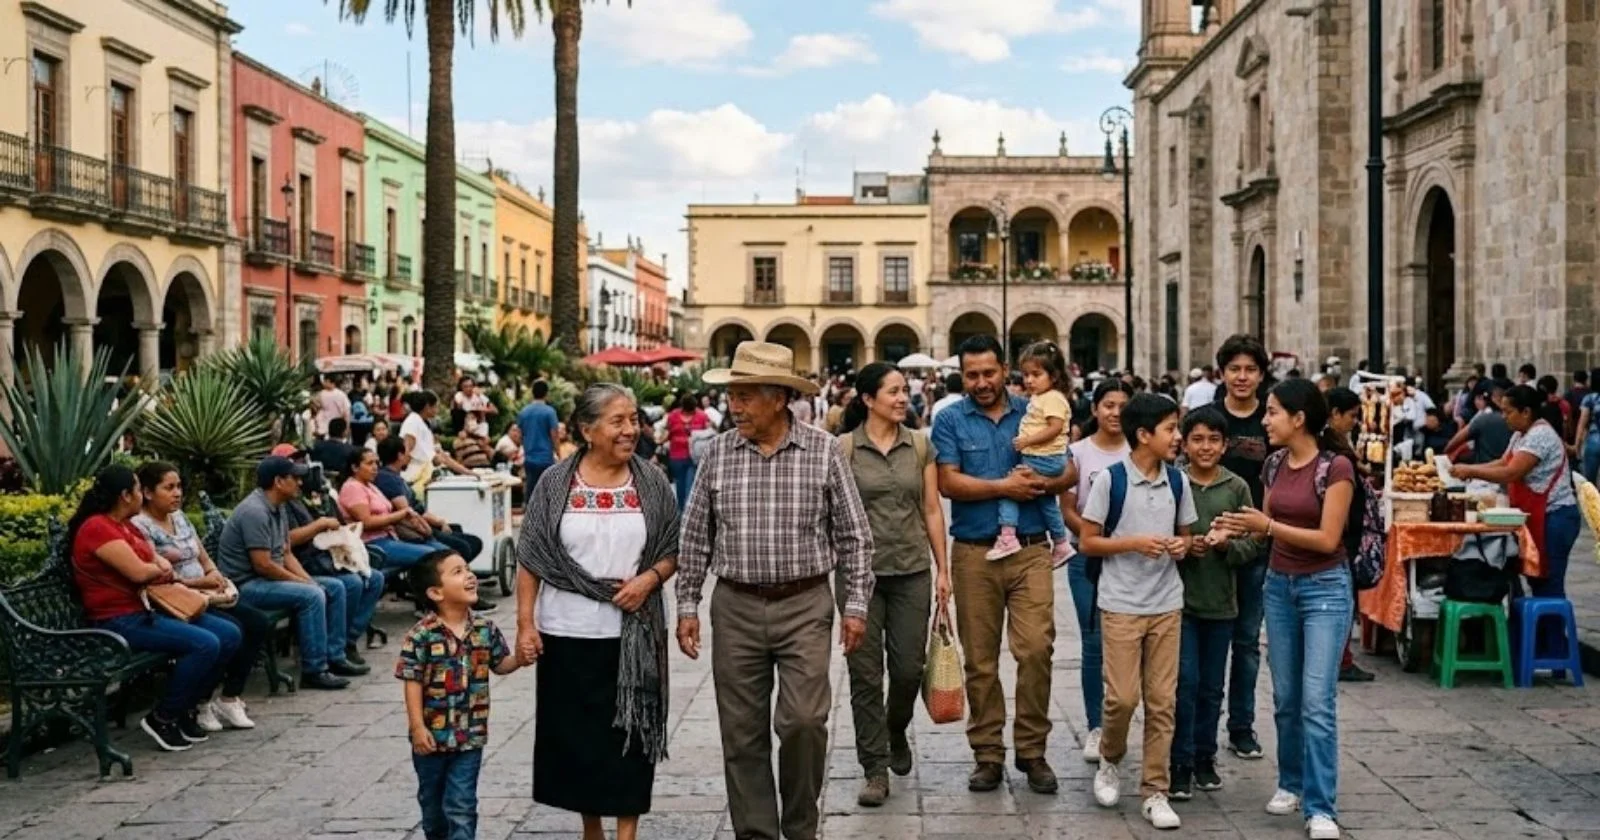
Mexico’s Young to Old Population Transition
Mexico's fertility rate fell below the United States' in 2020, a historic reversal decades in the ma…
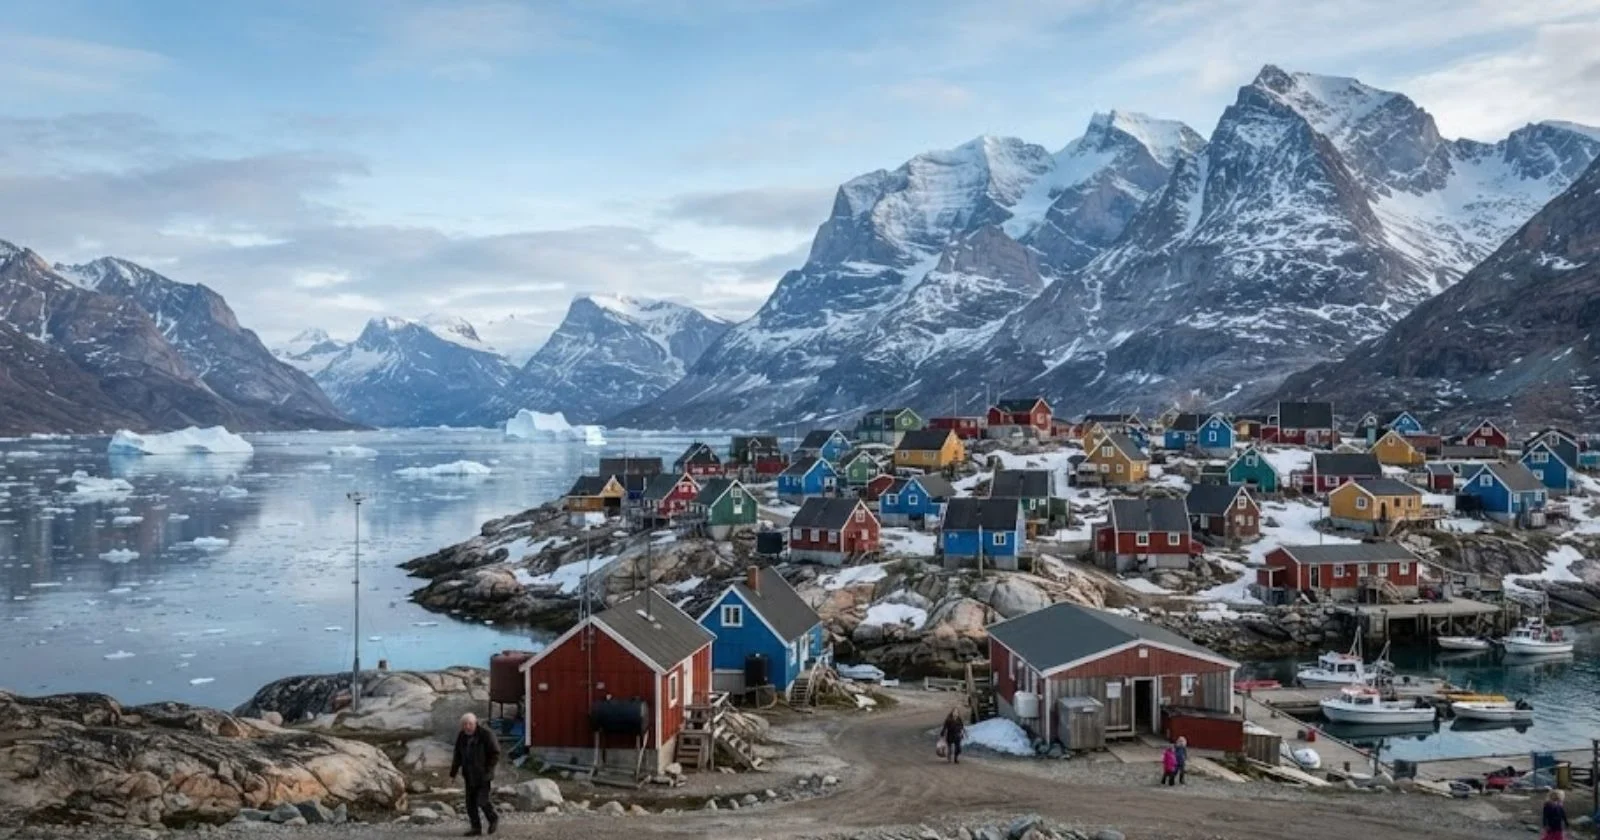
Greenland Population: Why So Few People Live Across Such a Vast Territory
Nuuk has added 11,221 residents since 1980 while the rest of the country lost 4,254, concentrating 3…

Trinidad and Tobago Demographics: Population, Age Structure and Demographic Change
The CSO's 2025 age groups sit exactly 2.99% above the 2011 census, so they show no aging, while UN-b…
Jamaica Demographics: Population, Migration and the Caribbean Diaspora Economy
Jamaica gained 7,600 people from births over deaths in 2025 but lost roughly 7,000 to net migration,…
Dominican Republic Population: Growth, Migration and Demographic Change
The UN model puts Dominican Republic growth at 1% a year: 1.3% natural increase, minus 0.3% net emig…
Haiti Demographics: A Young Population Facing a Major Development Challenge
Haiti's median age is 24 and about 236,000 people turn 15 each year, yet 1.47 million are displaced …