
Total World Population by Country 2026
| # | Flag | Country | Population ▾ | World Share | Share Bar | Growth Rate | Density /km² | Births/Day | Deaths/Day |
|---|
Population figures based on UN World Population Prospects 2024 · All country populations sum to world total 8,282,474,995
Growth rates, births & deaths derived from UN DESA demographic indicators · Density based on UN land area data
Live counters update every second · Sources: UN DESA, PRB, World Bank, CIA World Factbook
World Population by Country 2026: Live Rankings, Data & Growth Trends
Sometime around mid-November 2022, the United Nations confirmed that the global human population had crossed the eight billion threshold. That number, staggering on its own, has continued climbing without pause.
As of 2026, the total world population by country estimates place the global figure at 8,287,486,258 people, tracked across 195 sovereign nations, with approximately 123,055 births and 50,980 deaths recorded every single day. The net addition to the planet’s human population approaches 72,000 people per day, a pace that carries enormous implications for food systems, urban infrastructure, climate policy, and geopolitical power.
Understanding population by country is not an academic exercise. Where people live, how fast those populations grow, and how densely they cluster shape everything from global supply chains to international migration patterns, from economic productivity to the demand for healthcare.
Countries like India and Nigeria are rewriting regional influence through sheer demographic weight, while nations in Eastern Europe and East Asia face the quieter but equally consequential challenge of population decline. Both realities are unfolding simultaneously, on different continents, and at different speeds.
The data presented here draws from continuously updated population tracking models used by institutions, including the United Nations Population Division and the U.S. Census Bureau’s International Programs Center. These systems aggregate civil registration records, census data, satellite-derived mobility patterns, and statistical modeling to produce real-time estimates.
The figures are not static, they shift with every birth, every death, every migration event logged worldwide. What follows is the most current, country-wise population 2026 analysis available, structured to give readers a clear, usable picture of where humanity stands today.
Top 10 Most Populated Countries in 2026
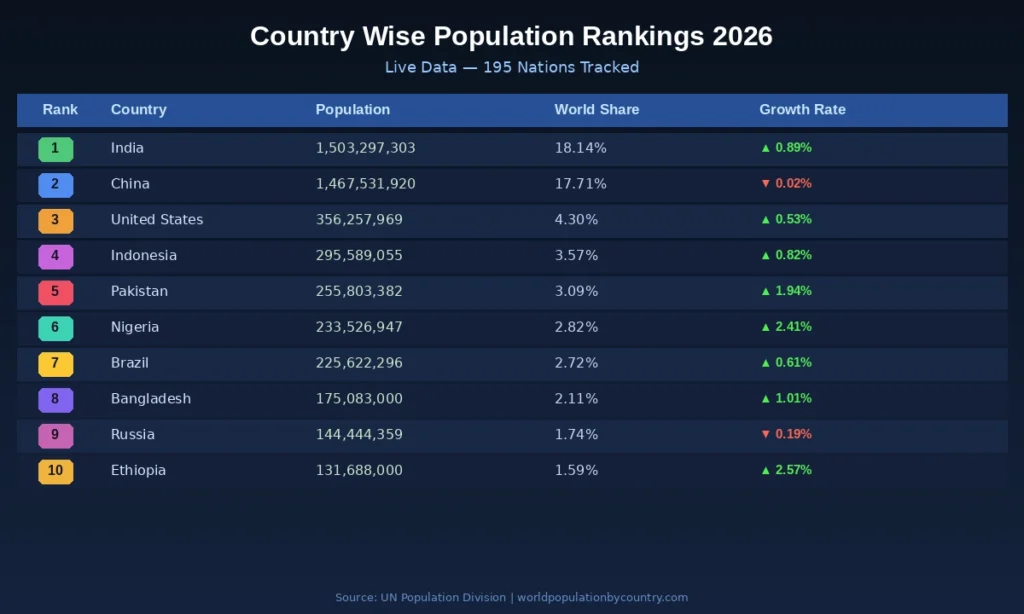
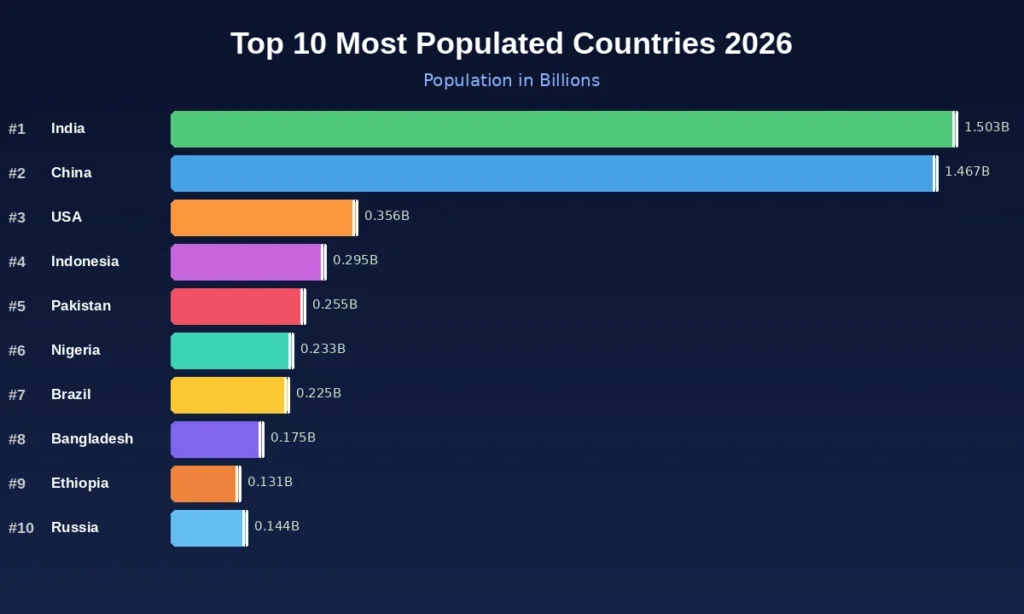
The global population is heavily concentrated. The ten most populous countries combined account for roughly 59 percent of all people alive today, despite representing a fraction of the Earth’s surface.
This concentration has intensified in recent decades as Sub-Saharan Africa and South Asia recorded fertility rates well above replacement level while wealthier regions stabilized or declined.
| Rank | Country | Population (2026 Est.) | World Share | Annual Growth Rate |
|---|---|---|---|---|
| 1 | India | 1,503,297,303 | 18.14% | 0.89% |
| 2 | China | 1,467,531,920 | 17.71% | -0.02% |
| 3 | United States | 356,257,969 | 4.30% | 0.53% |
| 4 | Indonesia | 295,589,055 | 3.57% | 0.82% |
| 5 | Pakistan | 255,803,382 | 3.09% | 1.94% |
| 6 | Nigeria | 233,526,947 | 2.82% | 2.41% |
| 7 | Brazil | 225,622,296 | 2.72% | 0.61% |
| 8 | Bangladesh | 175,083,000 | 2.11% | 1.01% |
| 9 | Ethiopia | 131,688,000 | 1.59% | 2.57% |
| 10 | Russia | 144,444,359 | 1.74% | -0.19% |
The figures make one structural reality unmistakable: Asia dominates global headcount, Europe is contracting, and Africa is the continent driving the next phase of global population growth.
India vs. China: The Population Leadership Shift
For decades, China held the title of the world’s most populous nation. That era is over. India surpassed China in 2023, and by 2026, the gap had continued to widen. India’s population of 1,503,297,303 now exceeds China’s 1,467,531,920 by more than 35 million people, and the divergence is accelerating.
Why India Keeps Growing
India’s total fertility rate (TFR) sits near 2.0, which is close to but still slightly above the replacement rate of 2.1 in some states, while northern states like Uttar Pradesh and Bihar maintain higher rates that continue to push national figures upward.
India’s median age of roughly 28 years means a large working-age cohort is just entering peak reproductive years. The demographic momentum alone, the built-in population growth driven by an already young age structure, will sustain India’s headcount growth well into the 2040s even if fertility continues to fall.
China’s Demographic Reversal
China’s population is now in a phase that demographers call “structural decline.” The country recorded more deaths than births in 2022 for the first time since the Great Famine of 1959-1961, and that trend has persisted. The legacy of the one-child policy (1980-2015) created a severely skewed age pyramid, with a shrinking base of young people and a rapidly expanding elderly population. China’s working-age population peaked around 2011, and the country’s long-term economic model, built on abundant labor, faces mounting pressure as a result.
Country-Wise Population Rankings Table (Positions 11-30)
| Rank | Country | Population (2026 Est.) | World Share |
|---|---|---|---|
| 11 | Mexico | 132,928,000 | 1.60% |
| 12 | Egypt | 108,083,000 | 1.30% |
| 13 | DR Congo | 107,027,000 | 1.29% |
| 14 | Philippines | 119,106,000 | 1.44% |
| 15 | Tanzania | 66,998,000 | 0.81% |
| 16 | Vietnam | 98,551,000 | 1.19% |
| 17 | Iran | 89,657,000 | 1.08% |
| 18 | Turkey | 87,473,000 | 1.06% |
| 19 | Germany | 84,081,000 | 1.01% |
| 20 | Thailand | 71,668,000 | 0.86% |
| 21 | Kenya | 56,211,000 | 0.68% |
| 22 | United Kingdom | 68,347,000 | 0.82% |
| 23 | France | 68,170,000 | 0.82% |
| 24 | South Africa | 61,097,000 | 0.74% |
| 25 | Myanmar | 54,368,000 | 0.66% |
| 26 | South Korea | 51,784,000 | 0.62% |
| 27 | Colombia | 52,215,000 | 0.63% |
| 28 | Argentina | 46,654,000 | 0.56% |
| 29 | Algeria | 47,022,000 | 0.57% |
| 30 | Sudan | 49,624,000 | 0.60% |
United States: Stable Growth Through Immigration
The United States, at 356,257,969, holds third place globally and is expected to retain that position well beyond 2050. Unlike India or Nigeria, the U.S. population growth is not driven by fertility; the national TFR has hovered near 1.6 to 1.7, well below replacement. Immigration accounts for the vast majority of net population gain.
The Pew Research Center has noted that without immigration, the U.S. would already be experiencing natural population decline. The country’s growth rate of 0.53 percent per year reflects this dynamic: modest, sustained, and heavily dependent on continued migration inflows.
Daily Births and Deaths Worldwide
The most visceral way to understand global population dynamics is at the daily scale. Every 24 hours:
- 123,055 babies are born worldwide
- 50,980 people die
- The net gain is approximately 72,075 people per day
That translates to roughly 3 births per second and 1.2 deaths per second at any given moment across all 195 tracked nations. The gap between births and deaths, the natural rate of increase, is what drives global population growth in aggregate. However, the distribution of those births and deaths is radically unequal.
Where Are Births Concentrated?
Sub-Saharan Africa accounts for a disproportionate share of global births. Niger, Mali, Chad, Angola, and the Democratic Republic of Congo all maintain TFRs above 5.0, meaning the average woman in those countries will have five or more children over her lifetime.
Compare that to South Korea’s TFR of 0.72, the lowest ever recorded for any country, or Italy’s 1.24, and the scale of demographic divergence becomes apparent.
Where Are Deaths Rising?
Deaths are concentrated in aging nations. Japan, Germany, Italy, and several Eastern European countries now record more deaths than births annually. Russia’s death rate consistently exceeds its birth rate, a trend that economic instability and emigration have worsened.
The demographic consequences of aging populations include shrinking workforces, rising pension costs, and increased demand for elder care, all of which place pressure on public finances.
Fastest Growing Countries by Population
The countries adding the most people annually, in both absolute and percentage terms, are almost entirely in Sub-Saharan Africa. Nigeria’s growth rate of 2.41 percent per year means its population doubles approximately every 29 years.
At current trajectories, Nigeria is projected to surpass the United States and become the third most populous nation on Earth by around 2050.
| Country | Growth Rate | Projected 2050 Population |
|---|---|---|
| Niger | 3.66% | ~70 million |
| Mali | 2.97% | ~57 million |
| Chad | 2.93% | ~40 million |
| Angola | 2.89% | ~93 million |
| DR Congo | 2.80% | ~215 million |
| Nigeria | 2.41% | ~375 million |
| Ethiopia | 2.57% | ~205 million |
| Uganda | 2.84% | ~104 million |
These are not abstract statistics. A country like the DR Congo, currently home to 107 million people, would more than double its population within 25 years under present growth conditions. The pressure on its agricultural land, water resources, and urban systems will be extraordinary.
Population Density Comparison by Country
Population density, measured in people per square kilometer, tells a story that raw headcount alone cannot. A country with 50 million people in a small land area may be far more constrained than one with 150 million spread across a continent.
| Country | Population | Area (sq km) | Density (per sq km) |
|---|---|---|---|
| Bangladesh | 175,083,000 | 147,570 | 1,186 |
| South Korea | 51,784,000 | 100,210 | 517 |
| India | 1,503,297,303 | 3,287,263 | 457 |
| Netherlands | 17,780,000 | 41,543 | 428 |
| Philippines | 119,106,000 | 300,000 | 397 |
| Japan | 124,516,000 | 377,975 | 329 |
| United Kingdom | 68,347,000 | 243,610 | 281 |
| Pakistan | 255,803,382 | 881,913 | 290 |
| China | 1,467,531,920 | 9,596,960 | 153 |
| United States | 356,257,969 | 9,833,517 | 36 |
| Russia | 144,444,359 | 17,098,242 | 8 |
| Canada | 38,750,000 | 9,984,670 | 4 |
| Australia | 27,042,000 | 7,692,024 | 4 |
Bangladesh stands as the most densely populated large nation on Earth. With a density exceeding 1,186 people per square kilometer, an area roughly comparable to Illinois, hosting the population of Brazil, Bangladesh represents one of the most extreme cases of constrained human geography anywhere in the world.
Regional Population Breakdown 2026
Asia
Asia remains the undisputed population center of the world. Home to more than 4.7 billion people, the continent accounts for over 56 percent of all humans alive.
China and India alone represent 35 percent of the global population. The Asia-Pacific region also includes rapidly aging populations in Japan, South Korea, and parts of Southeast Asia, alongside still-growing populations in the Philippines, Indonesia, and Pakistan.
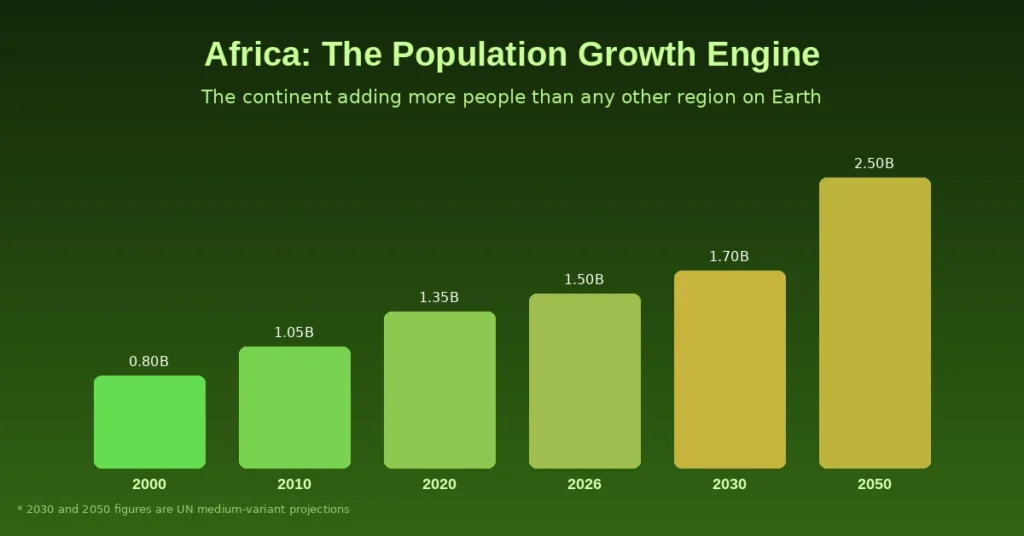
Africa
Africa’s population of approximately 1.5 billion is growing faster than any other continent’s. By 2050, the United Nations projects Africa will be home to more than 2.5 billion people, a near doubling in under three decades.
The continent’s median age of 19 years reflects a population that is overwhelmingly young, which brings both opportunity and challenge depending on how successfully countries can absorb new workforce entrants into productive employment.
Europe
Europe’s 741 million people are aging rapidly. The continent’s fertility rate averaged below 1.5 in 2024, and immigration has been the primary mechanism sustaining modest population growth in countries like Germany, France, and Sweden. Without migration, Europe’s population would be in outright decline at the continental level.
Americas
The Americas, North, Central, and South combined, are home to roughly 1.05 billion people. The United States dominates the North American population, while Brazil anchors South America.
Latin America’s growth rate has slowed considerably as urbanization and improved female education levels have driven fertility rates downward across much of the region.
Oceania
Oceania accounts for the smallest regional population: approximately 45 million people. Australia and Papua New Guinea together represent the majority of the region’s headcount.
Oceania’s growth is mixed; Australia is growing steadily through immigration, and Pacific Island nations are facing unique pressures from climate-related displacement.
Future Population Forecast by Country: 2030 and 2050
The United Nations Population Division’s medium-variant projections offer the most widely cited forward view of where global numbers are heading.
| Country | 2026 Est. | 2030 Projection | 2050 Projection |
|---|---|---|---|
| India | 1,503,297,303 | 1,531,000,000 | 1,668,000,000 |
| China | 1,467,531,920 | 1,416,000,000 | 1,313,000,000 |
| United States | 356,257,969 | 364,000,000 | 394,000,000 |
| Nigeria | 233,526,947 | 263,000,000 | 375,000,000 |
| Pakistan | 255,803,382 | 273,000,000 | 338,000,000 |
| Brazil | 225,622,296 | 229,000,000 | 228,000,000 |
| Indonesia | 295,589,055 | 306,000,000 | 330,000,000 |
| Ethiopia | 131,688,000 | 152,000,000 | 205,000,000 |
| DR Congo | 107,027,000 | 128,000,000 | 215,000,000 |
| Russia | 144,444,359 | 141,000,000 | 130,000,000 |
By 2050, the world’s population is expected to reach approximately 9.7 billion under the UN’s medium-variant scenario. Critically, virtually all of that growth will originate from Africa and parts of South Asia. Europe, East Asia, and Latin America are collectively expected to contribute negligible net growth, and in some cases, a significant decline.
India will reach its peak population somewhere around 2060 before beginning its own gradual decline. China, by contrast, has already begun a descent that most demographers expect to be sustained and irreversible without dramatic policy intervention. By 2100, some models suggest China’s population could fall to between 700 and 800 million, a level not seen since the late 1960s.
What the Numbers Mean for the Next Decade
The data on world population by country in 2026 is not simply a snapshot of how many people live where. It is a forward signal, about where economic power is migrating, where humanitarian challenges will intensify, and where the next generation of global consumers, workers, and innovators will emerge.
Countries with young, rapidly growing populations face a dual-edged reality. When managed well, through investment in education, job creation, and institutional governance, demographic youth becomes an engine of growth that economists call the “demographic dividend.” It is precisely this dynamic that powered East Asia’s economic rise from the 1960s through the 1990s. Whether Sub-Saharan Africa can replicate that trajectory remains one of the defining questions of the 21st century.
Meanwhile, aging nations are already recalibrating. Japan has deployed robotics at scale to compensate for labor shortfalls. Germany has liberalized its immigration law multiple times in the past decade. South Korea, with the world’s lowest fertility rate, is wrestling with a demographic crisis that no policy intervention has meaningfully reversed. These are not distant hypotheticals; they are structural conditions reshaping national budgets, pension systems, and foreign policy postures today.
Population data, when read carefully, is less a census of the present than a map of the future. The countries currently adding the most people will carry the most weight in global institutions, markets, and political systems in 2050. The countries losing population will face the harder work of doing more with fewer workers, fewer taxpayers, and fewer innovators, unless they find sustainable pathways through migration and technology. Both stories are worth watching closely.
Frequently Asked Questions
1. Which country has the highest population in 2026?
India holds the top position with an estimated population of 1,503,297,303 in 2026. It surpassed China in 2023, and the gap has grown steadily since. India’s young age structure and above-replacement fertility rates in several northern states continue to drive this lead.
2. What is the total world population in 2026?
The estimated total world population in 2026 is 8,287,486,258. This figure is derived from continuously updated models maintained by organizations, including the United Nations Population Division, and is distributed across 195 tracked nations.
3. How many births and deaths occur worldwide every day?
Approximately 123,055 births and 50,980 deaths are recorded globally each day. This produces a net daily increase of around 72,000 people. The difference reflects the gap between high birth rates in developing nations and rising death rates in aging, developed ones.
4. Is China’s population still growing?
No. China’s population is now in decline. The country recorded more deaths than births beginning in 2022, and that trend has continued into 2026. China’s estimated population of 1,467,531,920 reflects a negative annual growth rate of approximately 0.02 percent.
5. Which African country has the fastest-growing population?
Niger holds the highest growth rate among all African nations, at approximately 3.66 percent annually. Nigeria, though lower in percentage terms at 2.41 percent, adds more people in absolute numbers each year due to its much larger base population of over 233 million.
6. What is the most densely populated country in the world?
Among large nations, Bangladesh is the most densely populated, with over 1,186 people per square kilometer. Several small city-states and territories, such as Monaco and Macau, have higher densities, but Bangladesh is by far the most extreme case among nations with populations in the tens or hundreds of millions.
7. How is the live world population data calculated?
Live population estimates are generated by statistical models that combine the most recent national census data with calculated rates of natural increase (births minus deaths) and net migration. These models update continuously and are maintained by international agencies, including the UN, World Bank, and national statistics offices.
8. How will the world population change by 2050?
The UN’s medium-variant projection places the global population at approximately 9.7 billion by 2050. Nearly all growth will come from Sub-Saharan Africa and parts of South Asia. Countries including Nigeria, Ethiopia, and the DR Congo are each projected to roughly double their current populations by mid-century.
9. Which regions are experiencing population decline?
Eastern Europe has the most acute population decline, with countries including Bulgaria, Latvia, Lithuania, and Serbia shrinking due to low fertility and emigration. China, Japan, South Korea, and Russia also face sustained or projected declines. Germany and Italy are holding relatively stable only through immigration.
10. Why does population density matter more than total population?
Population density determines how much land, water, and infrastructure exist per person, which directly affects food security, urban quality of life, and economic productivity. A country with 300 million people across a vast territory like the United States faces fundamentally different resource pressures than Bangladesh, with 175 million people in an area roughly the size of Iowa.