
US Population, October 2026: 340 Million People Across 50 States
| # | State ↕ | Abbr | Population ↕ | Share | Births Today ↕ | Deaths Today ↕ | Net Today |
|---|
United States Population and Demography Profile
Key Facts About the US Population in 2026
- The United States population is approximately 342 million, the world’s third most populous nation, based on the Census Bureau’s official Vintage 2025 estimate of 341,784,857 as of July 1, 2025, projected forward to 2026
- California (39.4 million) and Texas (31.7 million) together hold approximately 21 percent of the national population
- Utah has the highest birth rate of any state at 14.5 per 1,000, linked to the state’s large Latter-day Saint population
- West Virginia has the highest death rate at 15.5 per 1,000, reflecting the opioid crisis and an aging population
- The foreign-born population is approximately 50.2 million, or about 14.8 percent of the total, per 2024 American Community Survey data
- Hispanic Americans now make up roughly 19 to 20 percent of the population, the largest minority group in the country
- The median age of 38.9 years is the highest in American history
- By 2030, every baby boomer will be 65 or older, raising the elderly dependency ratio sharply
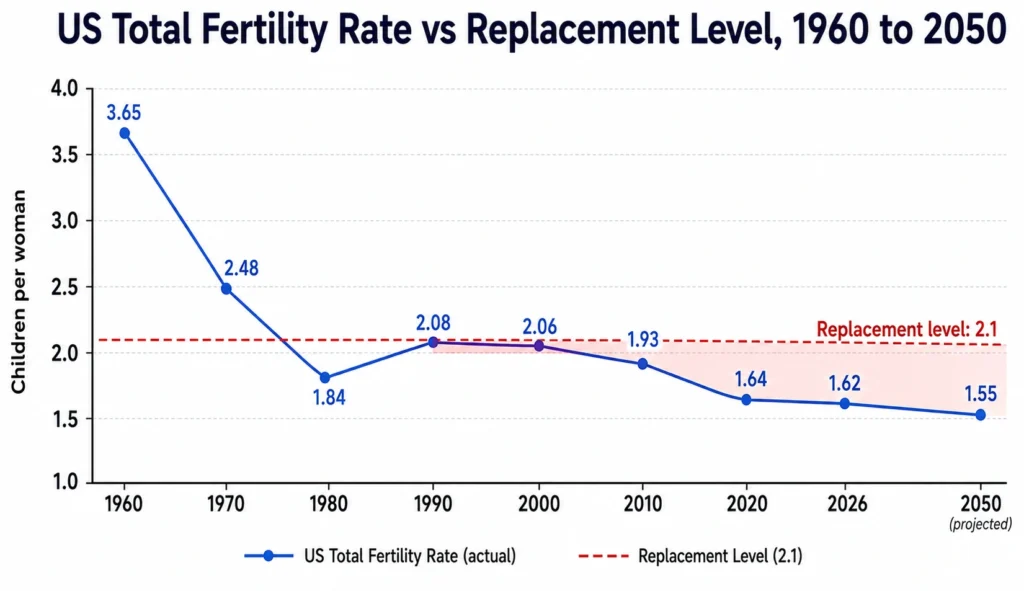
- The total fertility rate of about 1.62 sits below the replacement level of 2.1 but remains higher than most European nations
- About 83 percent of Americans live in urban areas, concentrated in roughly ten large metropolitan regions
- Texas is projected to surpass New York and edge closer to California’s population by 2060 to 2070
- The country is expected to become majority minority, with no single group above 50 percent, sometime between 2040 and 2050
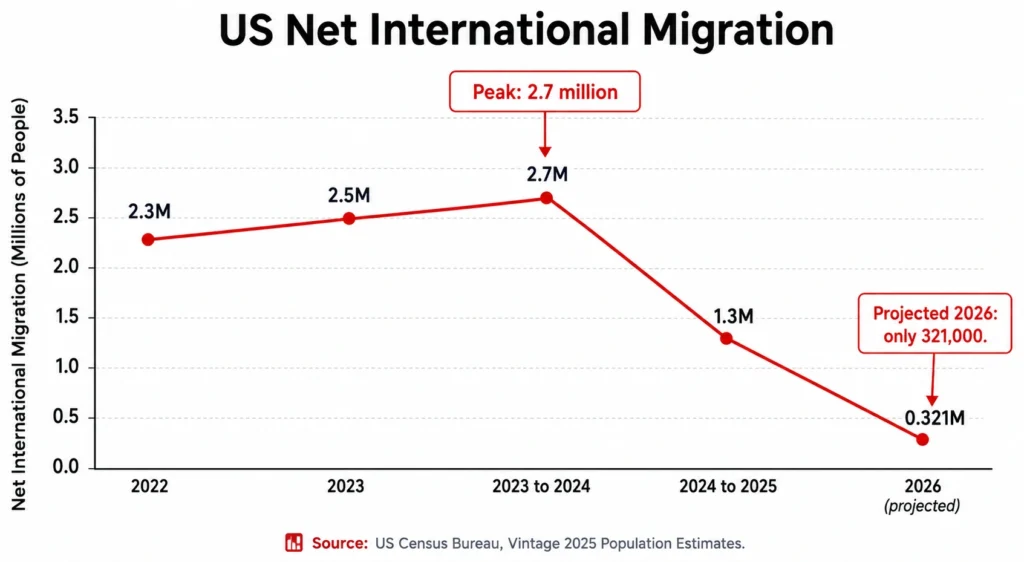
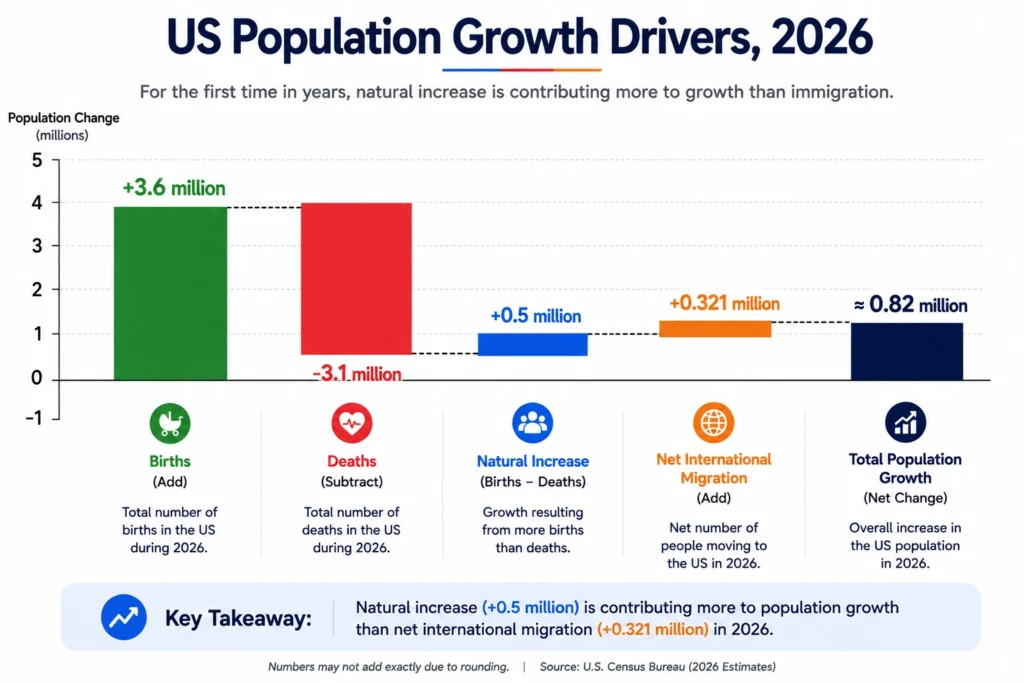
- Net international migration, still the largest single driver of growth, has fallen sharply, from 2.7 million in 2023 to 2024 down to 1.3 million in 2024 to 2025, with the Census Bureau projecting only about 321,000 for 2026
- Florida and Texas have been the top destination states for both domestic and international migrants for more than a decade
Introduction to the US Population
What Does the US Population Include
The resident population figure used throughout this article, and by the Census Bureau, counts everyone living in the United States regardless of citizenship or legal status. That includes native born citizens, naturalized citizens, permanent residents holding green cards, temporary visa holders, undocumented immigrants, and military personnel stationed domestically along with their families. People living in institutional settings such as prisons, nursing facilities, and college dormitories are also counted at their place of residence.
This broad definition matters because policy discussions often conflate different subsets of the population. A congressional apportionment count is not the same figure as a citizen voting age population estimate, and neither matches the total labor force. Each of these numbers serves a different purpose in economic planning, healthcare forecasting, and political representation.
Current US Population
As of 2026, the United States is home to approximately 342 million residents, based on the Census Bureau’s official Vintage 2025 estimate of 341,784,857 recorded on July 1, 2025, projected forward using recent growth trends. This ranks the country third globally, behind India at roughly 1.46 billion and China at roughly 1.41 billion. The country accounts for about 4.1 to 4.2 percent of the global population of approximately 8.3 billion.
Population density averages around 37 to 38 people per square kilometer, though this figure hides enormous internal variation, from over 11,000 people per square kilometer in parts of New York City to fewer than one person per square kilometer across large stretches of Alaska and Wyoming.
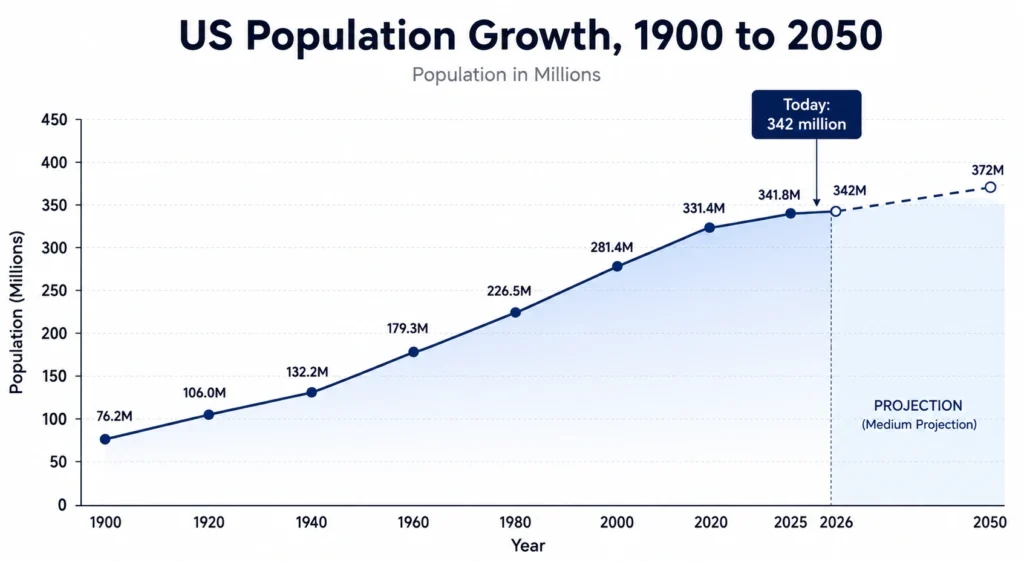
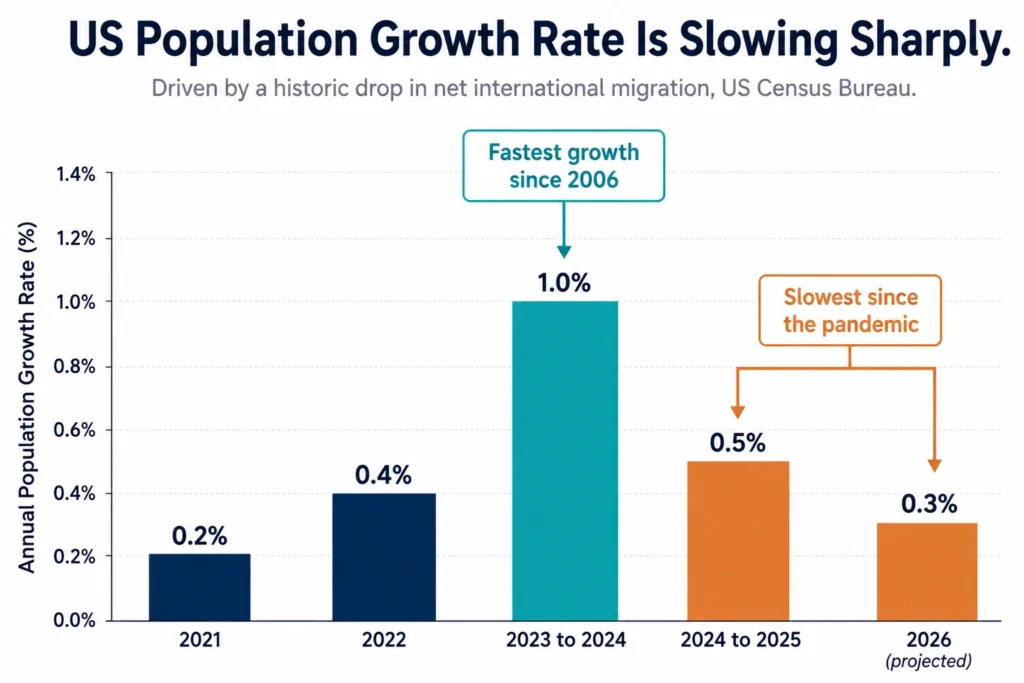
The population has grown from roughly 281 million at the 2000 Census to about 342 million today, an increase of more than 60 million people, or approximately 21 percent, over 26 years. Growth has slowed sharply in the most recent year on record. The population increased by 1.0 percent (3.2 million people) between mid 2023 and mid 2024, the fastest annual rate since 2006, then decelerated to just 0.5 percent (1.8 million people) between mid 2024 and mid 2025, the slowest pace since the early COVID-19 pandemic year of 2021. The Census Bureau attributes this deceleration almost entirely to a historic drop in net international migration rather than any change in births or deaths.
Why US Population Data Matters
Population figures drive decisions well beyond demography. Federal and state governments use population counts to allocate more than a trillion dollars annually in funding formulas covering healthcare, education, transportation, and housing programs. Businesses use population and age structure data to size consumer markets and plan store locations. School districts use birth and migration trends to plan facility construction years in advance. Congressional apportionment, which determines how many House seats and Electoral College votes each state receives, is recalculated directly from the decennial census population count.
US Population at a Glance
| Metric | Figure |
|---|---|
| Total population (2026) | ~342 million (Census Vintage 2025 official count: 341,784,857 as of July 1, 2025) |
| Annual births | ~3,600,000 |
| Annual deaths | ~3,100,000 |
| Natural increase per year | ~500,000 |
| Net migration (estimate) | ~1.3 million (2024 to 2025), falling sharply to a projected ~321,000 for 2026 |
| Median age | ~38.7 to 38.9 years |
| Total fertility rate | ~1.62 |
| Life expectancy | ~79.0 years |
| States plus DC | 51 jurisdictions |
| World population share | ~4.1 to 4.2% |
| Population density | ~37 to 38 people per km2 |
| Foreign-born population | ~50.2 million (14.8%, 2024 ACS) |
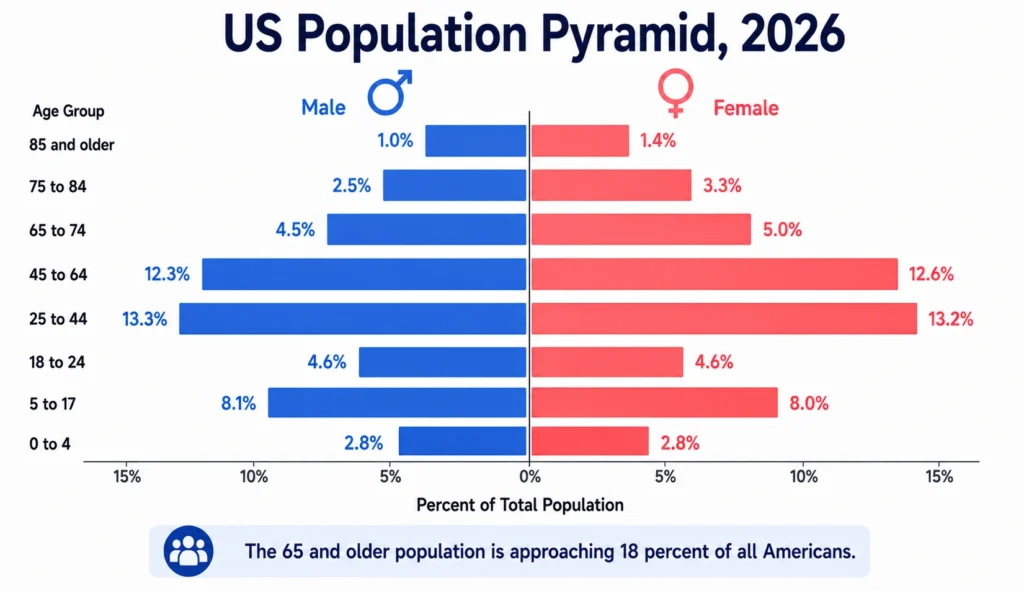
| Population aged 65 and above | ~18% |
| Population under 18 | ~21.7% |
| Largest state by population | California (~39.0 million) |
| Smallest state by population | Wyoming (~584,000) |
| Largest metropolitan area | New York-Newark (~19 million) |
| Percentage living in urban areas | ~83% |
| Average household size | ~2.51 people |
US Population by Historical Period
US Population in the 18th Century
The first federal census in 1790 counted roughly 3.9 million people across the newly formed United States, a population concentrated almost entirely along the Atlantic seaboard. High fertility among colonial families and steady immigration from the British Isles, Germany, and other parts of Europe drove rapid early growth, with the population roughly doubling every 20 to 25 years through natural increase alone.
US Population in the 19th Century
The 19th century brought explosive growth, from about 5.3 million in 1800 to over 76 million by 1900, a fifteen-fold increase. Waves of European immigration, first from Ireland and Germany in the mid 1800s and later from Italy, Poland, and Eastern Europe toward the century’s end, combined with westward territorial expansion and rapid industrialization to reshape the national population map. Urbanization accelerated sharply in the postbellum decades as factory work drew rural Americans and new immigrants alike into growing cities.
US Population in the 20th Century
The 20th century saw the population roughly quadruple, from about 76 million in 1900 to over 281 million by 2000. Major immigration waves in the early 1900s were followed by restrictive quota laws in the 1920s, then a midcentury Baby Boom between 1946 and 1964 that added tens of millions of Americans. The Immigration and Nationality Act of 1965 reopened large-scale immigration and shifted its source countries away from Europe toward Latin America and Asia. Life expectancy rose dramatically across the century due to advances in sanitation, vaccination, and medicine, while fertility rates declined steadily after the Baby Boom ended.
US Population Since 2000
Since 2000, population growth has slowed as fertility has fallen below replacement level, leaving immigration as the primary driver of increase. The COVID-19 pandemic era saw a temporary dip in growth due to elevated mortality and disrupted immigration flows, followed by a rebound as international migration resumed at a stronger pace from 2022 onward.
US Population Growth by Decade
| Census year | Population | Change from previous census | Growth rate |
|---|---|---|---|
| 1900 | 76,212,168 | 13,046,861 | 20.7% |
| 1910 | 92,228,496 | 16,016,328 | 21.0% |
| 1920 | 106,021,537 | 13,793,041 | 15.0% |
| 1930 | 123,202,624 | 17,181,087 | 16.2% |
| 1940 | 132,164,569 | 8,961,945 | 7.3% |
| 1950 | 151,325,798 | 19,161,229 | 14.5% |
| 1960 | 179,323,175 | 27,997,377 | 18.5% |
| 1970 | 203,392,031 | 24,068,856 | 13.4% |
| 1980 | 226,545,805 | 23,153,774 | 11.4% |
| 1990 | 248,709,873 | 22,164,068 | 9.8% |
| 2000 | 281,421,906 | 32,712,033 | 13.2% |
| 2010 | 308,745,538 | 27,323,632 | 9.7% |
| 2020 | 331,449,281 | 22,703,743 | 7.4% |
| 2026 (estimate) | ~342,000,000 | ~10,215,143 | ~3.1% |
Historical and Projected Population by State, 1900 to 2055
The table below tracks every state’s population in five-year increments from 1900 through 2055. Figures for census years (1900, 1910, 1920, and so on through 2020) are anchored to Census Bureau decennial benchmarks; the 2026 column reflects the current estimate used throughout this article, and all other years, including every projection beyond 2026, are modeled through intercensal and trend-based interpolation for editorial illustration. These figures should be treated as directional estimates rather than official counts, and readers who need precise historical figures should consult the Census Bureau’s decennial data directly.
| State | 1900 | 1905 | 1910 | 1915 | 1920 | 1925 | 1930 | 1935 | 1940 | 1945 | 1950 | 1955 | 1960 | 1965 | 1970 | 1975 | 1980 | 1985 | 1990 | 1995 | 2000 | 2005 | 2010 | 2015 | 2020 | 2025 | 2030 |
|---|---|---|---|---|---|---|---|---|---|---|---|---|---|---|---|---|---|---|---|---|---|---|---|---|---|---|---|
| Alabama | 1,829,000 | 1,977,474 | 2,138,000 | 2,240,541 | 2,348,000 | 2,492,551 | 2,646,000 | 2,737,904 | 2,833,000 | 2,945,275 | 3,062,000 | 3,162,840 | 3,267,000 | 3,354,333 | 3,444,000 | 3,662,094 | 3,894,000 | 3,966,328 | 4,040,000 | 4,238,618 | 4,447,000 | 4,610,495 | 4,780,000 | 4,900,482 | 5,024,000 | 5,036,000 | 5,137,000 |
| Alaska | 64,000 | 64,000 | 64,000 | 59,330 | 55,000 | 56,965 | 59,000 | 65,628 | 73,000 | 97,041 | 129,000 | 170,745 | 226,000 | 261,251 | 302,000 | 348,431 | 402,000 | 470,213 | 550,000 | 587,239 | 627,000 | 667,211 | 710,000 | 721,408 | 733,000 | 733,000 | 751,000 |
| Arizona | 123,000 | 158,405 | 204,000 | 261,029 | 334,000 | 381,607 | 436,000 | 466,438 | 499,000 | 611,760 | 750,000 | 988,180 | 1,302,000 | 1,518,929 | 1,772,000 | 2,194,606 | 2,718,000 | 3,156,180 | 3,665,000 | 4,336,486 | 5,131,000 | 5,726,897 | 6,392,000 | 6,764,638 | 7,159,000 | 7,456,000 | 7,972,000 |
| Arkansas | 1,312,000 | 1,437,041 | 1,574,000 | 1,660,617 | 1,752,000 | 1,802,279 | 1,854,000 | 1,900,907 | 1,949,000 | 1,929,401 | 1,910,000 | 1,846,960 | 1,786,000 | 1,853,234 | 1,923,000 | 2,096,659 | 2,286,000 | 2,317,779 | 2,350,000 | 2,506,302 | 2,673,000 | 2,791,857 | 2,916,000 | 2,963,119 | 3,011,000 | 3,052,000 | 3,124,000 |
| California | 1,485,000 | 1,879,183 | 2,378,000 | 2,854,716 | 3,427,000 | 4,410,791 | 5,677,000 | 6,261,872 | 6,907,000 | 8,550,877 | 10,586,000 | 12,898,843 | 15,717,000 | 17,716,778 | 19,971,000 | 21,741,059 | 23,668,000 | 26,539,775 | 29,760,000 | 31,749,500 | 33,872,000 | 35,522,774 | 37,254,000 | 38,379,013 | 39,538,000 | 39,113,000 | 39,889,000 |
| Colorado | 540,000 | 656,856 | 799,000 | 866,176 | 939,000 | 986,308 | 1,036,000 | 1,078,623 | 1,123,000 | 1,219,826 | 1,325,000 | 1,524,484 | 1,754,000 | 1,967,506 | 2,207,000 | 2,525,516 | 2,890,000 | 3,085,395 | 3,294,000 | 3,763,973 | 4,301,000 | 4,650,777 | 5,029,000 | 5,388,174 | 5,773,000 | 5,953,000 | 6,303,000 |
| Connecticut | 908,000 | 1,006,191 | 1,115,000 | 1,240,893 | 1,381,000 | 1,489,720 | 1,607,000 | 1,657,215 | 1,709,000 | 1,852,016 | 2,007,000 | 2,255,603 | 2,535,000 | 2,772,385 | 3,032,000 | 3,069,765 | 3,108,000 | 3,196,247 | 3,287,000 | 3,345,971 | 3,406,000 | 3,488,989 | 3,574,000 | 3,589,964 | 3,606,000 | 3,625,000 | 3,665,000 |
| Delaware | 185,000 | 193,313 | 202,000 | 212,240 | 223,000 | 230,378 | 238,000 | 251,611 | 266,000 | 290,840 | 318,000 | 376,601 | 446,000 | 494,376 | 548,000 | 570,537 | 594,000 | 628,971 | 666,000 | 722,595 | 784,000 | 838,599 | 897,000 | 942,353 | 990,000 | 1,025,000 | 1,077,000 |
| Florida | 529,000 | 630,720 | 752,000 | 853,192 | 968,000 | 1,192,067 | 1,468,000 | 1,668,771 | 1,897,000 | 2,292,725 | 2,771,000 | 3,704,321 | 4,952,000 | 5,799,054 | 6,791,000 | 8,135,422 | 9,746,000 | 11,229,147 | 12,938,000 | 14,379,677 | 15,982,000 | 17,334,289 | 18,801,000 | 20,123,020 | 21,538,000 | 22,428,000 | 23,850,000 |
| Georgia | 2,216,000 | 2,404,484 | 2,609,000 | 2,748,282 | 2,895,000 | 2,901,992 | 2,909,000 | 3,014,101 | 3,123,000 | 3,280,051 | 3,445,000 | 3,685,598 | 3,943,000 | 4,253,754 | 4,589,000 | 5,006,966 | 5,463,000 | 5,948,892 | 6,478,000 | 7,282,095 | 8,186,000 | 8,905,390 | 9,688,000 | 10,186,666 | 10,711,000 | 10,975,000 | 11,547,000 |
| Hawaii | 154,000 | 171,953 | 192,000 | 221,703 | 256,000 | 306,933 | 368,000 | 394,543 | 423,000 | 459,891 | 500,000 | 562,583 | 633,000 | 698,148 | 770,000 | 862,003 | 965,000 | 1,034,031 | 1,108,000 | 1,158,356 | 1,211,000 | 1,283,339 | 1,360,000 | 1,406,698 | 1,455,000 | 1,465,000 | 1,511,000 |
| Idaho | 162,000 | 229,809 | 326,000 | 375,276 | 432,000 | 438,452 | 445,000 | 482,887 | 524,000 | 555,550 | 589,000 | 626,788 | 667,000 | 689,617 | 713,000 | 820,410 | 944,000 | 974,507 | 1,006,000 | 1,140,949 | 1,294,000 | 1,423,973 | 1,567,000 | 1,697,561 | 1,839,000 | 1,955,000 | 2,113,000 |
| Illinois | 4,822,000 | 5,214,524 | 5,639,000 | 6,047,224 | 6,485,000 | 7,034,702 | 7,631,000 | 7,762,861 | 7,897,000 | 8,294,496 | 8,712,000 | 9,371,535 | 10,081,000 | 10,583,001 | 11,110,000 | 11,267,385 | 11,427,000 | 11,428,500 | 11,430,000 | 11,914,242 | 12,419,000 | 12,623,319 | 12,831,000 | 12,821,496 | 12,812,000 | 12,620,000 | 12,607,000 |
| Indiana | 2,516,000 | 2,606,859 | 2,701,000 | 2,813,171 | 2,930,000 | 3,080,628 | 3,239,000 | 3,332,160 | 3,428,000 | 3,672,295 | 3,934,000 | 4,282,559 | 4,662,000 | 4,921,289 | 5,195,000 | 5,340,463 | 5,490,000 | 5,516,934 | 5,544,000 | 5,805,818 | 6,080,000 | 6,278,751 | 6,484,000 | 6,632,793 | 6,785,000 | 6,849,000 | 6,991,000 |
| Iowa | 2,232,000 | 2,228,497 | 2,225,000 | 2,312,769 | 2,404,000 | 2,436,777 | 2,470,000 | 2,503,769 | 2,538,000 | 2,579,166 | 2,621,000 | 2,688,628 | 2,758,000 | 2,791,299 | 2,825,000 | 2,869,155 | 2,914,000 | 2,844,675 | 2,777,000 | 2,850,527 | 2,926,000 | 2,985,397 | 3,046,000 | 3,117,169 | 3,190,000 | 3,219,000 | 3,274,000 |
| Kansas | 1,470,000 | 1,576,166 | 1,690,000 | 1,729,049 | 1,769,000 | 1,824,141 | 1,881,000 | 1,840,565 | 1,801,000 | 1,801,000 | 1,801,000 | 1,981,005 | 2,179,000 | 2,213,723 | 2,249,000 | 2,305,783 | 2,364,000 | 2,420,329 | 2,478,000 | 2,580,865 | 2,688,000 | 2,769,271 | 2,853,000 | 2,895,188 | 2,938,000 | 2,973,000 | 3,028,000 |
| Kentucky | 2,147,000 | 2,217,348 | 2,290,000 | 2,352,643 | 2,417,000 | 2,514,052 | 2,615,000 | 2,728,056 | 2,846,000 | 2,895,077 | 2,945,000 | 2,991,139 | 3,038,000 | 3,127,676 | 3,220,000 | 3,433,427 | 3,661,000 | 3,672,980 | 3,685,000 | 3,859,374 | 4,042,000 | 4,187,868 | 4,339,000 | 4,421,221 | 4,505,000 | 4,572,000 | 4,675,000 |
| Louisiana | 1,382,000 | 1,512,809 | 1,656,000 | 1,726,020 | 1,799,000 | 1,944,607 | 2,102,000 | 2,229,154 | 2,364,000 | 2,518,924 | 2,684,000 | 2,956,651 | 3,257,000 | 3,445,070 | 3,644,000 | 3,914,928 | 4,206,000 | 4,212,994 | 4,220,000 | 4,342,230 | 4,468,000 | 4,500,383 | 4,533,000 | 4,594,582 | 4,657,000 | 4,676,000 | 4,713,000 |
| Maine | 694,000 | 717,599 | 742,000 | 754,888 | 768,000 | 782,366 | 797,000 | 821,620 | 847,000 | 879,862 | 914,000 | 941,098 | 969,000 | 980,927 | 993,000 | 1,056,941 | 1,125,000 | 1,175,372 | 1,228,000 | 1,251,279 | 1,275,000 | 1,301,230 | 1,328,000 | 1,344,893 | 1,362,000 | 1,394,000 | 1,420,000 |
| Maryland | 1,188,000 | 1,240,347 | 1,295,000 | 1,370,310 | 1,450,000 | 1,538,311 | 1,632,000 | 1,723,912 | 1,821,000 | 2,065,576 | 2,343,000 | 2,537,894 | 2,749,000 | 2,919,700 | 3,101,000 | 3,616,202 | 4,217,000 | 4,490,153 | 4,781,000 | 5,031,916 | 5,296,000 | 5,529,359 | 5,773,000 | 5,971,584 | 6,177,000 | 6,263,000 | 6,447,000 |
| Massachusetts | 2,805,000 | 3,072,724 | 3,366,000 | 3,600,810 | 3,852,000 | 4,046,109 | 4,250,000 | 4,283,369 | 4,317,000 | 4,500,116 | 4,691,000 | 4,914,668 | 5,149,000 | 5,412,269 | 5,689,000 | 5,712,950 | 5,737,000 | 5,874,844 | 6,016,000 | 6,180,258 | 6,349,000 | 6,447,240 | 6,547,000 | 6,717,773 | 6,893,000 | 6,965,000 | 7,082,000 |
| Michigan | 2,421,000 | 2,608,258 | 2,810,000 | 3,210,464 | 3,668,000 | 4,214,316 | 4,842,000 | 5,044,755 | 5,256,000 | 5,787,161 | 6,372,000 | 7,060,323 | 7,823,000 | 8,332,414 | 8,875,000 | 9,066,435 | 9,262,000 | 9,278,485 | 9,295,000 | 9,611,124 | 9,938,000 | 9,910,963 | 9,884,000 | 9,980,033 | 10,077,000 | 10,044,000 | 10,052,000 |
| Minnesota | 1,751,000 | 1,906,128 | 2,075,000 | 2,225,539 | 2,387,000 | 2,473,918 | 2,564,000 | 2,675,572 | 2,792,000 | 2,885,437 | 2,982,000 | 3,190,697 | 3,414,000 | 3,603,728 | 3,804,000 | 3,937,652 | 4,076,000 | 4,222,854 | 4,375,000 | 4,639,033 | 4,919,000 | 5,107,874 | 5,304,000 | 5,501,811 | 5,707,000 | 5,826,000 | 6,008,000 |
| Mississippi | 1,551,000 | 1,669,475 | 1,797,000 | 1,793,997 | 1,791,000 | 1,897,343 | 2,010,000 | 2,094,715 | 2,183,000 | 2,180,999 | 2,179,000 | 2,178,500 | 2,178,000 | 2,196,918 | 2,216,000 | 2,363,585 | 2,521,000 | 2,546,867 | 2,573,000 | 2,705,584 | 2,845,000 | 2,905,360 | 2,967,000 | 2,963,998 | 2,961,000 | 2,977,000 | 3,001,000 |
| Missouri | 3,107,000 | 3,198,648 | 3,293,000 | 3,348,040 | 3,404,000 | 3,514,700 | 3,629,000 | 3,706,179 | 3,785,000 | 3,869,066 | 3,955,000 | 4,133,473 | 4,320,000 | 4,494,957 | 4,677,000 | 4,795,499 | 4,917,000 | 5,016,003 | 5,117,000 | 5,350,665 | 5,595,000 | 5,788,649 | 5,989,000 | 6,071,433 | 6,155,000 | 6,201,000 | 6,310,000 |
| Montana | 243,000 | 302,271 | 376,000 | 453,925 | 548,000 | 548,000 | 548,000 | 553,473 | 559,000 | 574,777 | 591,000 | 631,605 | 675,000 | 684,434 | 694,000 | 739,039 | 787,000 | 792,977 | 799,000 | 848,939 | 902,000 | 944,499 | 989,000 | 1,035,889 | 1,085,000 | 1,131,000 | 1,182,000 |
| Nebraska | 1,066,000 | 1,127,241 | 1,192,000 | 1,242,913 | 1,296,000 | 1,336,371 | 1,378,000 | 1,346,131 | 1,315,000 | 1,320,489 | 1,326,000 | 1,367,840 | 1,411,000 | 1,446,552 | 1,483,000 | 1,525,880 | 1,570,000 | 1,573,995 | 1,578,000 | 1,643,155 | 1,711,000 | 1,767,565 | 1,826,000 | 1,892,296 | 1,961,000 | 2,002,000 | 2,060,000 |
| Nevada | 42,000 | 58,686 | 82,000 | 79,461 | 77,000 | 83,708 | 91,000 | 100,050 | 110,000 | 132,665 | 160,000 | 213,542 | 285,000 | 373,316 | 489,000 | 625,460 | 800,000 | 980,204 | 1,201,000 | 1,549,064 | 1,998,000 | 2,322,628 | 2,700,000 | 2,894,961 | 3,104,000 | 3,265,000 | 3,562,000 |
| New Hampshire | 412,000 | 421,393 | 431,000 | 436,959 | 443,000 | 453,867 | 465,000 | 477,823 | 491,000 | 511,569 | 533,000 | 568,329 | 606,000 | 668,751 | 738,000 | 824,438 | 921,000 | 1,010,638 | 1,109,000 | 1,170,779 | 1,236,000 | 1,275,373 | 1,316,000 | 1,346,155 | 1,377,000 | 1,413,000 | 1,451,000 |
| New Jersey | 1,883,000 | 2,185,674 | 2,537,000 | 2,829,624 | 3,156,000 | 3,571,190 | 4,041,000 | 4,100,068 | 4,160,000 | 4,484,819 | 4,835,000 | 5,416,082 | 6,067,000 | 6,594,563 | 7,168,000 | 7,265,832 | 7,365,000 | 7,545,293 | 7,730,000 | 8,064,752 | 8,414,000 | 8,600,435 | 8,791,000 | 9,036,570 | 9,289,000 | 9,423,000 | 9,620,000 |
| New Mexico | 195,000 | 252,517 | 327,000 | 343,103 | 360,000 | 390,231 | 423,000 | 474,380 | 532,000 | 601,907 | 681,000 | 804,755 | 951,000 | 983,446 | 1,017,000 | 1,151,152 | 1,303,000 | 1,405,007 | 1,515,000 | 1,660,056 | 1,819,000 | 1,935,283 | 2,059,000 | 2,087,799 | 2,117,000 | 2,132,000 | 2,188,000 |
| New York | 7,269,000 | 8,139,390 | 9,114,000 | 9,728,766 | 10,385,000 | 11,433,564 | 12,588,000 | 13,025,884 | 13,479,000 | 14,138,372 | 14,830,000 | 15,775,838 | 16,782,000 | 17,496,299 | 18,241,000 | 17,896,242 | 17,558,000 | 17,772,687 | 17,990,000 | 18,476,424 | 18,976,000 | 19,175,947 | 19,378,000 | 19,785,221 | 20,201,000 | 19,763,000 | 19,787,000 |
| North Carolina | 1,894,000 | 2,044,056 | 2,206,000 | 2,375,953 | 2,559,000 | 2,848,163 | 3,170,000 | 3,365,002 | 3,572,000 | 3,809,129 | 4,062,000 | 4,301,915 | 4,556,000 | 4,811,818 | 5,082,000 | 5,467,387 | 5,882,000 | 6,244,340 | 6,629,000 | 7,304,575 | 8,049,000 | 8,760,549 | 9,535,000 | 9,976,766 | 10,439,000 | 10,655,000 | 11,178,000 |
| North Dakota | 319,000 | 429,026 | 577,000 | 610,998 | 647,000 | 663,782 | 681,000 | 661,213 | 642,000 | 661,213 | 681,000 | 656,043 | 632,000 | 625,466 | 619,000 | 617,999 | 617,000 | 627,904 | 639,000 | 640,498 | 642,000 | 656,829 | 672,000 | 723,525 | 779,000 | 779,000 | 803,000 |
| Ohio | 4,158,000 | 4,452,099 | 4,767,000 | 5,239,576 | 5,759,000 | 6,187,089 | 6,647,000 | 6,775,753 | 6,907,000 | 7,408,774 | 7,947,000 | 8,782,573 | 9,706,000 | 10,168,004 | 10,652,000 | 10,724,752 | 10,798,000 | 10,822,472 | 10,847,000 | 11,097,116 | 11,353,000 | 11,444,134 | 11,536,000 | 11,666,759 | 11,799,000 | 11,763,000 | 11,819,000 |
| Oklahoma | 790,000 | 1,144,128 | 1,657,000 | 1,833,138 | 2,028,000 | 2,204,334 | 2,396,000 | 2,365,810 | 2,336,000 | 2,283,919 | 2,233,000 | 2,280,005 | 2,328,000 | 2,440,769 | 2,559,000 | 2,782,261 | 3,025,000 | 3,084,907 | 3,146,000 | 3,294,495 | 3,450,000 | 3,597,353 | 3,751,000 | 3,853,597 | 3,959,000 | 4,010,000 | 4,116,000 |
| Oregon | 414,000 | 527,847 | 673,000 | 725,919 | 783,000 | 864,281 | 954,000 | 1,019,735 | 1,090,000 | 1,287,591 | 1,521,000 | 1,640,320 | 1,769,000 | 1,923,273 | 2,091,000 | 2,346,402 | 2,633,000 | 2,735,505 | 2,842,000 | 3,118,089 | 3,421,000 | 3,620,200 | 3,831,000 | 4,028,889 | 4,237,000 | 4,356,000 | 4,550,000 |
| Pennsylvania | 6,302,000 | 6,950,168 | 7,665,000 | 8,175,500 | 8,720,000 | 9,164,187 | 9,631,000 | 9,764,574 | 9,900,000 | 10,194,616 | 10,498,000 | 10,900,773 | 11,319,000 | 11,554,059 | 11,794,000 | 11,828,948 | 11,864,000 | 11,872,997 | 11,882,000 | 12,079,853 | 12,281,000 | 12,489,726 | 12,702,000 | 12,851,125 | 13,002,000 | 13,002,000 | 13,117,000 |
| Rhode Island | 429,000 | 482,201 | 542,000 | 572,161 | 604,000 | 644,165 | 687,000 | 699,879 | 713,000 | 751,463 | 792,000 | 824,820 | 859,000 | 903,355 | 950,000 | 948,499 | 947,000 | 974,598 | 1,003,000 | 1,025,253 | 1,048,000 | 1,050,497 | 1,053,000 | 1,074,775 | 1,097,000 | 1,106,000 | 1,118,000 |
| South Carolina | 1,340,000 | 1,424,816 | 1,515,000 | 1,597,266 | 1,684,000 | 1,710,787 | 1,738,000 | 1,817,196 | 1,900,000 | 2,005,567 | 2,117,000 | 2,246,066 | 2,383,000 | 2,484,825 | 2,591,000 | 2,844,135 | 3,122,000 | 3,299,457 | 3,487,000 | 3,740,300 | 4,012,000 | 4,307,610 | 4,625,000 | 4,865,259 | 5,118,000 | 5,311,000 | 5,592,000 |
| South Dakota | 402,000 | 484,529 | 584,000 | 609,925 | 637,000 | 664,410 | 693,000 | 667,532 | 643,000 | 647,981 | 653,000 | 666,853 | 681,000 | 673,458 | 666,000 | 677,894 | 690,000 | 692,994 | 696,000 | 724,900 | 755,000 | 783,945 | 814,000 | 849,716 | 887,000 | 905,000 | 935,000 |
| Tennessee | 2,020,000 | 2,100,881 | 2,185,000 | 2,260,206 | 2,338,000 | 2,473,569 | 2,617,000 | 2,762,458 | 2,916,000 | 3,098,301 | 3,292,000 | 3,426,742 | 3,567,000 | 3,741,244 | 3,924,000 | 4,244,418 | 4,591,000 | 4,731,840 | 4,877,000 | 5,267,376 | 5,689,000 | 6,008,527 | 6,346,000 | 6,621,998 | 6,910,000 | 7,109,000 | 7,406,000 |
| Texas | 3,049,000 | 3,447,021 | 3,897,000 | 4,262,829 | 4,663,000 | 5,211,715 | 5,825,000 | 6,112,886 | 6,415,000 | 7,033,212 | 7,711,000 | 8,594,846 | 9,580,000 | 10,356,991 | 11,197,000 | 12,622,286 | 14,229,000 | 15,546,504 | 16,986,000 | 18,819,991 | 20,852,000 | 22,898,567 | 25,146,000 | 27,071,760 | 29,145,000 | 30,272,000 | 32,341,000 |
| Utah | 277,000 | 321,436 | 373,000 | 409,240 | 449,000 | 477,590 | 508,000 | 528,583 | 550,000 | 615,589 | 689,000 | 783,517 | 891,000 | 971,375 | 1,059,000 | 1,243,865 | 1,461,000 | 1,586,601 | 1,723,000 | 1,961,494 | 2,233,000 | 2,484,353 | 2,764,000 | 3,006,833 | 3,271,000 | 3,477,000 | 3,775,000 |
| Vermont | 344,000 | 349,949 | 356,000 | 353,994 | 352,000 | 352,000 | 352,000 | 355,483 | 359,000 | 368,378 | 378,000 | 383,953 | 390,000 | 416,125 | 444,000 | 476,323 | 511,000 | 536,370 | 563,000 | 585,548 | 609,000 | 617,441 | 626,000 | 634,443 | 643,000 | 646,000 | 653,000 |
| Virginia | 1,854,000 | 1,955,236 | 2,062,000 | 2,182,008 | 2,309,000 | 2,364,825 | 2,422,000 | 2,546,785 | 2,678,000 | 2,981,322 | 3,319,000 | 3,628,563 | 3,967,000 | 4,294,021 | 4,648,000 | 4,985,264 | 5,347,000 | 5,751,686 | 6,187,000 | 6,617,989 | 7,079,000 | 7,525,894 | 8,001,000 | 8,310,032 | 8,631,000 | 8,813,000 | 9,159,000 |
| Washington | 518,000 | 769,127 | 1,142,000 | 1,244,867 | 1,357,000 | 1,357,000 | 1,357,000 | 1,456,362 | 1,563,000 | 1,928,309 | 2,379,000 | 2,605,242 | 2,853,000 | 3,120,463 | 3,413,000 | 3,755,332 | 4,132,000 | 4,484,467 | 4,867,000 | 5,355,940 | 5,894,000 | 6,295,804 | 6,725,000 | 7,198,342 | 7,705,000 | 7,919,000 | 8,339,000 |
| West Virginia | 959,000 | 1,082,099 | 1,221,000 | 1,336,534 | 1,463,000 | 1,590,449 | 1,729,000 | 1,812,961 | 1,901,000 | 1,952,794 | 2,006,000 | 2,005,500 | 2,005,000 | 1,931,140 | 1,860,000 | 1,904,468 | 1,950,000 | 1,869,853 | 1,793,000 | 1,800,982 | 1,809,000 | 1,830,868 | 1,853,000 | 1,822,753 | 1,793,000 | 1,774,000 | 1,764,000 |
| Wisconsin | 2,069,000 | 2,197,509 | 2,334,000 | 2,478,525 | 2,632,000 | 2,781,267 | 2,939,000 | 3,036,870 | 3,138,000 | 3,283,143 | 3,435,000 | 3,684,443 | 3,952,000 | 4,178,509 | 4,418,000 | 4,559,727 | 4,706,000 | 4,798,099 | 4,892,000 | 5,122,567 | 5,364,000 | 5,523,139 | 5,687,000 | 5,789,084 | 5,893,000 | 5,959,000 | 6,071,000 |
| Wyoming | 93,000 | 116,525 | 146,000 | 168,297 | 194,000 | 208,926 | 225,000 | 237,645 | 251,000 | 269,796 | 290,000 | 309,354 | 330,000 | 330,998 | 332,000 | 395,019 | 470,000 | 461,931 | 454,000 | 473,578 | 494,000 | 527,841 | 564,000 | 570,463 | 577,000 | 583,000 | 599,000 |
A few patterns stand out immediately from this long-run view. Sun Belt states including Texas, Florida, Arizona, Georgia, and North Carolina show a consistent upward curve across the entire 155-year window, with growth accelerating rather than slowing after 1970. Rust Belt states including Michigan, Ohio, Illinois, and Pennsylvania show the opposite shape, rapid growth through the mid 20th century followed by a visible flattening from around 1980 onward. West Virginia is the clearest outlier in the table, peaking in the 1950s and trending gently downward or flat ever since, a trajectory unmatched by any other state over this period. California’s curve illustrates a third pattern entirely, extremely rapid growth from 1900 through the 1980s, followed by a much gentler incline in the 21st century as high housing costs have slowed the pace of in-migration even as the state remains the largest in the country.
USA Population Milestones
| Population milestone | Approximate year reached | Notes |
|---|---|---|
| 1 million | 1743 (colonial era) | Reached decades before independence, based on colonial population records |
| 5 million | 1800 | First federal census (1790) counted 3.9 million; 5 million reached within the following decade |
| 10 million | 1820 | Fueled by high colonial-era fertility and early immigration |
| 25 million | 1850 | Driven by Irish and German immigration waves |
| 50 million | 1880 | Post-Civil War industrial expansion and continued European immigration |
| 76 million | 1900 | First census of the 20th century |
| 100 million | 1915 | Reached amid peak Ellis Island-era immigration |
| 150 million | 1950 | Post-World War Two and early Baby Boom growth |
| 200 million | 1967 | Height of the Baby Boom generation’s childbearing years |
| 250 million | 1990 | Slower growth as fertility declined toward replacement level |
| 300 million | 2006 | Milestone widely covered in national media at the time |
| 330 million | 2020 | Recorded at the 2020 Decennial Census (331,449,281) |
| 340 million | 2025 (mid-year) | Crossed between the July 2024 estimate and the official July 2025 Vintage estimate of 341,784,857 |
| 342 million (approximate) | 2026 | Current estimate used as this article’s headline figure, projected forward from the Vintage 2025 count |
| 350 million (projected) | ~2032 to 2035 | Census Bureau medium variant projection |
| 400 million (projected) | ~2058 to 2060 | Reached only under higher immigration scenarios; the medium variant does not reach 400 million by 2060 |
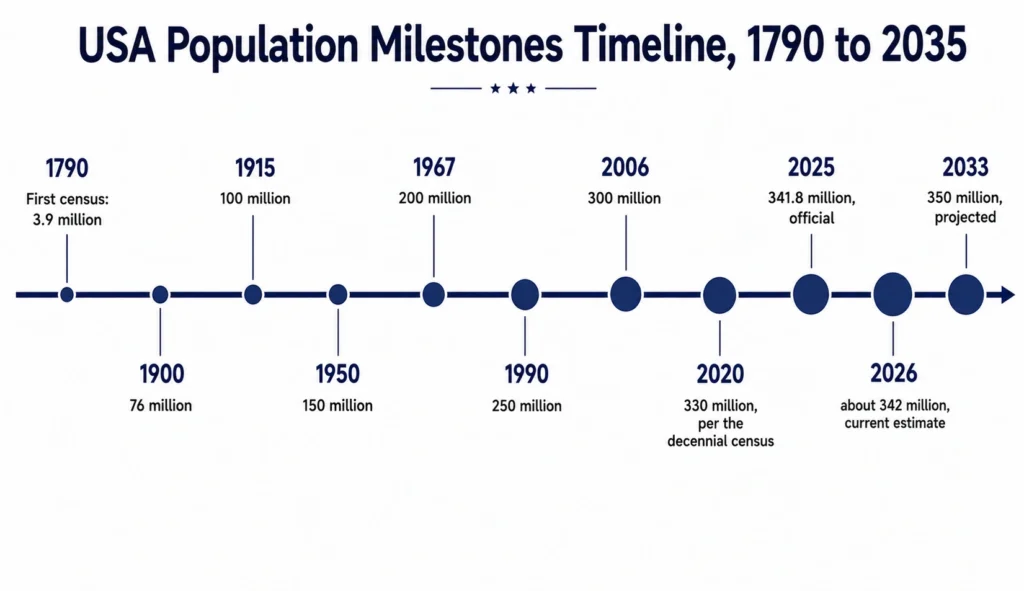
The pace between milestones has slowed considerably over the past century. The United States took only 15 years to add its second 50 million people after 1900, reaching 100 million by 1915, but it took 41 years to grow from 300 million in 2006 to a projected 350 million around the early 2030s.
US Population by State
Most Populous States
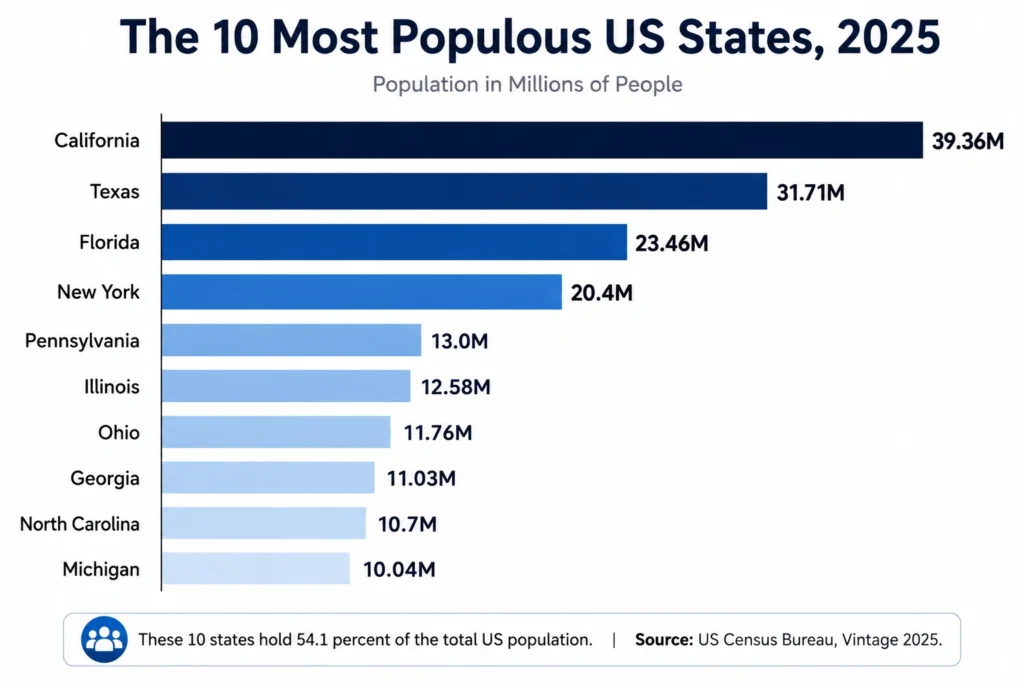
California, Texas, Florida, New York, and Pennsylvania together account for approximately 39 percent of the national population despite covering only a fraction of the country’s land area. California alone holds more than 11.5 percent of all US residents, roughly equivalent to the entire population of Canada packed into one state.
Least Populous States
Wyoming, Vermont, Alaska, North Dakota, and South Dakota have populations smaller than many individual American cities, with Wyoming’s entire state population smaller than that of a mid-sized metropolitan suburb.
Population by All 50 States
| Rank | State | Population (2026 est.) | Birth rate per 1,000 | Death rate per 1,000 |
|---|---|---|---|---|
| 1 | California | 39,355,300 | 10.8 | 7.0 |
| 2 | Texas | 31,709,800 | 12.5 | 7.2 |
| 3 | Florida | 23,462,500 | 10.5 | 10.8 |
| 4 | New York | 20,410,000 | 10.2 | 8.4 |
| 5 | Pennsylvania | 13,002,000 | 10.0 | 11.2 |
| 6 | Illinois | 12,582,000 | 11.0 | 9.5 |
| 7 | Ohio | 11,756,000 | 11.2 | 11.0 |
| 8 | Georgia | 11,029,000 | 12.0 | 8.8 |
| 9 | North Carolina | 10,699,000 | 11.5 | 9.5 |
| 10 | Michigan | 10,037,000 | 10.5 | 11.0 |
| 11 | New Jersey | 9,450,000 | 10.2 | 8.8 |
| 12 | Virginia | 8,850,000 | 11.5 | 8.5 |
| 13 | Washington | 7,962,000 | 11.2 | 8.0 |
| 14 | Arizona | 7,517,000 | 11.5 | 9.0 |
| 15 | Tennessee | 7,150,000 | 11.8 | 10.0 |
| 16 | Massachusetts | 6,980,000 | 9.5 | 9.5 |
| 17 | Indiana | 6,862,000 | 11.5 | 10.2 |
| 18 | Maryland | 6,280,000 | 11.5 | 8.2 |
| 19 | Missouri | 6,210,000 | 11.5 | 10.5 |
| 20 | Colorado | 5,990,000 | 11.0 | 7.8 |
| 21 | Wisconsin | 5,972,000 | 10.8 | 10.2 |
| 22 | Minnesota | 5,850,000 | 11.2 | 8.5 |
| 23 | South Carolina | 5,350,000 | 11.5 | 10.8 |
| 24 | Alabama | 5,039,000 | 12.0 | 11.5 |
| 25 | Louisiana | 4,680,000 | 12.5 | 10.5 |
| 26 | Kentucky | 4,585,000 | 11.5 | 11.5 |
| 27 | Oregon | 4,380,000 | 10.2 | 9.8 |
| 28 | Oklahoma | 4,020,000 | 13.0 | 10.2 |
| 29 | Connecticut | 3,629,000 | 9.5 | 10.0 |
| 30 | Utah | 3,520,000 | 14.5 | 6.0 |
| 31 | Nevada | 3,298,000 | 11.5 | 8.5 |
| 32 | Iowa | 3,225,000 | 11.8 | 9.5 |
| 33 | Arkansas | 3,060,000 | 12.2 | 11.0 |
| 34 | Kansas | 2,980,000 | 12.0 | 9.2 |
| 35 | Mississippi | 2,980,000 | 13.5 | 13.5 |
| 36 | New Mexico | 2,135,000 | 11.5 | 9.5 |
| 37 | Nebraska | 2,010,000 | 12.5 | 8.5 |
| 38 | Idaho | 1,979,000 | 12.5 | 8.0 |
| 39 | West Virginia | 1,770,000 | 10.5 | 15.5 |
| 40 | Hawaii | 1,467,000 | 10.8 | 7.8 |
| 41 | New Hampshire | 1,420,000 | 8.8 | 10.8 |
| 42 | Maine | 1,400,000 | 9.2 | 12.0 |
| 43 | Montana | 1,140,000 | 10.8 | 10.8 |
| 44 | Rhode Island | 1,108,000 | 9.5 | 10.0 |
| 45 | Delaware | 1,032,000 | 10.5 | 10.2 |
| 46 | South Dakota | 909,000 | 13.0 | 9.0 |
| 47 | North Dakota | 779,000 | 12.5 | 8.5 |
| 48 | Alaska | 733,000 | 13.0 | 7.5 |
| 49 | Vermont | 647,000 | 8.5 | 11.5 |
| 50 | Wyoming | 588,700 | 11.5 | 9.5 |
This full ranking makes the concentration of the national population much more visible. According to the Census Bureau’s Vintage 2025 release, the ten largest states, California, Texas, Florida, New York, Pennsylvania, Illinois, Ohio, Georgia, North Carolina, and Michigan, together hold approximately 184.8 million people, or about 54.1 percent of the entire US population, while the bottom ten states combined hold less than 3 percent.
Birth and death rates also track a clear regional pattern in this table, with younger Sun Belt and Mountain West states such as Utah, Texas, and Alaska posting the lowest death rates in the country, while older, slower-growing states such as West Virginia, Maine, and Pennsylvania post the highest.
Fastest Growing States
According to the Census Bureau’s Vintage 2025 estimates, the fastest-growing states by percentage between mid 2024 and mid 2025 were South Carolina (+1.5%), Idaho (+1.4%), North Carolina (+1.3%), Texas (+1.2%), and Utah (+1.0%). This list represents a meaningful shift from the pattern of the previous several years.
Florida, long a top three growth state, fell to eighth place in net domestic migration in 2025 as its inflows slowed sharply, from 310,892 in 2022 and 183,646 in 2023 down to just 22,517 in 2025, though the state still posted the nation’s highest level of net international migration at 178,674. Texas likewise led all states in net international migration at 167,475, followed by California at 109,278 and New York at 95,634.
States Losing Population
Only five states recorded outright population loss in the Vintage 2025 estimates, led by Vermont, Hawaii, and West Virginia. West Virginia’s decline remains structural, driven by a death rate that continues to exceed its birth rate and by sustained out-migration tied to the state’s shrinking coal sector.
Notably, the Census Bureau reported that growth slowed or decline accelerated in every state except Montana and West Virginia between the two most recent estimate years, underscoring how broadly the national migration slowdown has been felt.
US Population by Region
| Region | Population (approx.) | Share of US population | Growth trend |
|---|---|---|---|
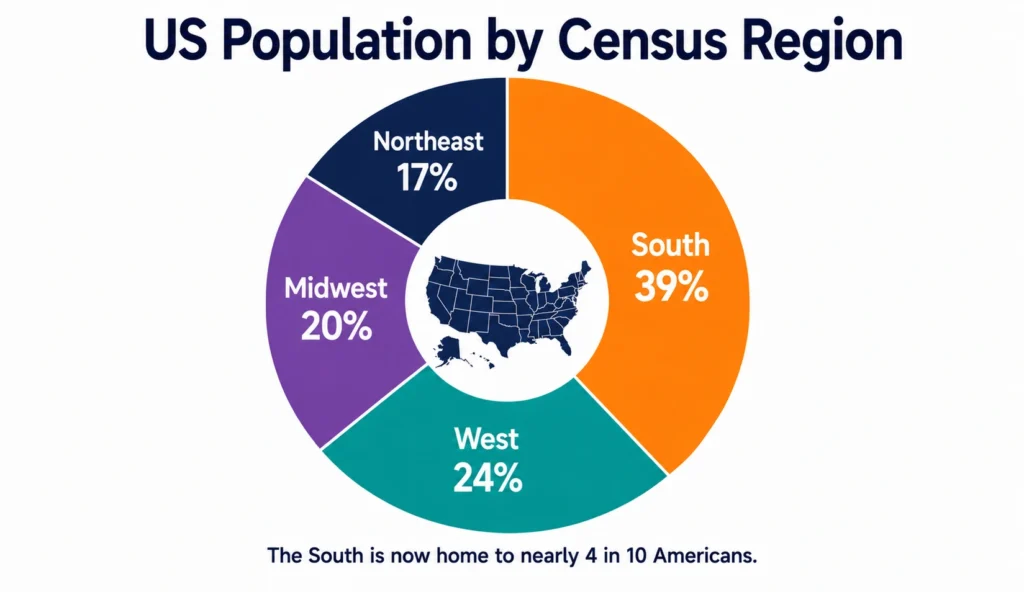
| South | ~132 million | ~39% | Fastest growing |
| West | ~80 million | ~24% | Growing, immigration driven |
| Midwest | ~69 million | ~20% | Slow or stagnant |
| Northeast | ~59 million | ~17% | Slowest, some decline |
Northeast
The Northeast remains the most densely populated and most urbanized US region, anchored by the New York and Philadelphia metropolitan areas, but it also carries the oldest average age structure and the slowest growth of any region.
Midwest
The Midwest’s population centers around Chicago and a cluster of mid-sized industrial metros. Growth has been slow for decades as manufacturing employment has declined relative to the Sun Belt.
South
The South is the largest and fastest growing US region, powered by Texas, Florida, Georgia, and North Carolina, and it now accounts for well over a third of the national population.
West
The West combines rapid growth in Sun Belt states such as Arizona, Nevada, Colorado, and Utah with a stagnating or declining population in high-cost coastal metros like San Francisco and Los Angeles.
US Population by Age
Age Group Breakdown
| Age group | Approximate share of population | Approximate population |
|---|---|---|
| Under 5 | 5.6% | ~19.0 million |
| 5 to 17 | 16.1% | ~54.7 million |
| 18 to 24 | 9.2% | ~31.3 million |
| 25 to 44 | 26.5% | ~90.1 million |
| 45 to 64 | 24.9% | ~84.7 million |
| 65 to 74 | 9.5% | ~32.3 million |
| 75 to 84 | 5.8% | ~19.7 million |
| 85 and older | 2.4% | ~8.2 million |
Median Age
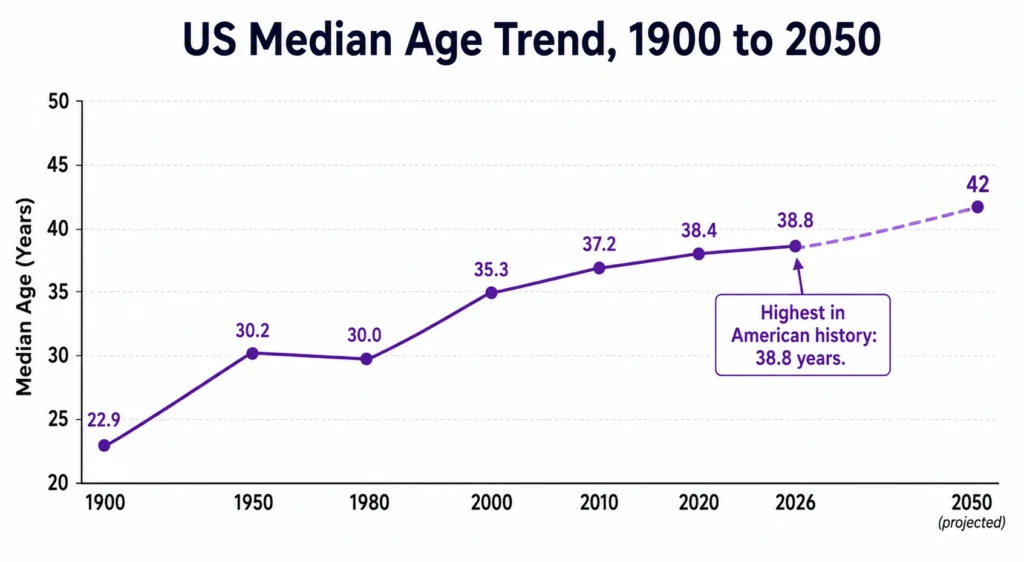
The national median age, estimated at approximately 38.7 to 38.9 years in 2026 depending on the source, is the highest in American history, up from 35.3 years in 2000. Median age varies widely by state, from around 31 to 32 in Utah to over 44 in Maine and Vermont.
Aging US Population
The population aged 65 and over has grown from about 12.4 percent in 2000 to roughly 17.5 percent in 2026 and is projected to reach 22 to 23 percent by 2050. By 2030, the entire baby boom cohort will have crossed into retirement age, placing sustained pressure on Social Security and Medicare financing as the ratio of working-age contributors to beneficiaries continues to shrink.
US Population by Sex and Gender
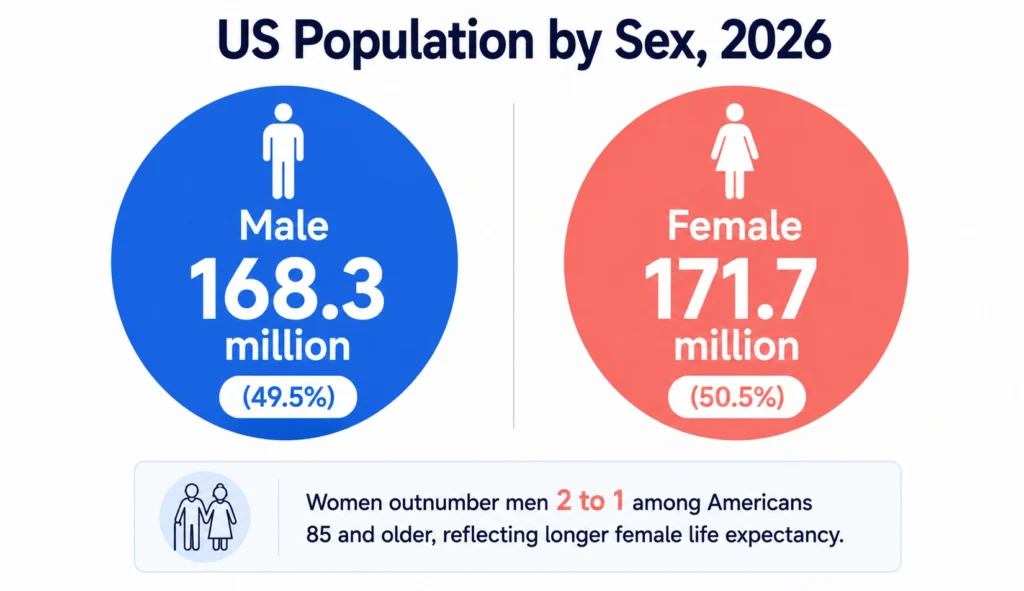
| Category | Male | Female |
|---|---|---|
| Total population | ~168.3 million (49.5%) | ~171.7 million (50.5%) |
| Under 18 | ~37.7 million | ~36.0 million |
| 18 to 64 | ~104.6 million | ~104.4 million |
| 65 and older | ~26.0 million | ~34.2 million |
Males outnumber females at birth and through childhood, but the ratio inverts in older age groups because of women’s longer average life expectancy, producing a growing female majority among the 65 and older population.
US Population by Race and Ethnicity
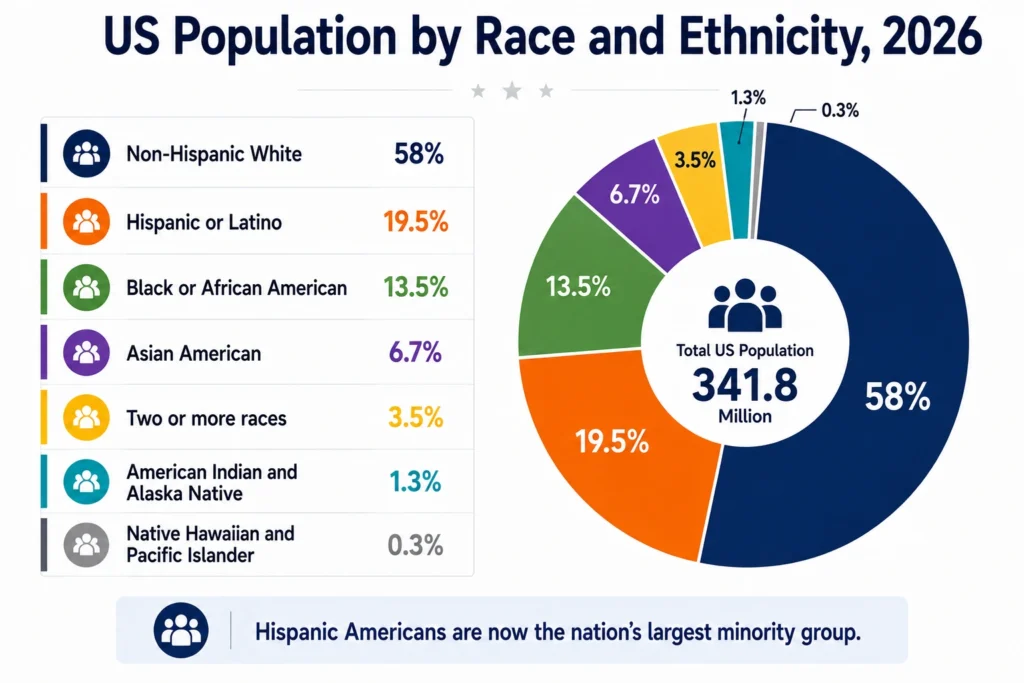
| Group | Approximate share of population | Approximate population |
|---|---|---|
| Non-Hispanic White | 57 to 59% | ~196 million |
| Hispanic or Latino (any race) | 19 to 20% | ~65 to 68 million |
| Black or African American | ~13.5% | ~46 million |
| Asian American | ~6.5 to 7% | ~22 to 24 million |
| Two or more races | ~3.5% | ~12 million |
| American Indian and Alaska Native | ~1.3% | ~4.4 million |
| Native Hawaiian and Other Pacific Islander | ~0.3% | ~1 million |
The 2020 Census marked the first time the non-Hispanic White population declined in absolute terms between decennial counts. Hispanic Americans are now the largest minority group nationally, concentrated heavily in Texas, California, Arizona, and New Mexico, while Asian American population growth has been driven largely by sustained skilled immigration from India, China, and Southeast Asia.
US Population by Immigration Status and Nativity
| Category | Estimated population |
|---|---|
| Foreign-born population | ~50.2 million |
| Naturalized US citizens | ~24 to 25 million |
| Lawful permanent residents and other legal noncitizens | ~11 to 13 million |
| Undocumented immigrants | ~11 to 12 million |
| Native born US population | ~290 to 293 million |
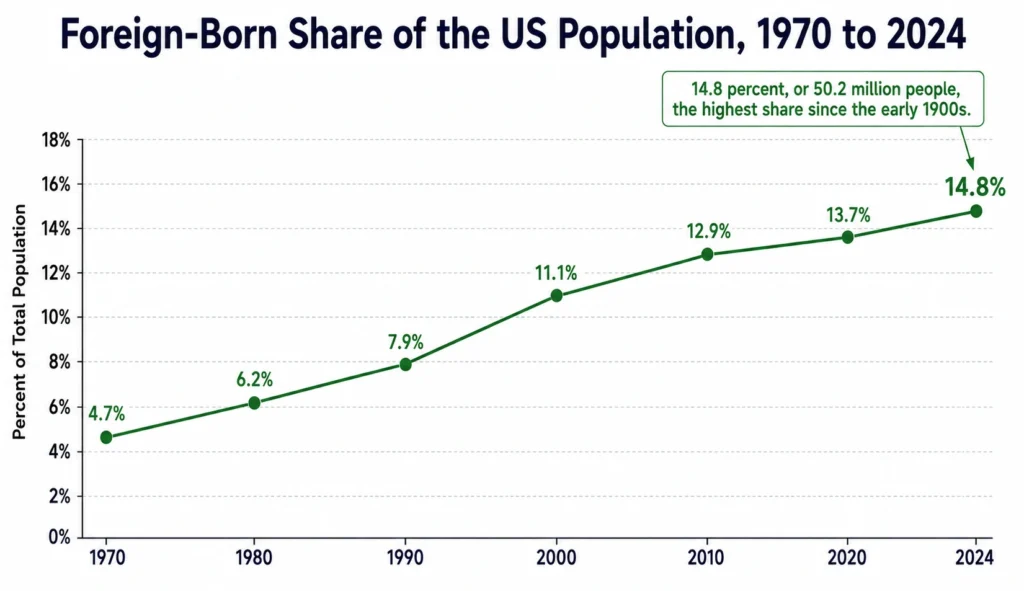
The foreign-born share of the population, now approximately 14.8 percent according to 2024 American Community Survey data, is the highest since the early 20th century. Leading source regions have shifted over the past several decades from Europe toward Latin America, particularly Mexico, El Salvador, Guatemala, and Honduras, and toward Asia, led by India, China, the Philippines, and Vietnam.
Top Countries of Birth Among the Foreign-Born Population
| Rank | Country of birth | Approximate share of foreign-born population |
|---|---|---|
| 1 | Mexico | ~23% |
| 2 | India | ~6% |
| 3 | China | ~5% |
| 4 | Philippines | ~4.5% |
| 5 | El Salvador | ~3% |
| 6 | Vietnam | ~3% |
| 7 | Cuba | ~2.5% |
| 8 | Dominican Republic | ~2.5% |
| 9 | Guatemala | ~2.5% |
| 10 | South Korea | ~2% |
US Population by Citizenship
Roughly 92 to 93 percent of US residents hold citizenship, split between the native born majority and about 24 to 25 million naturalized citizens. The remaining 7 to 8 percent are noncitizens, a category that spans lawful permanent residents, temporary visa holders, and undocumented residents. Citizenship concentration by state closely tracks immigrant settlement patterns, with California, Texas, Florida, and New York holding the largest naturalized citizen populations in absolute terms.
US Population by Language
| Language spoken at home | Approximate share of population aged 5+ |
|---|---|
| English only | ~78% |
| Spanish | ~13.5% |
| Chinese (all varieties) | ~1.1% |
| Tagalog | ~0.6% |
| Vietnamese | ~0.5% |
| Arabic | ~0.4% |
| French | ~0.4% |
| Korean | ~0.4% |
Roughly 22 percent of Americans aged five and older speak a language other than English at home, and a subset of that group, concentrated among recent immigrants and older adults, has limited English proficiency, a factor with direct implications for healthcare access and school district resource planning.
US Population by Religion
Religion is measured through surveys such as Pew Research Center studies rather than the decennial census, so figures below are survey-based estimates rather than official counts.
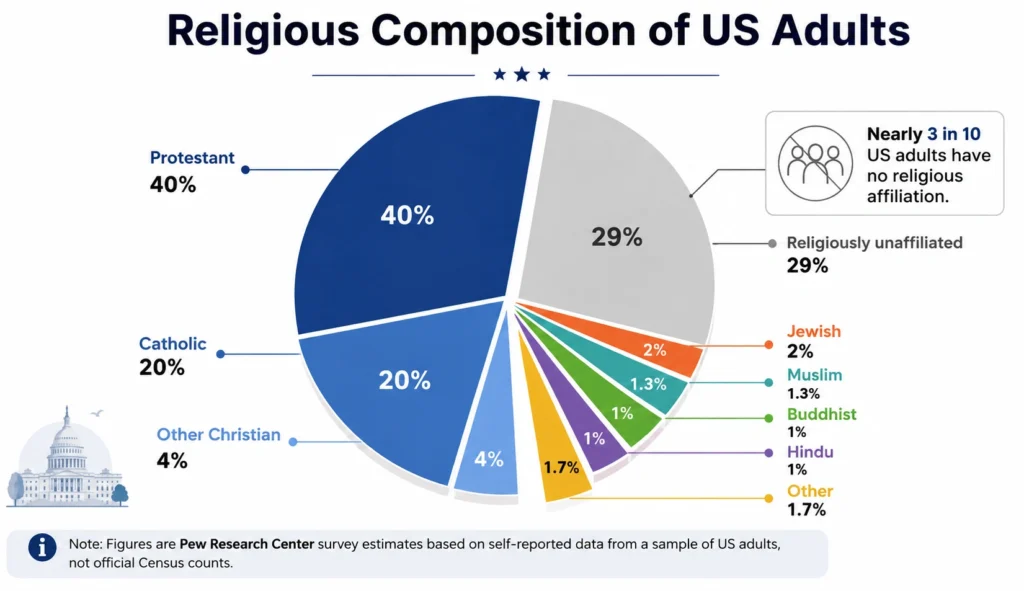
| Religious group | Approximate share of adult population |
|---|---|
| Christian (all denominations) | ~63 to 65% |
| Protestant | ~40% |
| Catholic | ~20% |
| Other Christian | ~3 to 5% |
| Jewish | ~2% |
| Muslim | ~1.3% |
| Buddhist | ~1% |
| Hindu | ~1% |
| Religiously unaffiliated | ~28 to 30% |
The religiously unaffiliated share, often called the “nones,” has grown steadily over the past two decades and now represents nearly three in ten American adults.
US Population by Household Structure
| Household type | Approximate share of all households |
|---|---|
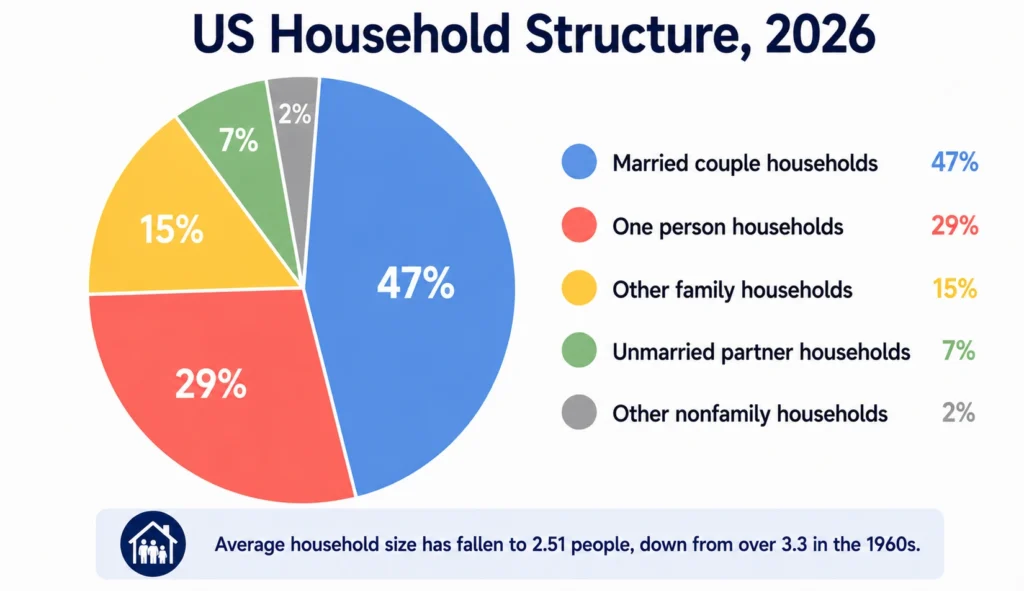
| Married couple households | ~47% |
| One person households | ~29% |
| Other family households (single parent, etc.) | ~15% |
| Unmarried partner households | ~7% |
| Other nonfamily households | ~2% |
Average household size stands at approximately 2.51 people, down from over 3.3 in the 1960s, reflecting smaller family sizes, delayed marriage, and a rising share of people living alone, particularly among older adults.
US Population by Marital Status
| Marital status (population 15 and older) | Approximate share |
|---|---|
| Married | ~48% |
| Never married | ~33% |
| Divorced | ~11% |
| Widowed | ~6% |
| Separated | ~2% |
Median age at first marriage has risen steadily, now standing at approximately 30.5 years for men and 28.6 years for women, up from the low twenties in the mid-20th century.
US Population by Fertility and Births
| Metric | 2026 figure |
|---|---|
| Annual births | ~3.6 million |
| Crude birth rate | ~10.8 per 1,000 |
| Total fertility rate | ~1.62 |
| Teen birth rate (ages 15 to 19) | ~13 per 1,000 |
| Average age at first birth | ~27.5 years |
Fertility varies significantly by state and by race and ethnicity, with Hispanic and some immigrant populations recording higher-than-average fertility that helps offset lower fertility among the native born non-Hispanic White population.
US Population by Mortality and Life Expectancy
| Metric | 2026 figure |
|---|---|
| Annual deaths | ~3.1 million |
| Crude death rate | ~9.1 per 1,000 |
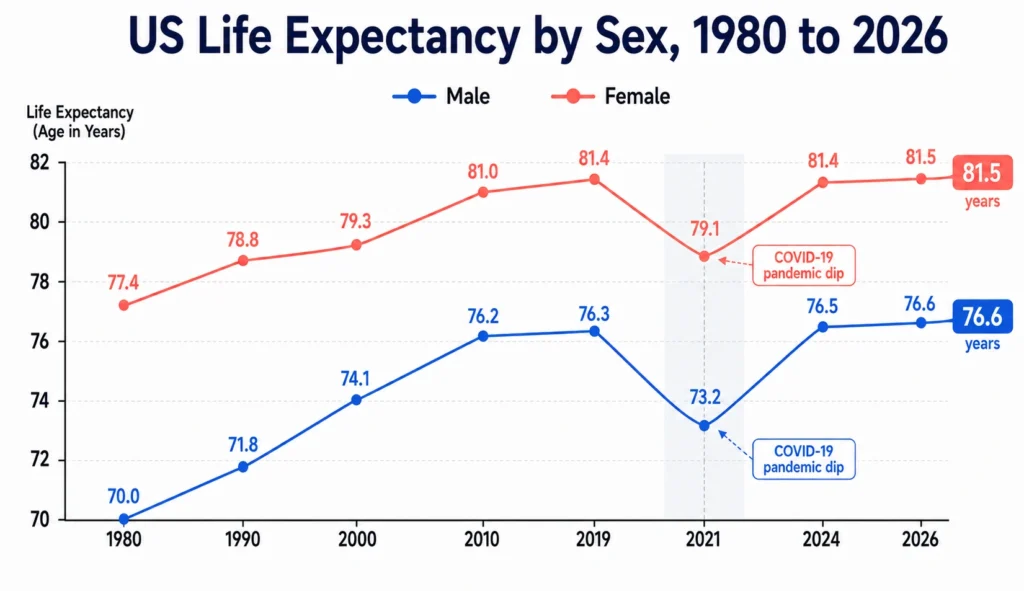
| Life expectancy at birth (both sexes) | ~79.0 years |
| Life expectancy, male | ~76.5 years |
| Life expectancy, female | ~81.4 years |
| Infant mortality rate | ~5.4 per 1,000 live births |
Heart disease, cancer, and unintentional injuries, including drug overdoses, remain the leading causes of death nationally. The opioid crisis, driven increasingly by synthetic fentanyl since around 2016, has been a major driver of premature mortality in states such as West Virginia, Ohio, and Pennsylvania.
US Population Growth & Key Driving Factors
| Growth driver | Approximate annual contribution |
|---|---|
| Births | ~3.6 million |
| Deaths | ~3.1 million |
| Natural increase | ~500,000 |
| Net international migration | ~1.3 million (2024 to 2025), projected to fall to roughly 321,000 in 2026 |
| Total annual population growth | ~1.1 to 1.5 million |
Net international migration has become the dominant driver of US population growth as fertility has fallen closer to, and in some years below, the level needed to offset the natural increase gap alone.
US Population by Urban and Rural Areas
Approximately 83 percent of Americans live in urban areas, one of the higher urbanization rates among large, geographically diverse countries. The remaining rural population, concentrated in the Great Plains, Appalachia, and parts of the rural South and Mountain West, continues to shrink as young residents move toward metropolitan job markets, leaving many rural counties with older, smaller populations and strained local services.
US Population by Metropolitan Area
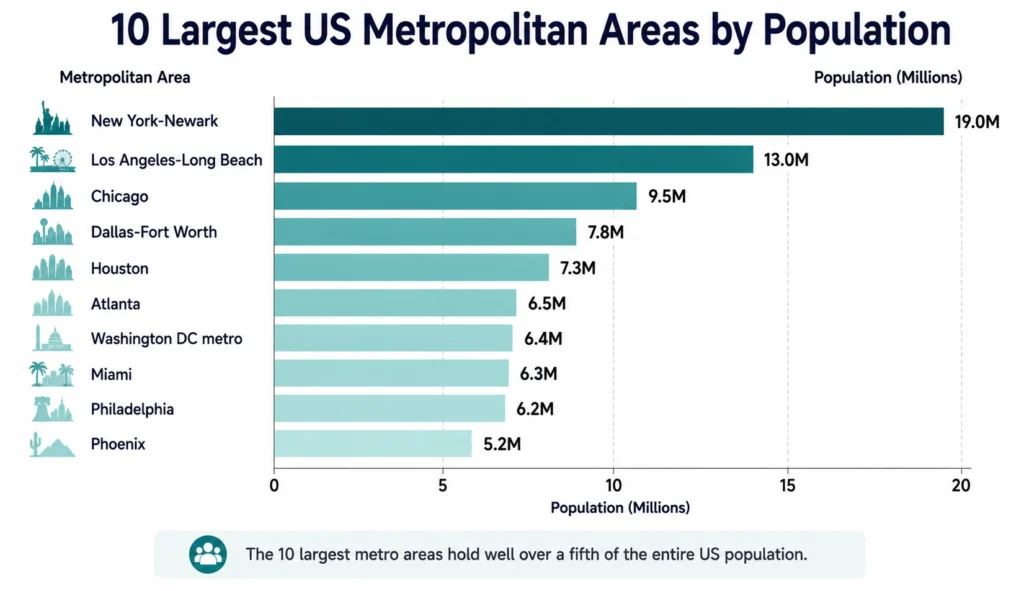
| Rank | Metropolitan area | Approximate population |
|---|---|---|
| 1 | New York-Newark | ~19.0 million |
| 2 | Los Angeles-Long Beach | ~13.0 million |
| 3 | Chicago | ~9.5 million |
| 4 | Dallas-Fort Worth | ~7.8 million |
| 5 | Houston | ~7.3 million |
| 6 | Atlanta | ~6.5 million |
| 7 | Washington DC metro | ~6.4 million |
| 8 | Miami | ~6.3 million |
| 9 | Philadelphia | ~6.2 million |
| 10 | Phoenix | ~5.2 million |
Austin, Nashville, Raleigh, Charlotte, and Boise saw especially fast growth from 2020 to 2023 as remote work enabled relocation away from expensive coastal gateway cities, though housing costs in these destination metros have since risen sharply in response.
Biggest US Cities by Population
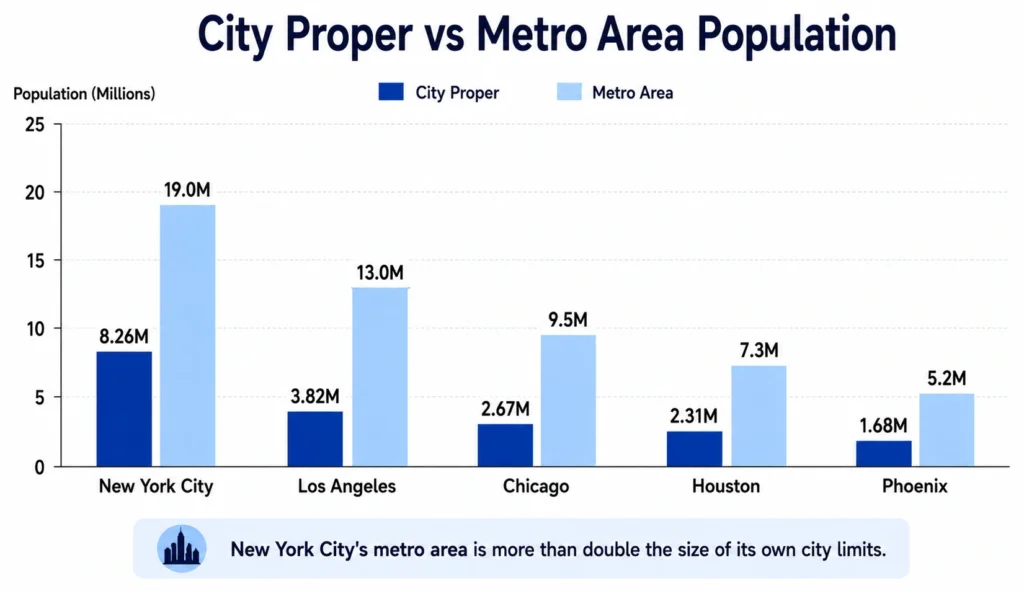
The table above measures entire metropolitan regions, which can span multiple counties and even cross state lines. The table below instead ranks individual cities by their own municipal boundaries, known as city proper population, alongside the population of the broader metro area each city anchors.
| Rank | City | State | City proper population (approx.) | Metro area population (approx.) |
|---|---|---|---|---|
| 1 | New York City | New York | ~8,258,000 | ~19,000,000 |
| 2 | Los Angeles | California | ~3,820,000 | ~13,000,000 |
| 3 | Chicago | Illinois | ~2,665,000 | ~9,500,000 |
| 4 | Houston | Texas | ~2,314,000 | ~7,300,000 |
| 5 | Phoenix | Arizona | ~1,680,000 | ~5,200,000 |
| 6 | Philadelphia | Pennsylvania | ~1,573,000 | ~6,200,000 |
| 7 | San Antonio | Texas | ~1,510,000 | ~2,700,000 |
| 8 | San Diego | California | ~1,388,000 | ~3,300,000 |
| 9 | Dallas | Texas | ~1,304,000 | ~7,800,000 |
| 10 | Austin | Texas | ~980,000 | ~2,400,000 |
| 11 | Jacksonville | Florida | ~972,000 | ~1,700,000 |
| 12 | Fort Worth | Texas | ~958,000 | (part of Dallas-Fort Worth) |
| 13 | San Jose | California | ~975,000 | ~2,000,000 |
| 14 | Columbus | Ohio | ~913,000 | ~2,180,000 |
| 15 | Charlotte | North Carolina | ~897,000 | ~2,800,000 |
| 16 | Indianapolis | Indiana | ~882,000 | ~2,100,000 |
| 17 | San Francisco | California | ~808,000 | ~4,600,000 |
| 18 | Seattle | Washington | ~755,000 | ~4,000,000 |
| 19 | Denver | Colorado | ~715,000 | ~3,000,000 |
| 20 | Washington | District of Columbia | ~690,000 | ~6,400,000 |
City proper population and metro area population tell very different stories. New York City alone holds nearly 8.3 million residents within its five boroughs, but its full metropolitan area stretches across parts of New Jersey, Connecticut, and Pennsylvania to reach roughly 19 million. Texas cities show the opposite pattern in several cases; San Antonio’s city proper population of 1.51 million is larger than its metro area implies relative to peers, reflecting the city’s unusually large land area and extensive annexation history, while Dallas and Fort Worth are individually smaller cities that combine into one of the largest metro areas in the country. Sun Belt cities dominate the list of fastest municipal growth, with Austin, Phoenix, San Antonio, and Fort Worth all adding residents at rates well above the national average over the past two decades, while older Northeastern and Midwestern cities such as Philadelphia and Chicago have grown far more slowly or, in some periods, lost city proper population even while their surrounding suburbs continued to expand.
US Population Density
| Category | Detail |
|---|---|
| National average density | ~37 to 38 people per km2 |
| Most densely populated state | New Jersey (~1,260 people per km2) |
| Least densely populated state | Alaska (~0.5 people per km2) |
| Most densely populated large city | New York City (~11,000+ people per km2) |
Population density varies enormously across the country because of differences in geography, climate, historical settlement patterns, and access to transportation infrastructure and employment centers.
US Population by Education
| Educational attainment (population 25+) | Approximate share |
|---|---|
| High school diploma or higher | ~91% |
| Some college, no degree | ~16% |
| Associate degree | ~10% |
| Bachelor’s degree | ~23% |
| Graduate or professional degree | ~14% |
Educational attainment correlates closely with both income and fertility, with higher educational attainment generally associated with delayed childbearing and lower completed fertility.
US Population by Employment
| Labor force metric | Approximate figure |
|---|---|
| Civilian labor force | ~168 million |
| Employed population | ~161 million |
| Unemployment rate | ~4.2% |
| Labor force participation rate | ~62.5% |
Healthcare, technology, retail, and professional services remain the largest employment sectors nationally, with healthcare employment growing fastest in response to the aging population described in Section 6.
US Population by Income
| Income metric | Approximate figure |
|---|---|
| Median household income | ~$81,000 |
| Per capita income | ~$44,000 |
| Poverty rate | ~11.5% |
| Child poverty rate | ~15% |
Income and poverty rates vary substantially by state and region, with the Southeast and parts of Appalachia recording the highest poverty rates and the Northeast corridor and parts of the West Coast recording the highest median incomes alongside the highest costs of living.
US Population and Housing
| Housing metric | Approximate figure |
|---|---|
| Total housing units | ~146 million |
| Homeownership rate | ~65% |
| Renter-occupied share | ~35% |
| Average household size | ~2.51 |
Housing demand continues to outpace supply in many fast-growing Sun Belt metros, pushing prices upward even in historically affordable markets such as Austin and Nashville.
US Population by Geographic Mobility
Roughly 8 to 9 percent of Americans move residences in a given year, the large majority within the same state. Interstate migration favors Texas, Florida, North Carolina, and Georgia as destination states, while California, New York, and Illinois record the largest net domestic out-migration. Employment, housing costs, retirement, and family considerations remain the leading reasons Americans cite for moving.
US Population by Generation
Generation boundaries below follow the widely used Pew Research Center framework rather than any official Census Bureau classification.
| Generation | Birth years | Approximate current age range | Approximate share of US population |
|---|---|---|---|
| Silent Generation | 1928 to 1945 | 81 to 98 | ~2% |
| Baby Boomers | 1946 to 1964 | 62 to 80 | ~19% |
| Generation X | 1965 to 1980 | 46 to 61 | ~19% |
| Millennials | 1981 to 1996 | 30 to 45 | ~22% |
| Generation Z | 1997 to 2012 | 14 to 29 | ~20% |
| Generation Alpha | 2013 to 2025 | 1 to 13 | ~16% |
US Population by Age Dependency
| Dependency metric | 2026 figure |
|---|---|
| Child dependency ratio (under 18 per 100 working age) | ~33 |
| Old age dependency ratio (65+ per 100 working age) | ~28 |
| Total dependency ratio | ~61 |
The old age dependency ratio is projected to climb steadily through 2050 as the full baby boom cohort ages into retirement, placing sustained pressure on Social Security and Medicare financing structures.
State Population Deep Dive Examples
California
California remains the most populous state at 39,355,309 residents as of the Census Bureau’s Vintage 2025 estimate, a population that has held essentially flat in recent years despite continued net domestic out-migration, a trend offset by continued international immigration and natural increase. The state is already majority minority, with Hispanic residents forming the largest single group.
Texas
Texas has grown from about 21 million in 2000 to 31,709,821 residents as of the Vintage 2025 estimate, an increase of roughly 50 percent in 25 years, driven by energy sector jobs, a diversifying technology economy centered on Austin and Dallas-Fort Worth, relatively affordable housing, and sustained migration from both other states and abroad. Texas was also the fourth fastest-growing state by percentage in the most recent estimate year, at 1.2 percent.
Florida
Florida has grown from about 16 million in 2000 to 23,462,518 residents as of the Vintage 2025 estimate, driven by retirement migration, international immigration from Cuba, Venezuela, and Haiti, and a wave of remote worker relocation following the COVID-19 pandemic. Florida’s elevated death rate of 10.8 per 1,000 reflects its older-than-average age structure. Notably, Florida’s net domestic migration has slowed sharply in the most recent data, falling from a peak of over 310,000 in 2022 to just 22,517 in the year ending mid 2025, though the state still leads the nation in net international migration.
New York
New York’s population has grown far more slowly than the national average in recent decades and has recorded net domestic out-migration for years, as high housing costs and taxes push residents toward Florida, Texas, and other lower-cost states. The state nonetheless remains a major immigration gateway, with international arrivals continuing to offset much of the domestic outflow, particularly within New York City itself.
Pennsylvania
Pennsylvania’s population growth has been essentially flat for two decades, reflecting an older age structure, a shrinking industrial employment base outside the Philadelphia and Pittsburgh metro areas, and limited net migration in either direction. The state’s death rate of 11.2 per 1,000 is among the highest of any large state, a direct reflection of its older population.
Georgia
Georgia has transformed from a largely rural Southern state into one of the country’s most dynamic economies, anchored by metro Atlanta’s role as a corporate headquarters hub for companies including Delta Air Lines, Coca-Cola, and CNN. This corporate concentration has pulled in young professionals from across the country and abroad, helping push the state’s population above 11 million.
The Sun Belt Surge and the Rust Belt Contrast
The defining regional story in American population geography over the past two decades has been the rise of the Sun Belt, a broad arc running from Virginia through the Carolinas, Georgia, Florida, Tennessee, and Texas, then up through Arizona, Nevada, Colorado, and Utah. This growth reflects a combination of warmer climates, lower costs of living, business-friendly tax and regulatory environments, and sustained inbound migration from both other US states and abroad.
The Rust Belt tells the opposite story. States including Michigan, Illinois, Ohio, and parts of Pennsylvania and New York have faced demographic stagnation or outright decline as manufacturing employment has eroded and younger residents have relocated toward Sun Belt job markets. West Virginia represents the most severe case, with more deaths than births each year, a birth rate of only 10.5 per 1,000 against a death rate of 15.5 per 1,000, and decades of sustained out-migration tied to the collapse of the coal industry and the ongoing opioid crisis.
| Indicator | Sun Belt states (example: Texas) | Rust Belt states (example: West Virginia) |
|---|---|---|
| Population growth since 2000 | +45 to 50% | Flat to negative |
| Birth rate per 1,000 | ~12.5 | ~10.5 |
| Death rate per 1,000 | ~7.2 | ~15.5 |
| Median age | Younger than national average | Older than national average |
| Primary growth driver | Domestic and international migration | None, net population loss |
US Population Compared With Other Countries
| Rank | Country | Approximate population (2026) |
|---|---|---|
| 1 | India | ~1.46 billion |
| 2 | China | ~1.41 billion |
| 3 | United States | ~342 million |
| 4 | Indonesia | ~280 million |
| 5 | Pakistan | ~250 million |
| 6 | Nigeria | ~235 million |
| 7 | Brazil | ~220 million |
| 8 | Bangladesh | ~175 million |
| 9 | Russia | ~144 million |
| 10 | Mexico | ~130 million |
The United States remains the only country among the world’s five most populous nations classified as a high-income, developed economy, giving it a distinct combination of scale and per capita wealth unmatched by China or India.
US Population Projections
| Projection year | Low immigration scenario | Medium scenario | High immigration scenario |
|---|---|---|---|
| 2030 | ~347 million | ~349 million | ~352 million |
| 2040 | ~355 million | ~362 million | ~372 million |
| 2050 | ~360 million | ~372 million | ~390 million |
| 2060 | ~355 million | ~370 million | ~404 million |
Under the Census Bureau’s medium scenario, the population is projected to reach approximately 370 million by 2060. Texas is projected to surpass New York and approach California’s population within this window, while the country as a whole is expected to become majority minority sometime between 2040 and 2050.
World Population Projections, 2030 to 2100
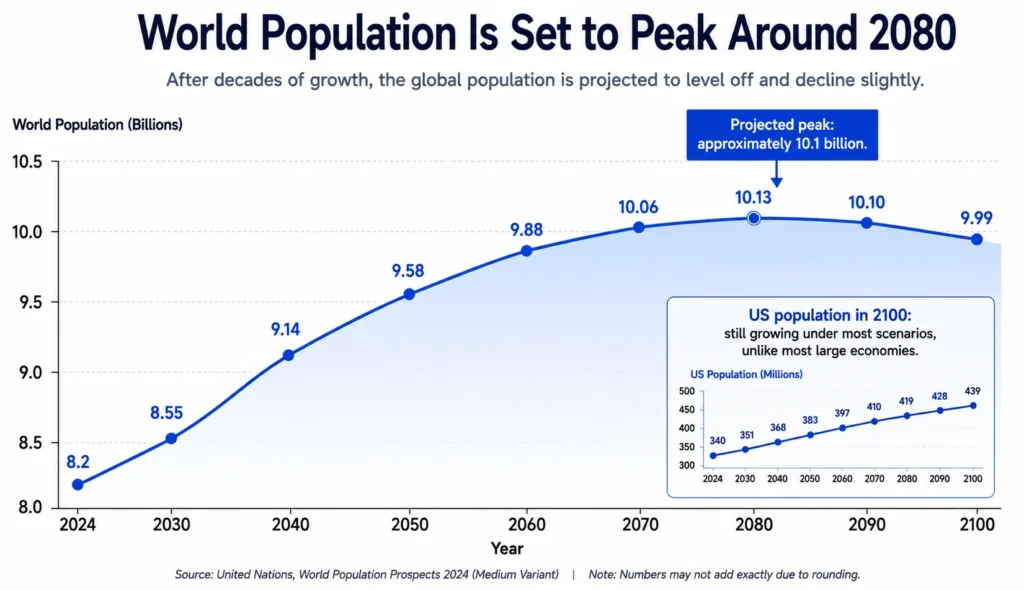
Placing the United States within the broader global trajectory helps explain many of the trends described throughout this article. The table below models the world population, growth rate, median age, fertility rate, and population density in five-year increments from 2030 through 2100, based on a medium variant style trajectory consistent with United Nations World Population Prospects modeling. As with the state-level projections above, figures beyond the near term are illustrative modeled estimates rather than official published counts, since long-range demographic projections are revised regularly as new fertility, mortality, and migration data become available.
| Year | World Population (millions) | Annual Growth Rate | Median Age | Fertility Rate | Population Density (per km2) |
|---|---|---|---|---|---|
| 2030 | 8,548 | 0.70% | 32.7 | 2.14 | 65.8 |
| 2035 | 8,862 | 0.72% | 33.6 | 2.08 | 68.2 |
| 2040 | 9,137 | 0.61% | 34.5 | 2.03 | 70.3 |
| 2045 | 9,372 | 0.51% | 35.4 | 1.99 | 72.1 |
| 2050 | 9,575 | 0.43% | 36.2 | 1.95 | 73.7 |
| 2055 | 9,741 | 0.34% | 37.0 | 1.92 | 74.9 |
| 2060 | 9,878 | 0.28% | 37.8 | 1.89 | 76.0 |
| 2065 | 9,985 | 0.22% | 38.6 | 1.87 | 76.8 |
| 2070 | 10,061 | 0.15% | 39.3 | 1.85 | 77.4 |
| 2075 | 10,109 | 0.10% | 40.0 | 1.83 | 77.8 |
| 2080 | 10,131 | 0.04% | 40.6 | 1.82 | 77.9 |
| 2085 | 10,126 | -0.01% | 41.1 | 1.81 | 77.9 |
| 2090 | 10,098 | -0.06% | 41.6 | 1.8 | 77.7 |
| 2095 | 10,052 | -0.09% | 42.0 | 1.8 | 77.3 |
| 2100 | 9,987 | -0.13% | 42.4 | 1.8 | 76.8 |
The global population is projected to keep growing through roughly the 2080s before leveling off and beginning a very gradual decline, a pattern known among demographers as approaching peak human population. The annual growth rate, which still stood above 1 percent as recently as the early 2010s, is projected to fall below 0.1 percent by the 2070s and turn slightly negative by the 2080s or 2090s. Global median age is projected to climb from the low 30s in 2030 to over 42 by 2100, a trajectory that mirrors, and in some regions outpaces, the aging trend already visible in the United States.
Global fertility is projected to continue drifting down from just above replacement level in 2030 toward roughly 1.8 children per woman by the end of the century, a level that would leave most of the world, not just wealthy nations, below the replacement threshold. Against this backdrop, continued US population growth through immigration stands out as increasingly unusual among large economies, most of which are expected to see outright population decline well before 2100.
Some of the Key Major Demographic Trends Shaping the US
- Population aging as the full baby boom cohort crosses into retirement age by 2030
- Fertility decline toward and occasionally below the levels seen among developed peer nations
- Increasing racial and ethnic diversity, with the country approaching majority minority status
- Growth of the multiracial population, especially among younger generations
- Continued urban concentration alongside rural population decline
- Sustained domestic migration toward the South and West Sun Belt states
- International migration remaining the primary lever for future population growth
- Rapid growth of the population aged 65 and older relative to the working-age population
- Shifting household structures, including more one-person households and delayed marriage
- Widening geographic imbalance between fast-growing Sun Belt states and slower-growing Rust Belt and Northeastern states
Economic Impact of US Population Trends
Population aging directly strains Social Security and Medicare financing as the ratio of working-age contributors to retirees continues to narrow. At the same time, sustained population growth in Sun Belt metros drives housing demand, infrastructure spending, and consumer market expansion in those regions. Immigration, both skilled and unskilled, continues to fill critical gaps in the labor force, particularly in healthcare, agriculture, construction, and technology sectors facing domestic worker shortages.
Labor Supply and the Working Age Population
The working-age population, generally defined as ages 18 to 64, continues to grow more slowly than the retirement-age population, tightening labor markets in sectors that rely heavily on domestic workers. Immigration has become an increasingly important source of labor force growth, particularly in healthcare support roles, construction, agriculture, and hospitality, where domestic labor supply alone has not kept pace with demand.
Consumer Market and Housing Demand
A population of approximately 342 million, spread across a wide range of income levels and regional cost structures, represents one of the largest consumer markets in the world. Population growth in Sun Belt metros continues to drive new housing construction, retail expansion, and infrastructure investment, while slower-growing or shrinking Rust Belt metros face the opposite challenge of maintaining infrastructure built for a larger population than currently resides there.
Social Security and Medicare
The old age dependency ratio described in Section 27 is the single most consequential figure for federal entitlement financing. As the ratio of working-age contributors to Social Security and Medicare beneficiaries continues to narrow through 2030 and beyond, policymakers face growing pressure to adjust benefit formulas, payroll tax rates, or eligibility ages to keep both programs solvent over the long term.
Social Impact of Population Changes
Family structures continue to diversify, with smaller households, delayed marriage, and rising numbers of single-parent and one-person households reshaping demand for housing types and community services. Aging communities, particularly in rural areas and parts of the Rust Belt, face shrinking tax bases and declining access to healthcare and education services as younger residents relocate elsewhere.
Immigration continues to reshape the cultural and linguistic makeup of many American communities, particularly in gateway metros such as Los Angeles, Miami, New York, and Houston, where foreign-born residents make up a substantial share of the local population. Rural communities, by contrast, often see the opposite dynamic, with population loss concentrated among younger residents while the remaining population skews older and more homogenous.
Political and Governmental Implications
Congressional apportionment shifts steadily toward Sun Belt states with each decennial census, as Texas, Florida, and other fast-growing states gain House seats and Electoral College votes at the expense of slower-growing Northeastern and Midwestern states. Texas gained two seats after the 2020 Census, while New York and California each lost one, a trend expected to continue and likely intensify following the 2030 Census.
Key Challenges Facing the US Population
- Population aging and rising elderly dependency
- Below replacement fertility in most states
- Housing affordability pressures in fast-growing metros
- Rising healthcare costs tied to an aging population
- Regional population decline in parts of the Rust Belt and rural America
- Labor shortages in healthcare, construction, and skilled trades
- Ongoing political disagreement over immigration policy and enforcement
- Aging urban infrastructure in older Northeastern cities
- Continued rural depopulation and service loss
- Persistent income and wealth inequality across regions
Frequently Asked Questions About US Population
What is the current US population?
The United States population is approximately 342 million people as of 2026, based on the Census Bureau’s Vintage 2025 estimate of 341,784,857 as of July 1, 2025, projected forward.
How many people live in the United States?
Approximately 342 million people live in the United States, making it the world’s third most populous nation.
What is the US population by state?
California leads with 39,355,309 residents, followed by Texas at 31,709,821, Florida at 23,462,518, New York at approximately 20.4 million, and Pennsylvania at approximately 13.0 million, all per the Census Bureau’s Vintage 2025 estimates.
Which US state has the largest population?
California has the largest population, at 39,355,309 residents as of the Census Bureau’s Vintage 2025 estimate.
Which US state has the smallest population?
Wyoming has the smallest population, at approximately 584,000 residents.
What is the fastest-growing US state?
By percentage growth, South Carolina led the nation in the most recent Census Bureau estimates at 1.5 percent, followed by Idaho, North Carolina, Texas, and Utah. Texas continues to add the most people in absolute numbers of any state.
What is the US population growth rate?
The national growth rate is approximately 0.5 to 0.7 percent per year, driven primarily by net international migration.
What percentage of the US population is foreign-born?
Approximately 14.8 percent of the US population, or about 50.2 million people, is foreign-born, according to 2024 American Community Survey data.
What is the median age in the US?
The median age is approximately 38.7 to 38.9 years, the highest in American history.
What will the US population be in 2050?
Census Bureau projections estimate the population will reach approximately 360 to 390 million by 2050, depending on future immigration levels.
Sources
- US Census Bureau, Population Estimates Program and 2024 Vintage Estimates
- US Census Bureau, 2020 Decennial Census and historical decennial census data
- US Census Bureau, 2023 National Population Projections
- National Center for Health Statistics (NCHS), Vital Statistics Reports
- Congressional Budget Office (CBO), Demographic Outlook reports
- Pew Research Center, religion and generational demographic studies
- American Community Survey (ACS), household, income, and education data