Key Findings
- Generation Alpha numbers about 51.2 million (15%) in a Census-based tally, with 2013 as the start year.
- The UN counts 47.1 million Alpha plus 5.5 million Beta (52.7 million together) for July 2026.
- The under-18 population (72.0 million) fell 1.8 million, or 2.4%, between 2020 and 2025.
- Only the South saw an increase in children (+1.1%); the West fell 5.7%.
- The fertility rate was 1.63 in 2024, down from 2.11 in 2001.
- The Census Bureau projects the under-18 share to fall from 21% in 2025 to 18% in 2050.
- The oldest Alphas turn 18 in 2031.
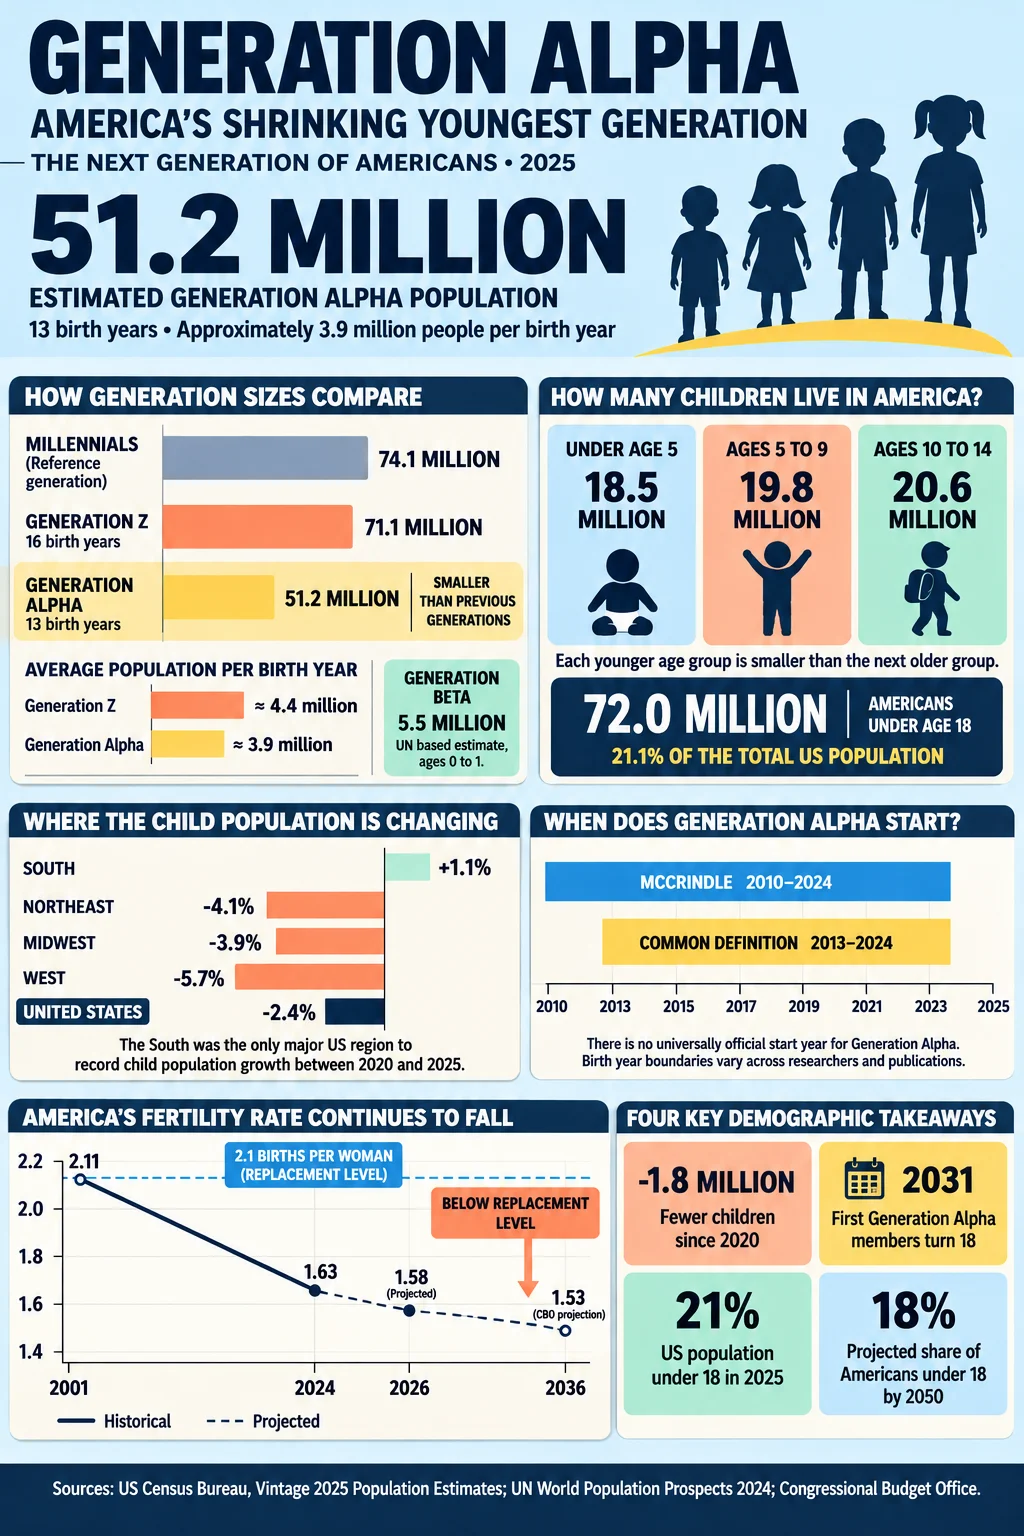
Generation Alpha, the children born from 2013 onward, numbers about 51.2 million Americans, or 15% of the population, in a Census Bureau-based tally for 2025. That is roughly 20 million fewer than Generation Z and 23 million fewer than Millennials, even though the Alpha count is still growing with every birth. The reason is the nation’s fertility rate, which fell from 2.11 births per woman in 2001 to 1.63 in 2024. The population under 18, which is almost entirely Generation Alpha plus the youngest Gen Z, fell by 1.8 million between 2020 and 2025.
Unlike Baby Boomers, Generation Alpha has no official start year. Pew Research Center’s generation boundaries run through Gen Z (1997 to 2012), and the labels that follow come from researchers such as Mark McCrindle, who used 2010 to 2024 for Alpha and 2025 to 2039 for Generation Beta. The tallies below use 2013 as the start, analysis of Census Bureau data (ages 0 to 12 in 2025, total 340.1 million) and the UN World Population Prospects 2024 projection for July 1, 2026 (ages 2 to 13, total 349.0 million). Both are explained because the choice of definition changes the count by several million.
Data Snapshot
| Metric | Figure | Reference |
|---|---|---|
| Generation Alpha, Census-based | 51,238,687 (15%) | 2025, ages 0 to 12 |
| Generation Alpha, UN projection | 47,123,271 (13.5%) | July 1, 2026, ages 2 to 13 |
| Generation Beta, UN projection | 5,534,368 (1.6%) | July 1, 2026, ages 0 to 1 |
| Population under 18 | 72,021,348 (21.1%) | July 1, 2025 |
| Change in under-18 population since 2020 | -1,800,879 (-2.4%) | April 2020 to July 2025 |
| Total fertility rate | 1.63 (from 2.11 in 2001) | 2024 |
| Oldest Alpha turns 18 | 2031 |
Why Counts of Gen Alpha Differ
| Source | Birth years | Age in count year | Count |
|---|---|---|---|
| Census Bureau data | 2013 to 2025 | 0 to 12 (2025) | 51,238,687 |
| UN World Population Prospects 2024 | 2013 to 2024 | 2 to 13 (July 2026) | 47,123,271 |
| UN World Population Prospects 2024 (Alpha plus Beta) | 2013 to 2026 | 0 to 13 (July 2026) | 52,657,639 |
The first two counts differ by 4.1 million because the Census-based table includes children born in 2025 and the UN table moves them into a separate Generation Beta, while also dropping the oldest age group as it grows one year older. Combining the UN’s Alpha and Beta lines (52.7 million for ages 0 to 13) gives a number close to the Census-based 51.2 million for ages 0 to 12, once the extra birth year is accounted for. When someone cites a Gen Alpha figure, the first question is the birth-year range.
The Age Structure of Gen Alpha
Census Bureau Vintage 2025 data for five-year age groups show how many children are at each age.
| Age group (July 2025) | Population | Share of US population |
|---|---|---|
| Under 5 | about 18.5 million | 5.4% |
| 5 to 9 | about 19.8 million | 5.8% |
| 10 to 14 | about 20.6 million | 6.0% |
| 0 to 17 | 72,021,348 | 21.1% |
Each younger age group is smaller than the one above it. The under-5 group, at about 18.5 million, is smaller than the 65-to-69 group (19.9 million), and about 2.1 million below the 10-to-14 group. That is the pattern of a shrinking base. Because Gen Alpha covers 13 birth years where Gen Z spans 16, part of the gap with Gen Z is simply the number of years counted: dividing 51.2 million by 13 gives about 3.9 million per birth year, against 4.4 million per birth year for Gen Z (71.1 million over 16). By that measure, Gen Alpha’s birth cohorts are on average about 11% smaller than Gen Z’s.
The Decline in Children
The Census Bureau’s regional data show where the population under 18 is shrinking.
| Region | Change in under-18 population, April 2020 to July 2025 |
|---|---|
| Northeast | -4.1% |
| Midwest | -3.9% |
| South | +1.1% |
| West | -5.7% |
| United States | -2.4% |
The South is the only region where the child population grew by 1.1%, while the West lost 5.7%. The Census Bureau’s short-term projection shows the national under-18 population falling again between July 2025 and July 2026, by 720,788 (1.0%) to 71.3 million, and the Congressional Budget Office projects that the number of people 24 or younger will decline for three decades. The Census Bureau’s 2023 projections put the under-18 share at 21% in 2025, 20% in 2030, 19% in 2040, and 18% in 2050.
State differences are wide. Utah has the highest share of residents under 18 (26.1%), followed by Texas (24.0%), Nebraska (23.7%) and South Dakota (23.5%), while Vermont (17.0%), Maine and New Hampshire (both 17.3%) have the lowest. A separate article in this series covers the child population by state in detail.
Fertility and Cohort Size
The fertility rate is the most direct explanation for smaller cohorts. The Census Bureau and the National Center for Health Statistics report a total fertility rate of 1.63 in 2024, which is 23% below the 2001 level of 2.11 and well below the 2.1 replacement level.
The CBO’s January 2026 outlook assumes 1.58 births per woman in 2026, falling to 1.53 in 2036 and holding at that level, and projects that deaths will exceed births from 2030. If that happens, any growth in the child population has to come from immigration, which fell sharply in the 2024-to-2025 estimates: net international migration dropped from 8.08 to 3.70 per 1,000 residents.
Because of that, the generation after Alpha, Generation Beta, begins with a lower base. The UN counts 5.5 million children aged 0 to 1 in 2026, and that figure should be treated as an estimate: it will change as the birth data for 2025 and 2026 arrive.
Gen Alpha in the Years Ahead
The oldest Gen Alpha members, born in 2013, turn 18 in 2031, and the entire generation is adult by 2043 if the 2025 birth year is the last. In the 2030s, the first Alpha cohorts will enter a labor market that the CBO expects to depend mainly on immigration for growth, since the number of people under 25 is falling. The children now in elementary school are among the larger age groups in the pyramid, but they will be succeeded by smaller cohorts.
Statements about Generation Alpha’s habits, such as technology use or spending, are not population statistics. The counts here describe size, age, and geography only. Pew Research Center has also said it will stop creating new generation labels, and the Alpha label is a market research convention that scholars treat with caution.
Conclusion
Generation Alpha is smaller than the generation before it, even as the total population kept growing. At 51.2 million, with each age group smaller than the next one up, it is a measure of a fertility rate that has stayed below replacement for almost two decades. The answer to how many Alphas there are depends on a definition, but the direction of the numbers does not: fewer children, in fewer regions, than the generation before.
Frequently Asked Questions
1. How many people are in Generation Alpha in the United States?
About 51.2 million (15% of the population) in a Census-based tally for 2025, or 47.1 million in the UN’s July 2026 projection when children born in 2025 are counted separately.
2. What birth years define Generation Alpha?
There is no official definition. Many sources use 2013 to 2024 or 2025, while some researchers use 2010 to 2024.
3. How old is Generation Alpha in 2025?
Zero to 12 in 2025, with a 2013 start, or up to 15 with a 2010 start.
4. Is Generation Alpha smaller than Generation Z?
Yes. Alpha is about 20 million smaller (51.2 million against 71.1 million), partly because it spans 13 birth years rather than 16.
5. What comes after Generation Alpha?
Generation Beta, defined by McCrindle Research as the cohort born from 2025 to 2039.
6. How many children under 18 are there in the US?
72,021,348 as of July 1, 2025, down 1.8 million (2.4%) from April 2020.
7. Why is the child population shrinking?
The main factor is the fertility rate, which fell to 1.63 in 2024 from 2.11 in 2001. Lower immigration also reduced the number of arriving children in 2025.
8. Which region has the most growth in children?
The South was the only region with growth in the under-18 population, at 1.1% between 2020 and 2025.
9. When do the first Alpha turn 18?
In 2031, for those born in 2013.
10. How large will the under-18 population be in 2050?
The Census Bureau’s 2023 projections put the under-18 share at 18% in 2050, down from 22% in 2022. The Weldon Cooper Center and CBO series show similar declines in the youth share.
Sources
- U.S. Census Bureau, “Populations in All Age Groups Growing in the South,” press release CB26-105 (Vintage 2025), June 25, 2026.
- Population Pyramids, “United States Generation Breakdown 2026” (UN World Population Prospects 2024, medium variant).
- Business Stats, “How Many Adults Live in the US” (age groups, July 2026 projection, fertility rate).
- Congressional Budget Office, “The Demographic Outlook 2026 to 2056,” January 2026.
- Population Reference Bureau, “Fact Sheet Aging in the United States” (Census 2023 projections of age shares).
- Population Pyramids, “Youngest States in the US” (state under-18 shares).