Key Fact & Findings
- There are 72,021,348 children under 18, 21.1% of the population, down 2.4% since 2020.
- The South is the only region where the child population grew (+1.1%); the West lost 5.7%.
- The Census Bureau projects 71.3 million children in July 2026, a decline of 720,788.
- Children outnumber adults 65 and over by 7.4 million, but the gap is projected to shrink by 2.5 million in a year.
- Utah (26.1%), Texas (24.0%) and Nebraska (23.7%) have the highest child shares; Vermont (17.0%) has the lowest.
- California (about 8.2 million) and Texas (about 7.6 million) hold 22% of all children.
- The Census Bureau projects the under-18 share at 18% by 2050.
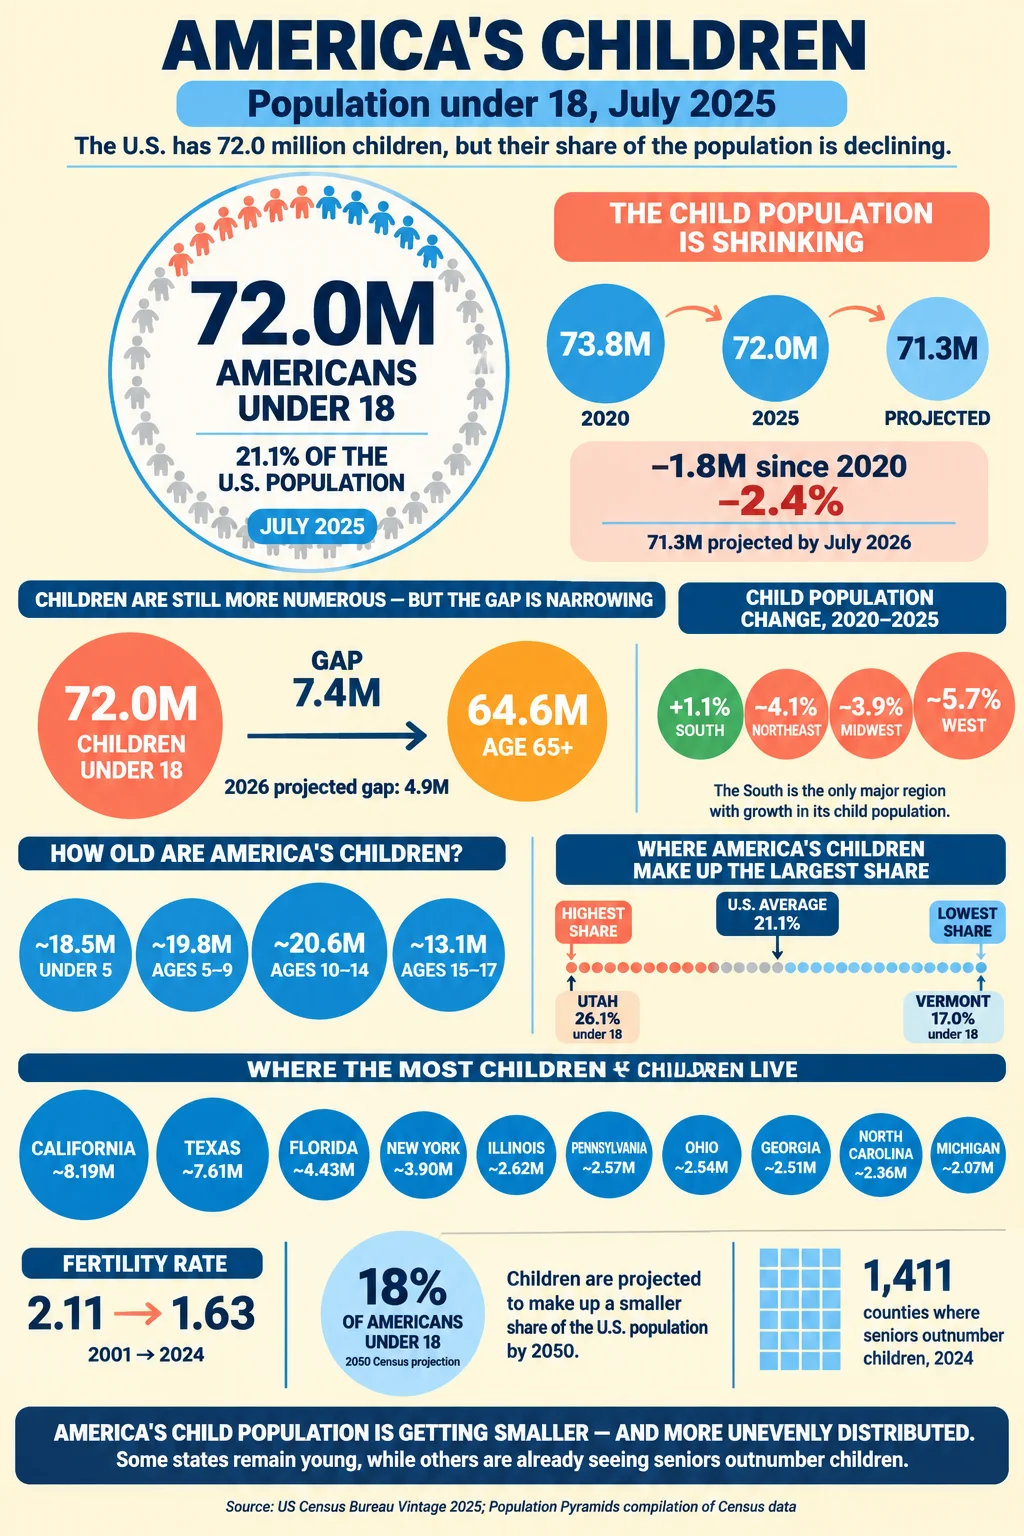
The United States had 72,021,348 residents under 18 on July 1, 2025, down 1,800,879 (2.4%) from the April 2020 base, and the Census Bureau’s short-term projection shows another drop of 720,788 by July 2026. The South was the only region where the child population grew, by 1.1%, while the West lost 5.7% of its children. Children are now 21.1% of the population, down from 22.3% in 2020, and they outnumber the 64.6 million Americans aged 65 and older by 7.4 million, a lead that arithmetic suggests could vanish within three years.
This article counts the resident population from birth through age 17. National and regional figures are from the Census Bureau’s Vintage 2025 estimates, released June 25, 2026. State shares are from the Population Pyramids compilation of the same estimates, rounded to one decimal, and state counts are calculated by multiplying each share by the state’s July 2025 population, so they are approximate. The sum of those 51 calculated counts is 72.0 million, matching the national figure.
Data Snapshot
| Metric | Figure | Reference |
|---|---|---|
| Population under 18 | 72,021,348 (21.1%) | July 1, 2025 |
| April 2020 base | 73,822,227 (22.3%) | |
| Change since 2020 | -1,800,879 (-2.4%) | |
| Projected July 2026 | 71,300,560 (-720,788, -1.0%) | Census Bureau short-term projection |
| Highest child share | Utah, 26.1% | |
| Lowest child share | Vermont, 17.0% | |
| Largest child population | California, about 8.19 million | |
| Total fertility rate | 1.63 (from 2.11 in 2001) | 2024 |
How Many Children and How Old
The Census Bureau’s five-year age groups show a pyramid that narrows toward the base.
| Age group | July 2025 population | Share of US population |
|---|---|---|
| Under 5 | about 18.5 million | 5.4% |
| 5 to 9 | about 19.8 million | 5.8% |
| 10 to 14 | about 20.6 million | 6.0% |
| 15 to 17 | about 13.1 million (by subtraction) | 3.8% |
| Total under 18 | 72,021,348 | 21.1% |
The youngest group, children under 5, numbers about 18.5 million, about 2.1 million fewer than ages 10 to 14. That is the signature of falling birth numbers: each year’s group of newcomers is smaller than the cohort ahead. The United Nations’ 2026 projection gives a sex ratio of about 105 boys per 100 girls among the 2013-to-2024 birth cohorts (24.2 million boys and 23.0 million girls), the usual excess of male births.
Five Years of Decline
| Region | Change in under-18 population, April 2020 to July 2025 |
|---|---|
| Northeast | -4.1% |
| Midwest | -3.9% |
| South | +1.1% |
| West | -5.7% |
| United States | -2.4% |
The South’s gain was concentrated in the outlying counties of its metropolitan areas, where the Census Bureau found populations in every age group growing fastest. Elsewhere, the loss of children was widespread: even regions where the total population grew, such as the West, lost more than 5% of their young. The decline is driven by the long fall in the fertility rate (1.63 in 2024 against 2.11 in 2001) and by the sharp slowdown in net international migration, which dropped from 8.08 to 3.70 per 1,000 residents between 2023-24 and 2024-25.
The children-versus-seniors comparison is closing quickly.
| Measure | July 2025 | Projected July 2026 | Difference |
|---|---|---|---|
| Under 18 | 72,021,348 | 71,300,560 | -720,788 |
| 65 and older | 64,617,088 | 66,405,075 | +1,787,987 |
| Children minus older adults | 7,404,260 | 4,895,485 | -2,508,775 |
If the 2025-to-2026 changes repeated, the gap would be about 2.4 million in 2027 and would close around 2028. That is simple arithmetic, not a forecast: the Census Bureau’s 2023 projections, built on older estimates, show older adults outnumbering children around 2029, and a change in immigration or births could move the date.
Number of Children by State
The table ranks states by the share of residents under 18. Counts are calculated and rounded to the nearest thousand. Ties share a rank.
| Rank | State | Share under 18 | Approximate population under 18 |
|---|---|---|---|
| 1 | Utah | 26.1% | 924,000 |
| 2 | Texas | 24.0% | 7,610,000 |
| 3 | Nebraska | 23.7% | 478,000 |
| 4 | South Dakota | 23.5% | 220,000 |
| 5 | Alaska | 23.3% | 172,000 |
| 5 | Idaho | 23.3% | 473,000 |
| 7 | Oklahoma | 23.2% | 957,000 |
| 8 | Kansas | 22.9% | 682,000 |
| 8 | North Dakota | 22.9% | 183,000 |
| 10 | Louisiana | 22.7% | 1,048,000 |
| 11 | Indiana | 22.6% | 1,576,000 |
| 12 | Arkansas | 22.4% | 698,000 |
| 13 | Mississippi | 22.3% | 659,000 |
| 14 | Georgia | 22.2% | 2,509,000 |
| 14 | Iowa | 22.2% | 719,000 |
| 16 | Kentucky | 22.1% | 1,018,000 |
| 17 | Minnesota | 22.0% | 1,283,000 |
| 18 | Missouri | 21.7% | 1,361,000 |
| 19 | Wyoming | 21.6% | 127,000 |
| 20 | Alabama | 21.5% | 1,117,000 |
| 20 | Tennessee | 21.5% | 1,573,000 |
| 22 | Maryland | 21.3% | 1,335,000 |
| 22 | Ohio | 21.3% | 2,535,000 |
| 24 | North Carolina | 21.1% | 2,363,000 |
| 25 | Arizona | 21.0% | 1,601,000 |
| 26 | New Jersey | 20.9% | 1,996,000 |
| 26 | Virginia | 20.9% | 1,856,000 |
| 28 | California | 20.8% | 8,186,000 |
| 29 | Nevada | 20.7% | 679,000 |
| 29 | New Mexico | 20.7% | 440,000 |
| 31 | Illinois | 20.6% | 2,620,000 |
| 31 | South Carolina | 20.6% | 1,147,000 |
| 33 | Wisconsin | 20.5% | 1,224,000 |
| 34 | Michigan | 20.4% | 2,066,000 |
| 34 | Washington | 20.4% | 1,632,000 |
| 36 | Colorado | 20.3% | 1,221,000 |
| 37 | Montana | 20.2% | 231,000 |
| 38 | Delaware | 19.8% | 210,000 |
| 39 | Hawaii | 19.7% | 282,000 |
| 39 | Pennsylvania | 19.7% | 2,573,000 |
| 41 | Connecticut | 19.5% | 719,000 |
| 41 | New York | 19.5% | 3,900,000 |
| 41 | West Virginia | 19.5% | 344,000 |
| 44 | Oregon | 19.0% | 812,000 |
| 45 | Florida | 18.9% | 4,434,000 |
| 46 | Massachusetts | 18.6% | 1,331,000 |
| 47 | District of Columbia | 17.9% | 124,000 |
| 48 | Rhode Island | 17.7% | 197,000 |
| 49 | Maine | 17.3% | 245,000 |
| 49 | New Hampshire | 17.3% | 245,000 |
| 51 | Vermont | 17.0% | 110,000 |
Where the Most Children Live
The largest child populations are in the largest states.
| Rank by number | State | Approximate population | Share of state |
|---|---|---|---|
| 1 | California | 8,186,000 | 20.8% |
| 2 | Texas | 7,610,000 | 24.0% |
| 3 | Florida | 4,434,000 | 18.9% |
| 4 | New York | 3,900,000 | 19.5% |
| 5 | Illinois | 2,620,000 | 20.6% |
| 6 | Pennsylvania | 2,573,000 | 19.7% |
| 7 | Ohio | 2,535,000 | 21.3% |
| 8 | Georgia | 2,509,000 | 22.2% |
| 9 | North Carolina | 2,363,000 | 21.1% |
| 10 | Michigan | 2,066,000 | 20.4% |
California (about 8.2 million) and Texas (about 7.6 million) together have roughly 15.8 million children, 22% of the national total. Texas has the second-highest child share in the country (24.0%) and is the only large state whose children’s share is far above the national figure; California’s 20.8% is below it.
States With the Highest and Lowest Child Shares
Utah leads at 26.1%, followed by Texas (24.0%), Nebraska (23.7%), South Dakota (23.5%) and Alaska and Idaho (both 23.3%). The lowest shares are in Vermont (17.0%), Maine and New Hampshire (both 17.3%), Rhode Island (17.7%) and the District of Columbia (17.9%). The gap between Utah and Vermont is 9.1 percentage points. A separate article covers states ranked by median age.
Why There Are Fewer Children
Three forces explain the decline. First, fewer births: the total fertility rate is 1.63, and the Congressional Budget Office assumes it will drop to 1.58 in 2026 and 1.53 by 2036. Second, immigration, which adds children directly and also raises births, fell sharply in 2025. Third, the number of women in their peak childbearing years is not growing fast enough to offset lower rates per woman, because the 25-to-44 group, which holds most parents of young children, grew only 0.6% in the Census Bureau’s 2026 projection.
The CBO projects that the number of people 24 or younger will decline for three decades. The Census Bureau’s 2023 projections put the under-18 share at 22% in 2022, 21% in 2025, 20% in 2030, 19% in 2040, and 18% in 2050. At 18% of an estimated 360 million to 370 million residents, children would number about 65 million to 67 million in 2050, which is 5 to 7 million fewer than today (this is an illustration from the projected shares, not a published count).
What a Smaller Child Population Means
School enrollment, child care, and pediatric health care all scale with the number of children, and the geography of the decline is uneven. The South, where children grew 1.1%, is expanding school systems in outlying suburbs, while the Northeast (-4.1%), Midwest (-3.9%) and West (-5.7%) are managing smaller cohorts. The Census Bureau found that in 1,411 of 3,143 counties in 2024, older adults outnumbered children, nearly half of all counties. Those figures describe numbers, not need: a county with fewer children can still have large gaps in services.
Conclusion
The child population is shrinking by about 2.4% every five years, and nearly all of the loss is outside the South. At 72 million, children still outnumber older adults, but the margin is shrinking at about 2.5 million a year. The state ranking explains why local experience differs so sharply: a child is one in four residents in Utah and one in six in Vermont.
Frequently Asked Questions
1. How many children under 18 are there in the United States?
72,021,348 as of July 1, 2025, according to the Census Bureau’s Vintage 2025 estimates. That is 21.1% of the population.
2. Is the number of children in the US declining?
Yes. It fell by 1,800,879 (2.4%) between April 2020 and July 2025, and the Census Bureau projects a further decline of 720,788 by July 2026.
3. Which state has the most children?
California, with roughly 8.2 million, followed by Texas (about 7.6 million) and Florida (about 4.4 million).
4. Which state has the highest share of children?
Utah, at 26.1%, followed by Texas (24.0%) and Nebraska (23.7%).
5. Which state has the lowest share of children?
Vermont, at 17.0%. Maine and New Hampshire follow at 17.3% each.
6. Which region is gaining children?
Only the South, where the under-18 population grew 1.1% between 2020 and 2025. The West lost 5.7%.
7. How many children are under 5?
About 18.5 million in July 2025, or 5.4% of the population.
8. Do children outnumber older adults?
Nationally yes: 72.0 million to 64.6 million. In 2024, the Census Bureau found 11 states and 1,411 counties where older adults outnumbered children.
9. Why are there fewer children?
Mainly a lower fertility rate (1.63 in 2024 versus 2.11 in 2001) and a drop in international migration in 2025.
10. How many children will there be in 2050?
The Census Bureau’s 2023 projections put the under-18 share at 18% in 2050. At that share, a population of 360 to 370 million implies roughly 65 to 67 million children, an illustrative calculation.
Recommended Articles in the USA Population Series:
- USA Baby Boomer Population Falls to 64.4 Million, Down 14 Million From Its Peak
- Generation X Population in the USA Reaches About 65 Million, Nearly Matching Boomers
- Working-Age Population in the US Stands at 205 Million, but Its Share Has Fallen
- US Aging Population Statistics: 64.6 Million Seniors, 7 Million Over 85, 119,100 Centenarians
- USA States With the Oldest Populations: Maine Has 142 Seniors for Every 100 Children
- How Will America’s Age Structure Change by 2050? Key Shifts to Watch
- US Population Pyramid Is Turning Into a Column With a Heavy Middle
- US States With the Youngest Populations: Utah Has Twice as Many Children as Seniors
- US Population Over 65 by State Ranges From 24.6% in Maine to 13.0% in Utah
- Generation Alpha Population in America Reaches 51 Million
- Generation Z Population in the USA Reaches 71 Million, With Nearly 2 Million More Boys
- Millennial Population in America Tops 74 Million and Dominates the Middle of the Age Pyramid
- Median Age in the United States Reaches 39.4, With Maine 12.3 Years Older Than Utah
- Largest Cities in America by Population: The 25 Biggest Urban Centers
- Most Densely Populated Cities in America: A Tiny Jersey Town Outranks New York
- US Metropolitan Population Projections for 2050: Where Growth Will Be Concentrated
- Fastest-Growing Metropolitan Areas in the USA Are Concentrated in Smaller Southeast Metros
- How America’s Biggest Cities Changed Places Between 1900 and 2027
- Cities Losing Population in the USA: New York Falls by 166,000 as St. Louis Drops 7.4%
- Largest Urban Areas in the United States: The Metro Regions With the Most Residents
- Largest Metropolitan Areas in the USA: Where 86% of Americans Live
- Fastest-Growing Cities in the US Are Texas Suburbs, While Charlotte Leads in New Residents
- Top 25 Most Populated Cities in the USA in 2027: America’s Biggest Urban Centers
Sources
- U.S. Census Bureau, “Populations in All Age Groups Growing in the South,” press release CB26-105 (Vintage 2025), June 25, 2026.
- U.S. Census Bureau, “Older Adults Outnumber Children in 11 States and Nearly Half of U.S. Counties,” June 26, 2025.
- SmartAsset via Boston 25 News, “US population trends by state,” September 17, 2026.
- Business Stats, “How Many Adults Live in the US” (age groups, July 2026 projection, fertility rate).
- Congressional Budget Office, “The Demographic Outlook 2026 to 2056.”
- Population Reference Bureau, “Fact Sheet Aging in the United States” (Census 2023 projections of age shares).