Key Fact & Findings
- The 2025 pyramid is widest at ages 25 to 39 (more than 23 million per five-year group), not at the base (about 18.5 million under 5).
- The Census Bureau projects 342.6 million residents in July 2026; repeating that change gives 343.5 million in 2027.
- The 65-and-older group is projected to grow by 1.79 million a year, while children decline by about 721,000.
- The first Baby Boomers turn 81 in 2027; the last turn 63.
- Women outnumber men by about 8.6 million at ages 25 and over, with only 61 men per 100 women at 85 and over.
- On simple arithmetic, older adults outnumber children around 2028; the Census Bureau’s 2023 projections point to about 2029.
- No official 2027 pyramid exists; the 2027 figures here are an illustration.
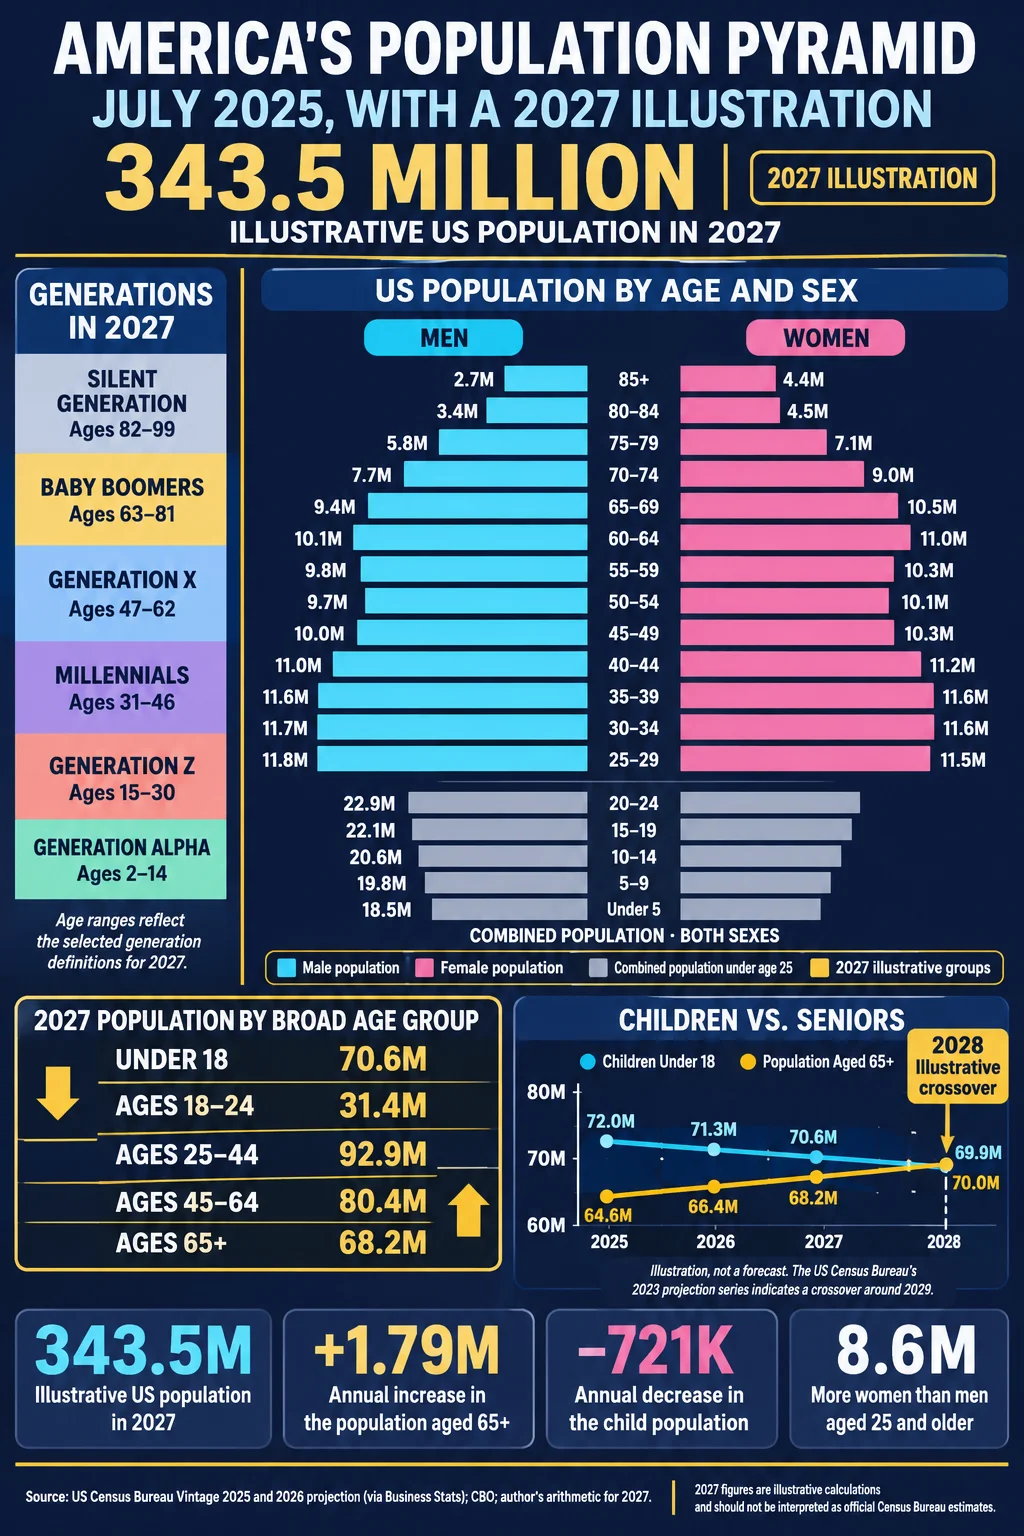
The widest band of the US population in 2025 is not at the bottom. It sits between ages 25 and 39, where each five-year group holds more than 23 million people, while the group under five has about 18.5 million. By 2027, the picture will be more extreme: if the Census Bureau’s latest short-term projection holds for a second year, the under-18 population falls to about 70.6 million while the 65-and-older population rises to about 68.2 million, narrowing the gap between them from 7.4 million in 2025 to about 2.4 million.
No official 2027 population pyramid exists. The Census Bureau publishes estimates for July 1 of each year and a short-term projection for July 1, 2026. The 2027 figures here are an illustration, produced by repeating the 2025-to-2026 change in each broad age group for one more year, and they are labeled as such. The 2025 data are the Census Bureau’s Vintage 2025 estimates (released June 25, 2026), with five-year group counts and sex ratios as compiled by Business Stats.
Data Snapshot
| Metric | 2025 estimate | 2026 projection | 2027 illustration |
|---|---|---|---|
| Total population | 341,784,857 | 342,620,143 | 343,455,429 |
| Under 18 | 72,021,348 (21.1%) | 71,300,560 (20.8%) | 70,579,772 (20.6%) |
| 18 to 24 | 31,936,859 (9.3%) | 31,661,136 (9.2%) | 31,385,413 (9.1%) |
| 25 to 44 | 91,885,062 (26.9%) | 92,396,114 (27.0%) | 92,907,166 (27.0%) |
| 45 to 64 | 81,324,500 (23.8%) | 80,857,258 (23.6%) | 80,390,016 (23.4%) |
| 65 and older | 64,617,088 (18.9%) | 66,405,075 (19.4%) | 68,193,062 (19.9%) |
The 2026 column is the Census Bureau’s short-term projection as reported by Business Stats. The 2027 column adds the same annual change again and ignores any change in births, deaths, or immigration. It is arithmetic, not a forecast. Total population in the illustration grows 0.24% a year, which is the pace of the 2025-to-2026 projection and well below the 0.5% of 2024 to 2025.
The 2025 Pyramid in Numbers
Counts for single five-year age groups, with the male and female split calculated from the Census Bureau’s sex ratios for ages 25 and over.
| Age group | Total (July 2025) | Men per 100 women | Men (millions) | Women (millions) |
|---|---|---|---|---|
| 85 and older | 7,041,036 | 61.0 | 2.67 | 4.37 |
| 80 to 84 | 7,928,310 | 75.4 | 3.41 | 4.52 |
| 75 to 79 | 12,959,591 | 81.9 | 5.84 | 7.12 |
| 70 to 74 | 16,766,692 | 85.6 | 7.73 | 9.03 |
| 65 to 69 | 19,921,459 | 89.1 | 9.39 | 10.53 |
| 60 to 64 | 21,076,817 | 92.2 | 10.11 | 10.97 |
| 55 to 59 | 20,112,899 | 94.6 | 9.78 | 10.34 |
| 50 to 54 | 19,778,682 | 95.8 | 9.68 | 10.10 |
| 45 to 49 | 20,356,102 | 96.8 | 10.01 | 10.34 |
| 40 to 44 | 22,149,712 | 98.1 | 10.97 | 11.18 |
| 35 to 39 | 23,171,303 | 99.4 | 11.55 | 11.62 |
| 30 to 34 | 23,221,682 | 100.9 | 11.66 | 11.56 |
| 25 to 29 | 23,342,365 | 102.5 | 11.82 | 11.53 |
| 20 to 24 | about 22.9 million | not shown | ||
| 15 to 19 | about 22.1 million | not shown | ||
| 10 to 14 | about 20.6 million | not shown | ||
| 5 to 9 | about 19.8 million | not shown | ||
| Under 5 | about 18.5 million | not shown |
Men and women for ages 25 and over sum to about 114.6 million and 123.2 million, a gap of 8.6 million that is concentrated above age 60. Ratios for the younger groups were not available in the sources used, and boys typically outnumber girls by about 5% at birth.
The shape of the pyramid is plain from the totals: it grows from under 5 (18.5 million) through 25 to 29 (23.3 million), then narrows slowly to 20.4 million at 45 to 49, shows a bump at 60 to 64 (21.1 million) where the baby boom begins, and then falls steeply to 7.0 million at 85 and over.
What Changes by 2027
Ages move up by two years between July 2025 and July 2027, and the cohorts they carry have known sizes. The generation boundaries shift in age as follows.
| Generation | Birth years | Age in 2025 | Age in 2027 |
|---|---|---|---|
| Silent Generation | 1928 to 1945 | 80 to 97 | 82 to 99 |
| Baby Boomers | 1946 to 1964 | 61 to 79 | 63 to 81 |
| Generation X | 1965 to 1980 | 45 to 60 | 47 to 62 |
| Millennials | 1981 to 1996 | 29 to 44 | 31 to 46 |
| Generation Z | 1997 to 2012 | 13 to 28 | 15 to 30 |
| Generation Alpha | 2013 to 2025 | 0 to 12 | 2 to 14 |
By July 2027, the first Baby Boomers (born 1946) will be 81, so the baby boom’s leading edge moves from the 75-to-79 bar into the 80-to-84 bar. The last Boomers (born 1964) will be 63, still in the 60-to-64 group. Generation X will be entirely in the 45-to-64 group for the first time, the oldest Gen Zers will turn 30, and the youngest Gen Zers (born 2012) will turn 15. Two new birth years will have been added at the bottom of the pyramid and two old ones removed at the top.
The Big Shifts in the Short-Term Projection
The Census Bureau’s 2026 projection has four notable movements.
| Age group | Projected change, July 2025 to July 2026 | Percent |
|---|---|---|
| Under 18 | -720,788 | -1.0% |
| 18 to 24 | -275,723 | -0.9% |
| 25 to 44 | +511,052 | +0.6% |
| 45 to 64 | -467,242 | -0.6% |
| 65 and older | +1,787,987 | +2.8% |
| Total | +835,286 | +0.2% |
Two age groups drive nearly all of the growth: the 65-and-older group adds 1.79 million, and the 25-to-44 group adds 0.51 million. Everything else shrinks. In the illustration, those trends continue for a second year, so the pyramid’s top and middle thicken while its base and its 45-to-64 band thin.
When Older Adults Outnumber Children
The children-minus-older-adults gap is the most-watched number in the illustration.
| Year | Under 18 | 65 and older | Children minus older adults |
|---|---|---|---|
| 2025 | 72,021,348 | 64,617,088 | +7,404,260 |
| 2026 (projection) | 71,300,560 | 66,405,075 | +4,895,485 |
| 2027 (illustration) | 70,579,772 | 68,193,062 | +2,386,710 |
| 2028 (continuing illustration) | 69,858,984 | 69,981,049 | -122,065 |
The gap narrows by about 2.5 million each year, so under this arithmetic the two groups would cross in 2028. The Census Bureau’s 2023 projections, which were built on a lower population base and different immigration assumptions, have older adults outnumbering children around 2029.
A change in births, deaths, or immigration could move the crossing a year or two in either direction, and the Census Bureau revises every vintage. The Congressional Budget Office projects that deaths will exceed births from 2030, and that the number of people 24 or younger will decline for three decades, which would keep the base narrow.
Reading a Pyramid Correctly
A population pyramid is a picture of age at one date, so it does not show changes directly. Each bar’s width is the number of people in that five-year group, and the ratio of men to women is the shape of the split. The traditional pyramid shape, wide at the bottom, describes a population with high birth rates.
The US is now closer to a column: the 25-to-39 bars are the largest, the under-5 bar is about 20% shorter than the 25-to-29 bar, and the oldest bars are dominated by women. The 2027 illustration changes that shape only slightly, because aging moves the same people up two steps, but it makes the top bars heavier and the bottom bars lighter.
Conclusion
The pyramid that best describes America in 2027 is the one already visible in 2025: a broad middle band of adults in their late twenties to thirties, a base about 20% narrower, and a top that is getting heavier by almost 1.8 million people a year. The sharpest change on the horizon is the point where older adults outnumber children, and on the numbers available it is a matter of two or three years, not a decade.
Frequently Asked Questions
1. What does the US population pyramid look like?
It is widest between ages 25 and 39, with each five-year group above 23 million, narrower at the bottom (about 18.5 million under 5) and tapering steeply above 65.
2. Is there an official 2027 US population pyramid?
No. The Census Bureau publishes July 1 estimates for the previous year and a short-term projection for the current year. Any 2027 pyramid is an illustration or a projection.
3. How many Americans will there be in 2027?
About 343.5 million, based on simple arithmetic from the Census Bureau’s 2025 estimate (341.8 million) and 2026 projection (342.6 million). It is not an official figure.
4. How many children and seniors will there be?
In the illustration, about 70.6 million are under 18 and about 68.2 million are aged 65 and older.
5. When will seniors outnumber children?
On repeated arithmetic, around 2028, and around 2029 in the Census Bureau’s 2023 projections. The date depends on births, deaths, and immigration.
6. Which age group is the largest?
The 25-to-29 group, with 23.3 million, followed by 30-to-34 (23.2 million) and 35-to-39 (23.2 million).
7. How many more women than men are there?
At ages 25 and over about 8.6 million more women: roughly 123.2 million women against 114.6 million men.
8. How old will Baby Boomers be in 2027?
63 to 81. The first Boomers, born in 1946, turn 81.
9. Why is the base of the pyramid shrinking?
The fertility rate fell from 2.11 in 2001 to 1.63 in 2024, and net international migration dropped from 8.08 to 3.70 per 1,000 residents in 2024 to 2025.
10. Does the pyramid shape matter?
Yes. A narrowing base and widening top shift the balance between working-age adults and dependents. The old-age dependency ratio rose from 27.5 in 2020 to 31.5 in 2025 and is projected at 32.4 in 2026.
Recommended Articles in the USA Population Series:
- USA Baby Boomer Population Falls to 64.4 Million, Down 14 Million From Its Peak
- Generation X Population in the USA Reaches About 65 Million, Nearly Matching Boomers
- Working-Age Population in the US Stands at 205 Million, but Its Share Has Fallen
- Number of Children Under 18 in America Falls to 72 Million as the South Gains
- US Aging Population Statistics: 64.6 Million Seniors, 7 Million Over 85, 119,100 Centenarians
- USA States With the Oldest Populations: Maine Has 142 Seniors for Every 100 Children
- How Will America’s Age Structure Change by 2050? Key Shifts to Watch
- US States With the Youngest Populations: Utah Has Twice as Many Children as Seniors
- US Population Over 65 by State Ranges From 24.6% in Maine to 13.0% in Utah
- Generation Alpha Population in America Reaches 51 Million
- Generation Z Population in the USA Reaches 71 Million, With Nearly 2 Million More Boys
- Millennial Population in America Tops 74 Million and Dominates the Middle of the Age Pyramid
- Median Age in the United States Reaches 39.4, With Maine 12.3 Years Older Than Utah
- Largest Cities in America by Population: The 25 Biggest Urban Centers
- Most Densely Populated Cities in America: A Tiny Jersey Town Outranks New York
- US Metropolitan Population Projections for 2050: Where Growth Will Be Concentrated
- Fastest-Growing Metropolitan Areas in the USA Are Concentrated in Smaller Southeast Metros
- How America’s Biggest Cities Changed Places Between 1900 and 2027
- Cities Losing Population in the USA: New York Falls by 166,000 as St. Louis Drops 7.4%
- Largest Urban Areas in the United States: The Metro Regions With the Most Residents
- Largest Metropolitan Areas in the USA: Where 86% of Americans Live
- Fastest-Growing Cities in the US Are Texas Suburbs, While Charlotte Leads in New Residents
- Top 25 Most Populated Cities in the USA in 2027: America’s Biggest Urban Centers
Sources
- U.S. Census Bureau, “Populations in All Age Groups Growing in the South,” press release CB26-105 (Vintage 2025), June 25, 2026.
- Business Stats, “How Many Adults Live in the US” (five-year age groups, sex ratios, July 2026 short-term projection, dependency ratios).
- Congressional Budget Office, “The Demographic Outlook 2026 to 2056,” January 2026.
- Population Reference Bureau, “Fact Sheet Aging in the United States” (Census 2023 projections).
- U.S. Census Bureau, 2023 National Population Projections.