
Key Facts & Findings
- Twenty-seven of the 100 largest cities have fewer residents than at the 2020 base, losing about 481,000 combined.
- New York lost the most in number (-166,559), and St. Louis the most in percentage (-7.4%).
- Los Angeles County lost 53,934 residents in a single year, the most of any county.
- Only three of the 25 largest metros shrank in 2024 to 2025: Los Angeles, Miami and San Diego.
- Detroit, Indianapolis, Columbus, Pittsburgh and Louisville grew, since 2020, while Milwaukee, Cleveland and Toledo shrank.
- Counties with 1 million or more residents lost 637,634 people to domestic migration in one year.
- Nationally, net international migration fell from 8.08 to 3.70 per 1,000.
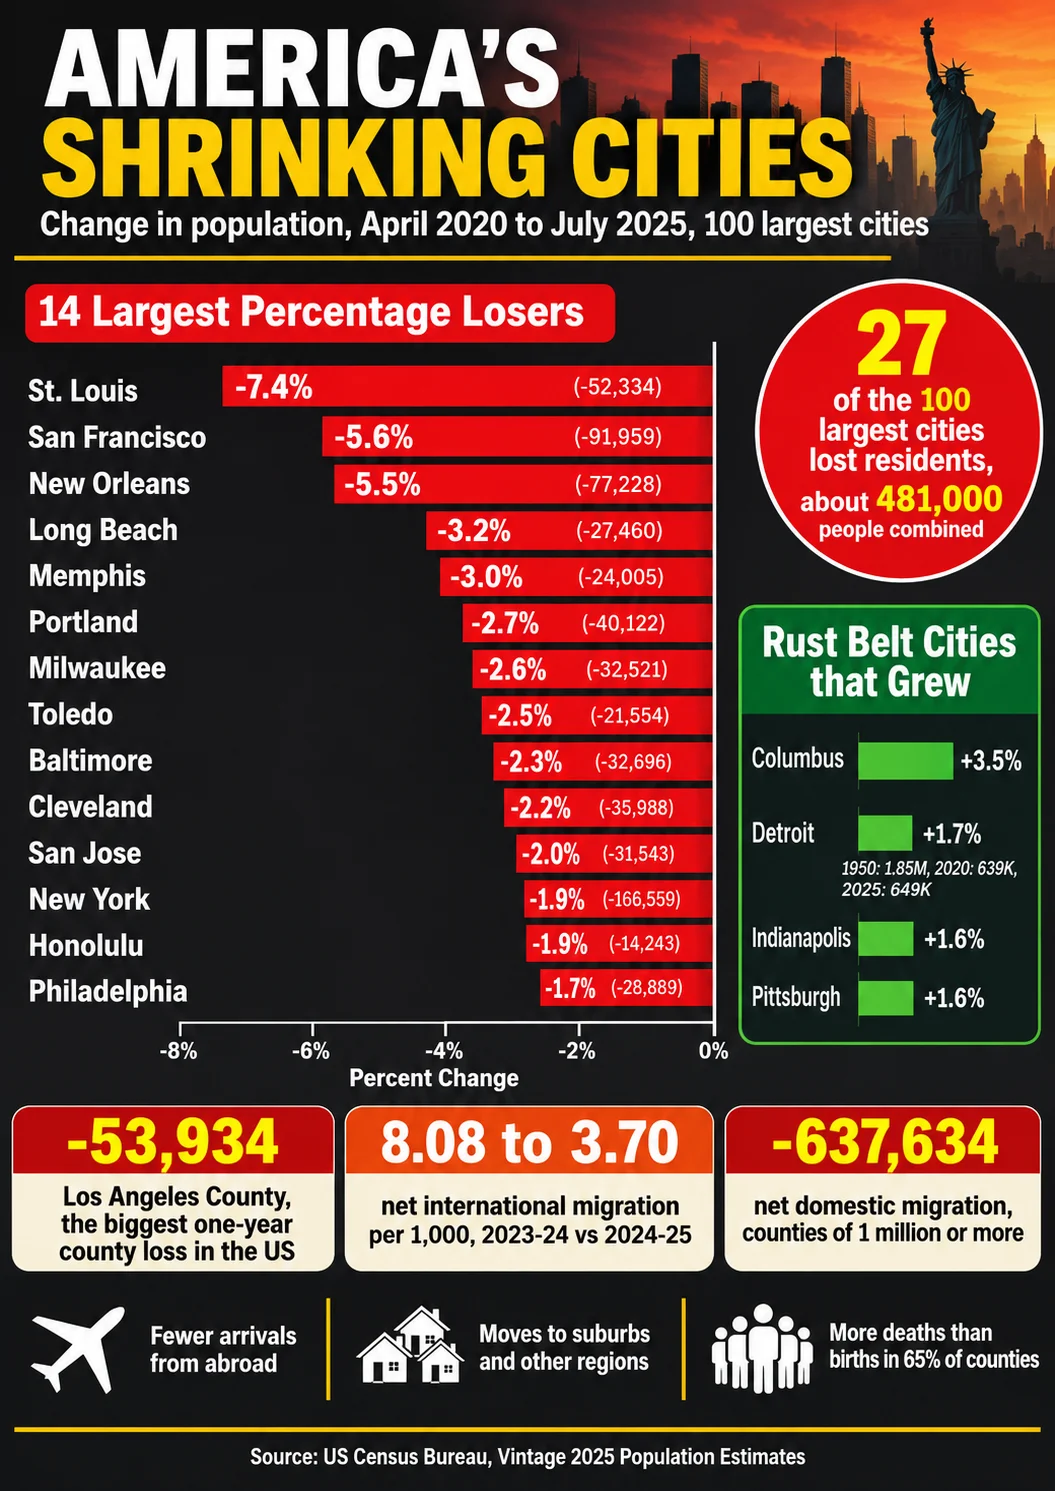
Of the 100 largest US cities, 27 have fewer residents today than at the 2020 estimates base, but the list does not read the way the Rust Belt stereotype suggests. New York City lost the most people, 166,559 since April 2020, and St. Louis lost the biggest share, 7.4%. Meanwhile, Detroit, Indianapolis, Columbus, and Louisville all grew. The Census Bureau’s Vintage 2025 estimates, released between March and May 2026, point to a more specific cause than regional decline: a sharp fall in international migration that hit the largest gateway cities hardest, layered on top of long-running movement out of expensive core counties.
All city figures here compare the April 1, 2020 estimates base with July 1, 2025 inside the same vintage, and are for incorporated city limits. County and metro figures are for July 2024 to July 2025. A decline in a city does not always mean a decline in its region: New York City shrank while its metro area grew by 32,361.
Data Snapshot
| Metric | Figure | Period |
|---|---|---|
| Largest numeric city decline since 2020 | New York City, -166,559 (-1.9%) | 2020 to 2025 |
| Largest percentage decline among the 100 largest cities | St. Louis, -7.4% | 2020 to 2025 |
| Largest one-year city decline | New York City, -12,196 | 2024 to 2025 |
| Largest one-year county decline | Los Angeles County, -53,934 | 2024 to 2025 |
| Counties with more deaths than births | 2,055 (65%) | 2024 to 2025 |
| Net domestic migration, counties of 1 million or more | -637,634 | 2024 to 2025 |
| Net international migration rate, US | 3.70 per 1,000 (from 8.08) | 2024-25 vs 2023-24 |
The 27 Largest Cities That Lost Residents Since 2020
| City | State | April 2020 base | July 2025 | Change | Percent |
|---|---|---|---|---|---|
| New York | NY | 8,751,188 | 8,584,629 | -166,559 | -1.9% |
| San Francisco | CA | 875,139 | 826,079 | -49,060 | -5.6% |
| Los Angeles | CA | 3,896,473 | 3,869,089 | -27,384 | -0.7% |
| Philadelphia | PA | 1,600,737 | 1,574,281 | -26,456 | -1.7% |
| St. Louis | MO | 300,302 | 278,144 | -22,158 | -7.4% |
| New Orleans | LA | 383,361 | 362,154 | -21,207 | -5.5% |
| San Jose | CA | 1,009,573 | 989,814 | -19,759 | -2.0% |
| Memphis | TN | 628,282 | 609,647 | -18,635 | -3.0% |
| Portland | OR | 653,049 | 635,109 | -17,940 | -2.7% |
| Long Beach | CA | 465,566 | 450,469 | -15,097 | -3.2% |
| Milwaukee | WI | 577,151 | 562,407 | -14,744 | -2.6% |
| Baltimore | MD | 583,295 | 569,997 | -13,298 | -2.3% |
| Chicago | IL | 2,741,640 | 2,731,585 | -10,055 | -0.4% |
| Cleveland | OH | 371,909 | 363,608 | -8,301 | -2.2% |
| Albuquerque | NM | 564,752 | 556,588 | -8,164 | -1.4% |
| Toledo | OH | 270,280 | 263,423 | -6,857 | -2.5% |
| Urban Honolulu (CDP) | HI | 348,449 | 341,868 | -6,581 | -1.9% |
| Virginia Beach | VA | 459,626 | 453,737 | -5,889 | -1.3% |
| Anaheim | CA | 346,645 | 341,008 | -5,637 | -1.6% |
| St. Paul | MN | 311,156 | 306,684 | -4,472 | -1.4% |
| Omaha | NE | 492,766 | 488,797 | -3,969 | -0.8% |
| Anchorage | AK | 290,877 | 287,155 | -3,722 | -1.3% |
| Buffalo | NY | 277,750 | 274,613 | -3,137 | -1.1% |
| Corpus Christi | TX | 318,278 | 317,247 | -1,031 | -0.3% |
| Minneapolis | MN | 430,772 | 430,324 | -448 | -0.1% |
| Oakland | CA | 441,157 | 440,838 | -319 | -0.1% |
| Chula Vista | CA | 275,809 | 275,533 | -276 | -0.1% |
Together, the 27 lost about 481,000 residents. California supplies seven (San Francisco, Los Angeles, San Jose, Long Beach, Anaheim, Oakland and Chula Vista), more than any other state. The numeric losses are dominated by the very largest places, while the percentage losses are led by cities that were already smaller: St. Louis (-7.4%), San Francisco (-5.6%), New Orleans (-5.5%), Long Beach (-3.2%) and Memphis (-3.0%). A percentage and a count tell different stories, and the ranking by one hides the other.
A Shrinking Rust Belt Is Only Half the Story
Cities usually grouped with the industrial Midwest and Northeast split almost evenly between losers and gainers.
| Shrinking since 2020 | Percent | Growing since 2020 | Percent |
|---|---|---|---|
| St. Louis | -7.4% | Columbus | +3.5% |
| Milwaukee | -2.6% | Kansas City | +2.6% |
| Toledo | -2.5% | Detroit | +1.7% |
| Cleveland | -2.2% | Indianapolis | +1.6% |
| Buffalo | -1.1% | Louisville/Jefferson County | +1.6% |
| Chicago | -0.4% | Pittsburgh | +1.6% |
| Cincinnati | +1.5% |
Detroit is the sharpest example. It peaked at 1,849,568 residents in the 1950 Census and fell to 639,111 in 2020, a loss of about 65%. The Vintage 2025 estimate is 649,095, roughly 10,700 above the 2020 base. Chicago’s 0.4% slip is minor, and the Chicago metro area is within 1,848 residents of its July 2020 population.
The Latest Year, County and Metro View
In the year to July 2025, the sharpest numeric declines occurred in counties that are home to some of the country’s largest cities.
| County | State | Decline 2024-25 |
|---|---|---|
| Los Angeles | CA | -53,934 |
| Pinellas | FL | -11,834 |
| Miami-Dade | FL | -10,115 |
| Queens | NY | -8,852 |
| Orange | CA | -8,520 |
| San Diego | CA | -5,294 |
| Shelby (Memphis) | TN | -5,212 |
| Kings (Brooklyn) | NY | -4,694 |
| Dallas | TX | -2,616 |
Among the 25 largest metro areas, only three shrank: Los Angeles (-62,454, or -0.5%), Miami (-8,909, or -0.1%) and San Diego (-5,294, or -0.2%). A Brookings analysis found that five metros moved from gain to loss in 2024 to 2025 (Los Angeles, Miami, San Diego, Memphis and Buffalo), while Pittsburgh’s decline deepened. Border metros were hit hard: El Centro, California, swung from +1.2% to -0.7%, Laredo from +3.2% to +0.2%, and Yuma from +3.3% to +1.4%.
Why Residents Are Leaving
The Census Bureau splits change into natural change, net international migration (NIM) and net domestic migration. For the largest counties, those components moved in opposite directions.
| County size | Domestic migration per 1,000 | International migration per 1,000 2023-24 | International migration per 1,000 2024-25 | Natural change per 1,000 2024-25 |
|---|---|---|---|---|
| 1 million or more | -6.27 | 13.44 | 6.27 | 3.42 |
| 50,000 to 999,999 | +2.66 | 6.44 | 2.91 | 1.25 |
| 15,000 to 49,999 | +3.08 | 2.61 | 1.10 | -1.87 |
| Under 15,000 | +1.12 | 2.14 | 0.92 | -2.89 |
The largest counties are international gateways with positive natural increase, which means they gain people from abroad and from births while losing residents to other parts of the country. When NIM halved, from 13.44 to 6.27 per 1,000, the domestic outflow of -6.27 per 1,000 was no longer offset, and some counties turned negative.
Census demographer George Hayward said these counties gain large numbers of international migrants and lose residents through domestic migration, so fewer arrivals turned growth into loss. In Los Angeles County, domestic out-migration was about 105,000 in 2025, according to the Los Angeles Times, up from 99,629 a year earlier.
A second pattern is natural decrease. In 2025, 2,055 of 3,143 counties (65%) had more deaths than births, concentrated in smaller and older places. For cities that sit in such regions, aging is a slower but more durable pull on population than any one year of migration. Housing costs, public safety, local economies and climate risk are often cited as reasons residents move, but the Census Bureau’s estimates measure how many people move, not why, and each city’s explanation needs local evidence.
Decline Is Not the Same as Distress
Some shrinking cities are among the country’s richest and most expensive. San Francisco lost 5.6% since 2020, yet its metro area gained 6,607 residents in 2024 to 2025 and is posting a rebound in recent years. Others, such as St. Louis (278,144) and New Orleans (362,154), combine population loss with long-run fiscal stress. The two groups need different readings. A city can lose people because housing is expensive and jobs remain strong, or because jobs and services have eroded. Population change alone cannot separate them.
Can the Trend Reverse?
There are documented reversals. Detroit, Pittsburgh, and Cincinnati each posted gains since 2020 after decades of losses, and Chicago and its metro area have been flat or slightly positive for three years. In the New York metro area, outer-edge places such as Port Chester (+4.1%) grew while the city shrank, showing that some of the movement is relocation within the region. Reversal at the metro level requires either renewed immigration, which fell by roughly half nationally in a year, or housing and jobs that retain domestic movers.
Conclusion
The cities losing population are not one group. The largest losses in absolute terms belong to immigrant gateways such as New York, Los Angeles and Philadelphia, where the 2025 collapse in international migration did the most damage.
The largest percentage losses belong to St. Louis, San Francisco and New Orleans, for very different reasons. And some of the cities long associated with decline are now growing. The next estimates will show whether 2025 was a one-year migration shock or a new, lower level of growth for big cities.
Frequently Asked Questions
1. Which US cities are losing the most population?
By number since 2020: New York (-166,559), San Francisco (-49,060), Los Angeles (-27,384), Philadelphia (-26,456), and St. Louis (-22,158).
2. Why are some American cities shrinking?
Census data show lower international migration, domestic out-migration from large counties, and in older regions, more deaths than births. The reasons behind individual moves are not measured in the estimates.
3. What is a shrinking city?
There is no official Census definition. Here it means an incorporated city with fewer residents in July 2025 than at the April 2020 estimates base.
4. Are Rust Belt cities still losing residents?
Some are, such as St. Louis, Milwaukee, Cleveland and Toledo. Others, including Detroit, Columbus, Indianapolis and Pittsburgh, have grown since 2020.
5. Does population decline always mean economic decline?
No. San Francisco shrank 5.6% since 2020 while remaining a leading economy. Population and economic strength are separate measures.
6. Can a city lose population while its metro area grows?
Yes. New York City lost 12,196 residents in the latest year while its metro area gained 32,361, and Chicago city is slightly smaller while its metro area is near its 2020 level.
7. How does an aging population affect city population?
Older age structures bring more deaths than births. In 2025, 65% of US counties had a natural decrease, compared with positive natural increase (3.42 per 1,000) in counties of 1 million or more.
8. Can population decline be reversed?
Examples exist. Detroit’s estimate is about 10,700 above its 2020 base after falling roughly 65% from its 1950 peak, but a durable reversal depends on housing, jobs, and migration.
9. Which state has the most shrinking big cities?
California, with seven of the 27 shrinking cities among the 100 largest.
10. Did Los Angeles shrink more than New York?
Not in the city count. New York lost 166,559 since 2020 and Los Angeles 27,384, though Los Angeles County had the largest one-year decline of any county in 2024 to 2025.
Sources
- U.S. Census Bureau, “Slow Growth Impacts Nation’s Largest Counties Hardest,” press release CB26-56, March 26, 2026.
- The Facts Institute, “100 Most Populous US Cities” (Census Vintage 2025 compilation used for city change calculations).
- Business Stats, “The 25 Largest US Metro Areas in 2025.”
- Brookings Institution, “An immigration slowdown led to widespread declines in population growth in America’s major metro areas.”
- Los Angeles Times via Governing, “California’s Two Biggest Cities Are Heading in Different Directions,” May 15, 2026.
- U.S. Census Bureau, decennial census counts for Detroit, 1950 and 2020.