Key Facts & Findings
- New York has been the largest US city at every census from 1900 to 2020 and in the 2025 estimate.
- Only three of the 1900 top 10 (New York, Chicago, Philadelphia) were still in the top 10 in 2020.
- In 1900, eight of the 10 largest cities were in the Northeast or Midwest; in 2020, three were.
- Detroit fell 65.4% from its 1950 peak of 1,849,568 to 639,111 in 2020, and has risen slightly since.
- Phoenix grew about 290 times between 1900 and 2020, from 5,544 to 1,608,139.
- Four Texas cities (Houston, San Antonio, Dallas and Fort Worth) are in the 2025 top 10, against none in 1900.
- No official 2027 count exists; the latest figures are estimates for July 1, 2025.
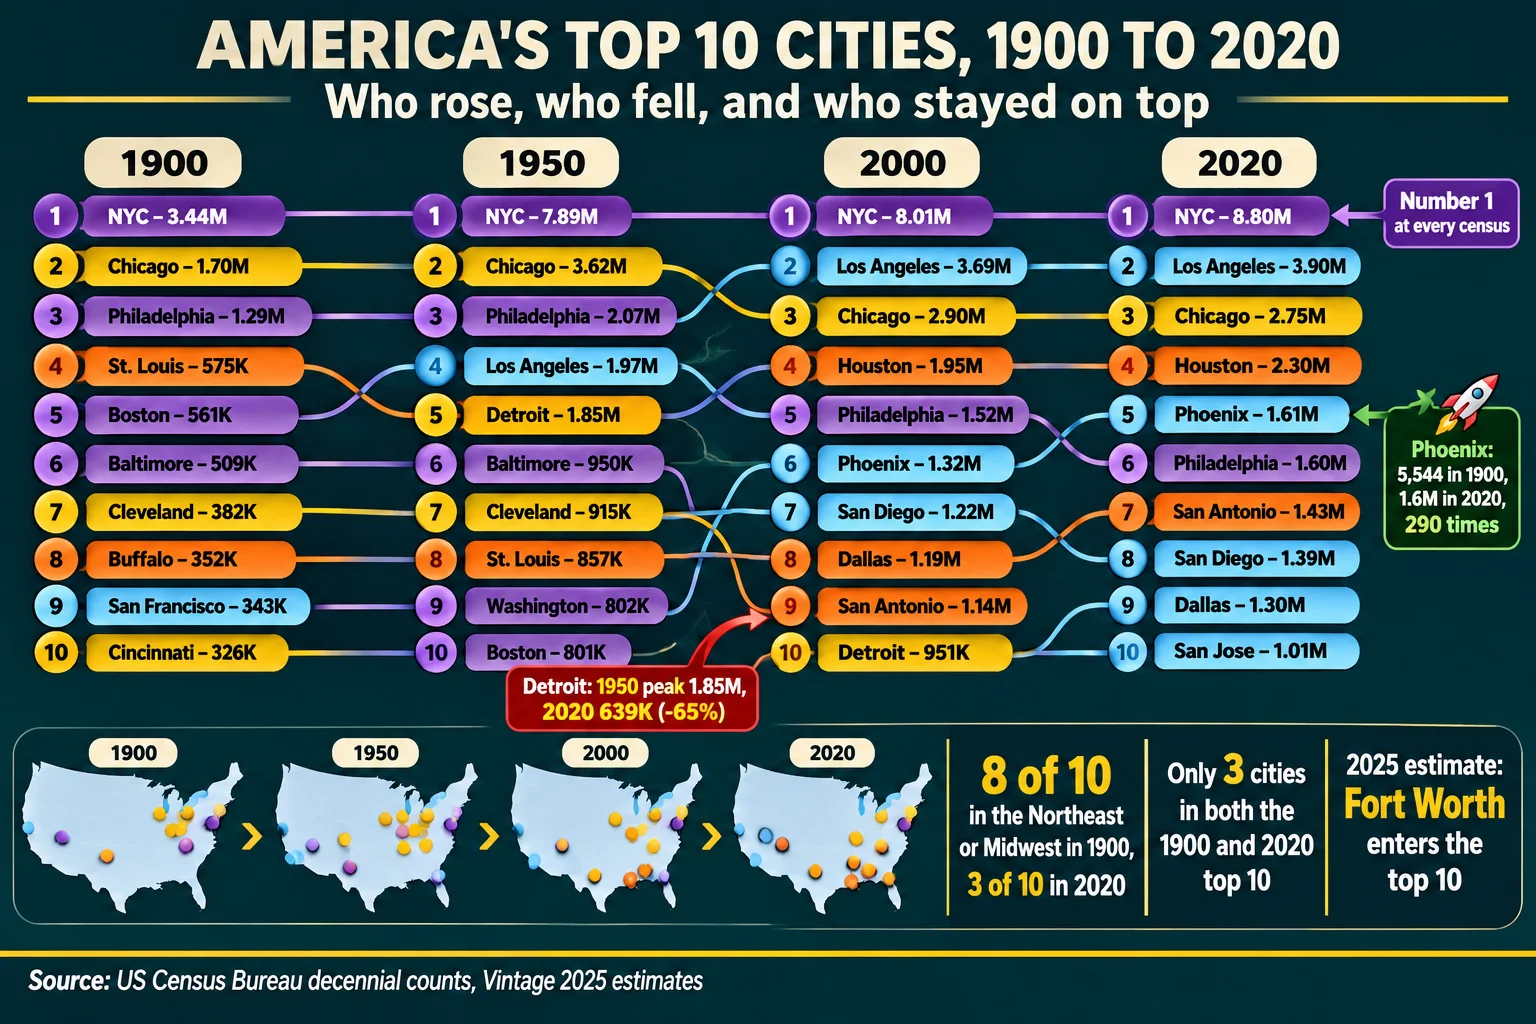
In 1900, St. Louis was the fourth largest city in the United States, ahead of Boston, Baltimore, and every city west of the Mississippi except San Francisco. By the 2020 Census, only three of that year’s top 10 cities (New York, Chicago and Philadelphia) were still in the top 10, and three of the new ones, Houston, Phoenix and San Antonio, had been towns of 5,000 to 53,000 people at the turn of the century. Phoenix alone grew from 5,544 residents in 1900 to 1,608,139 in 2020, roughly 290 times larger.
This article reconstructs the ranking of incorporated cities at four anchor censuses (1900, 1950, 2000 and 2020) and compares each with the Census Bureau’s latest estimate, Vintage 2025 for July 1, 2025. There is no 2027 count: the next decennial census is in 2030, and any 2027 figure will be an estimate. Historical figures are decennial counts within each city’s boundaries at the time. Boundaries changed, sometimes dramatically (New York consolidated its five boroughs in 1898, and Jacksonville merged with Duval County in 1968), so comparisons over a century are approximate.
Data Snapshot
| Metric | Figure |
|---|---|
| Largest city in 1900, 1950, 2000, 2020 and 2025 | New York in every year |
| New York population, 1900 | 3,437,202 |
| New York population, 2020 Census | 8,804,190 (+156% since 1900) |
| 1900 top-10 cities still in the 2020 top 10 | 3 (New York, Chicago, Philadelphia) |
| 1950 top-10 cities still in the 2020 top 10 | 4 (New York, Chicago, Philadelphia, Los Angeles) |
| Detroit’s drop from 1950 peak to 2020 | -65.4% |
| Phoenix growth, 1900 to 2020 | about 290 times |
The Top 10 at Four Anchor Censuses
| Rank | 1900 | 1950 | 2000 | 2020 |
|---|---|---|---|---|
| 1 | New York | New York | New York | New York |
| 2 | Chicago | Chicago | Los Angeles | Los Angeles |
| 3 | Philadelphia | Philadelphia | Chicago | Chicago |
| 4 | St. Louis | Los Angeles | Houston | Houston |
| 5 | Boston | Detroit | Philadelphia | Phoenix |
| 6 | Baltimore | Baltimore | Phoenix | Philadelphia |
| 7 | Cleveland | Cleveland | San Diego | San Antonio |
| 8 | Buffalo | St. Louis | Dallas | San Diego |
| 9 | San Francisco | Washington | San Antonio | Dallas |
| 10 | Cincinnati | Boston | Detroit | San Jose |
The 2025 estimate keeps the same first nine as 2020 and replaces San Jose with Fort Worth at 10th. San Jose is now 13th.
Region by Region
The composition of the top 10 by Census region shows the shift most clearly.
| Year | Northeast | Midwest | South | West |
|---|---|---|---|---|
| 1900 | 4 | 4 | 1 | 1 |
| 1950 | 3 | 4 | 2 | 1 |
| 2000 | 2 | 2 | 3 | 3 |
| 2020 | 2 | 1 | 3 | 4 |
In 1900, eight of the ten largest cities were in the Northeast or Midwest. By 2020, the figure was three. The 2025 list moves one more step in the same direction, with four Texas cities in the top 10.
1900 to 1950, the Industrial City at Its Peak
The 1900 hierarchy reflects rail, ports, and factories. New York (3,437,202), Chicago (1,698,575) and Philadelphia (1,293,697) were followed by St. Louis (575,238), Boston (560,892), Baltimore (508,957), Cleveland (381,768), Buffalo (352,387), San Francisco (342,782) and Cincinnati (325,902). Los Angeles had 102,479 residents and Houston 44,633.
By 1950, the industrial cities had peaked. Chicago had reached 3,620,962 (more than double its 1900 figure), Detroit stood at 1,849,568 in fifth place after the automobile boom, and Cleveland, St. Louis and Baltimore all hit historic highs of 914,808, 856,796 and 949,708. Los Angeles, at 1,970,358, was already fourth.
1950 to 2000, Suburbs and the First Sun Belt Surge
Postwar suburban growth pulled residents out of older cities even as national population soared. Between 1950 and 2000, Detroit fell to 951,270, St. Louis to 348,189, and Philadelphia to 1,517,550, while Houston (1,953,631), Phoenix (1,321,045), San Diego (1,223,400), Dallas (1,188,580), and San Antonio (1,144,646) all entered the top 10. Detroit hung on at 10th. New York dipped below its 1950 peak and then recovered to 8,008,278 in 2000.
2000 to 2020, the Sun Belt Consolidates
By 2020, Houston had 2,304,580 residents, Phoenix 1,608,139 (passing Philadelphia’s 1,603,797 for fifth place in the Census count), and San Jose (1,013,240) replaced Detroit as 10th. Detroit had fallen to 639,111. The 2020 Census also showed New York at 8,804,190, its highest count ever.
2025, the Latest Estimate
Vintage 2025 puts New York at 8,584,629 (below its 2020 Census count of 8,804,190), Los Angeles at 3,869,089, and Chicago at 2,731,585. Houston (2,397,315) and Phoenix (1,665,481) hold fourth and fifth, and Fort Worth (1,028,117) has overtaken Jacksonville to enter the top 10. Estimates are revised in each vintage, and these figures use boundaries as of January 1, 2025.
Population Trajectories of Ten Cities
| City | 1900 | 1950 | 2000 | 2020 Census | 2025 estimate |
|---|---|---|---|---|---|
| New York | 3,437,202 | 7,891,957 | 8,008,278 | 8,804,190 | 8,584,629 |
| Chicago | 1,698,575 | 3,620,962 | 2,896,016 | 2,746,388 | 2,731,585 |
| Philadelphia | 1,293,697 | 2,071,605 | 1,517,550 | 1,603,797 | 1,574,281 |
| Los Angeles | 102,479 | 1,970,358 | 3,694,820 | 3,898,747 | 3,869,089 |
| Houston | 44,633 | 596,163 | 1,953,631 | 2,304,580 | 2,397,315 |
| Phoenix | 5,544 | 106,818 | 1,321,045 | 1,608,139 | 1,665,481 |
| Detroit | 285,704 | 1,849,568 | 951,270 | 639,111 | 649,095 |
| St. Louis | 575,238 | 856,796 | 348,189 | 301,578 | 278,144 |
The 2025 column holds Vintage 2025 estimates, which are not directly comparable to decennial counts because of methodology and boundary adjustments.
Cities That Rose
Using 1950 and 2020 Census counts, the Sun Belt’s multiples are striking.
| City | 1950 | 2020 | Multiple |
|---|---|---|---|
| Phoenix | 106,818 | 1,608,139 | 15.1 times |
| Jacksonville | 204,275 | 949,611 | 4.6 times |
| San Diego | 334,387 | 1,386,932 | 4.1 times |
| Houston | 596,163 | 2,304,580 | 3.9 times |
| San Antonio | 408,442 | 1,434,625 | 3.5 times |
| Dallas | 434,462 | 1,304,379 | 3.0 times |
Some of the increase reflects annexation. Houston, Phoenix, and San Antonio expanded their boundaries repeatedly, and Jacksonville’s 1968 consolidation with Duval County is a boundary change as much as a population one. The figures therefore measure political geography along with demographic growth.
Cities That Fell
| City | Peak (1950) | 2020 Census | Change from peak |
|---|---|---|---|
| Detroit | 1,849,568 | 639,111 | -65.4% |
| St. Louis | 856,796 | 301,578 | -64.8% |
| Cleveland | 914,808 | 372,624 | -59.3% |
| Pittsburgh | 676,806 | 302,971 | -55.2% |
| Buffalo | 580,132 | 278,349 | -52.0% |
| Baltimore | 949,708 | 585,708 | -38.3% |
| Chicago | 3,620,962 | 2,746,388 | -24.2% |
| Philadelphia | 2,071,605 | 1,603,797 | -22.6% |
The 2025 estimates show these places splitting. Detroit (649,095), Pittsburgh (307,632), and Cincinnati (314,367) have gained since 2020, while St. Louis (278,144), Cleveland (363,608), and Buffalo (274,613) continued to slip.
Why the Order Changed
Industrialization built the 1900 ranking around rail hubs, ports, and heavy industry. The automobile and highways then allowed the postwar suburban movement, and between 1950 and 2020 central cities in the Northeast and Midwest lost large shares of their populations to surrounding municipalities. Manufacturing decline compounded the drop in Detroit, Cleveland, Buffalo and Pittsburgh.
Meanwhile, air conditioning, defense and energy industries, cheaper land, and annexation powered the Sun Belt. Immigration since 1970 helped New York and Los Angeles recover from midcentury losses, which is why New York’s population reached 8.8 million in 2020 even though many of its older neighbors had fallen by more than half. Each of these explanations has been documented by historians and demographers, but their relative weights differ by city.
How Comparable Are Historical Rankings?
Not perfectly. Cities rank by incorporated boundaries, and those boundaries moved. New York’s 1900 count already reflected the 1898 consolidation, whereas Boston and Detroit remained largely within their older limits, so suburban growth around them does not count.
Consolidated city-county governments (Jacksonville, Nashville, Louisville) changed their statistical definitions after the 1950s. Decennial counts are also not the same as the annual estimates, which are revised each vintage. And the Census undercount of certain groups varied across decades. Rankings by metropolitan area, which are covered in a separate article, avoid some of these issues but have their own definitional changes.
Conclusion
The century-long story is a change in the center of gravity, not a change in the top. New York has never lost first place, and Chicago and Philadelphia have remained in the top 10 even after losing a quarter of their peak populations. What changed is everything behind them: St. Louis, Boston, Baltimore, Cleveland, Buffalo, San Francisco, and Cincinnati left the top 10 while Houston, Phoenix, and San Antonio, which barely registered in 1900, arrived. Detroit and Cleveland show how far a city can fall, and the 2025 estimates show the long slide flattening in several of them.
Frequently Asked Questions
1. What were the largest cities in America in 1900?
New York (3,437,202), Chicago (1,698,575), Philadelphia (1,293,697), St. Louis (575,238), and Boston (560,892) led, followed by Baltimore, Cleveland, Buffalo, San Francisco, and Cincinnati.
2. Which US city was the largest in 1950?
New York, with 7,891,957 residents, followed by Chicago (3,620,962) and Philadelphia (2,071,605). Los Angeles (1,970,358) was fourth.
3. How have American city rankings changed since 1900?
The Northeast and Midwest dominated in 1900. By 2020, the West and South held seven of the top 10 places, with Houston, Phoenix, and San Antonio replacing St. Louis, Boston, Baltimore, Cleveland, Buffalo, San Francisco, and Cincinnati.
4. Which US cities have grown the most since 1900?
In percentage terms, Phoenix (about 290 times), Houston (about 52 times), and Los Angeles (about 38 times) are among the largest increases among the cities in this comparison.
5. Which major cities have lost the most population?
Measured from their 1950 peaks, Detroit (-65.4%), St. Louis (-64.8%), and Cleveland (-59.3%).
6. When did Sun Belt cities begin rising in the rankings?
The surge was visible by 1950 to 2000, when Houston, Phoenix, San Diego, Dallas, and San Antonio all entered the top 10.
7. Are historical city population rankings directly comparable?
Only roughly. Boundaries, annexations, consolidations, and undercounts differ across decades, so changes of a few percent are less meaningful than shifts of several hundred percent.
8. Are 2027 US city populations official Census counts?
No. The next count is the 2030 Census, and any 2027 city figure will be an estimate from the Population Estimates Program.
9. When did Detroit fall out of the top 10?
Detroit was still 10th in 2000 (951,270), and by the 2010 Census it was no longer in the top 10.
10. Is New York’s population still growing?
Over the long run yes, from 3.4 million in 1900 to 8.8 million in 2020. The 2025 estimate (8,584,629) is lower than the 2020 count.
Sources
- U.S. Census Bureau, decennial census population counts for incorporated places, 1900, 1950, 2000 and 2020 (historical tables of the 100 largest cities and decennial census results).
- U.S. Census Bureau, 1900 Census urban population bulletin.
- U.S. Census Bureau, “Population Growth Holds Steady in Midsized Cities Amid Widespread Slowdown,” press release CB26-80 (Vintage 2025), May 14, 2026.
- The Facts Institute, “100 Most Populous US Cities” (Vintage 2025 compilation).