
Key Findings
- The US median age is 39.4, up from 38.6 in 2020 and 35.3 in 2000.
- Women’s median age (40.7) is 2.6 years higher than men’s (38.1).
- Maine (44.9) and Utah (32.6) are 12.3 years apart.
- Counties range from a median age of 22.1 to 70.1; 75% of counties are at or above the national median.
- The 65-and-older population grew 16.2% since 2020, while children fell 2.4%.
- The Weldon Cooper Center projects a national median of 41.9 by 2050.
- Utah’s youth reflects children (26.1% under 18); DC’s reflects young adults.
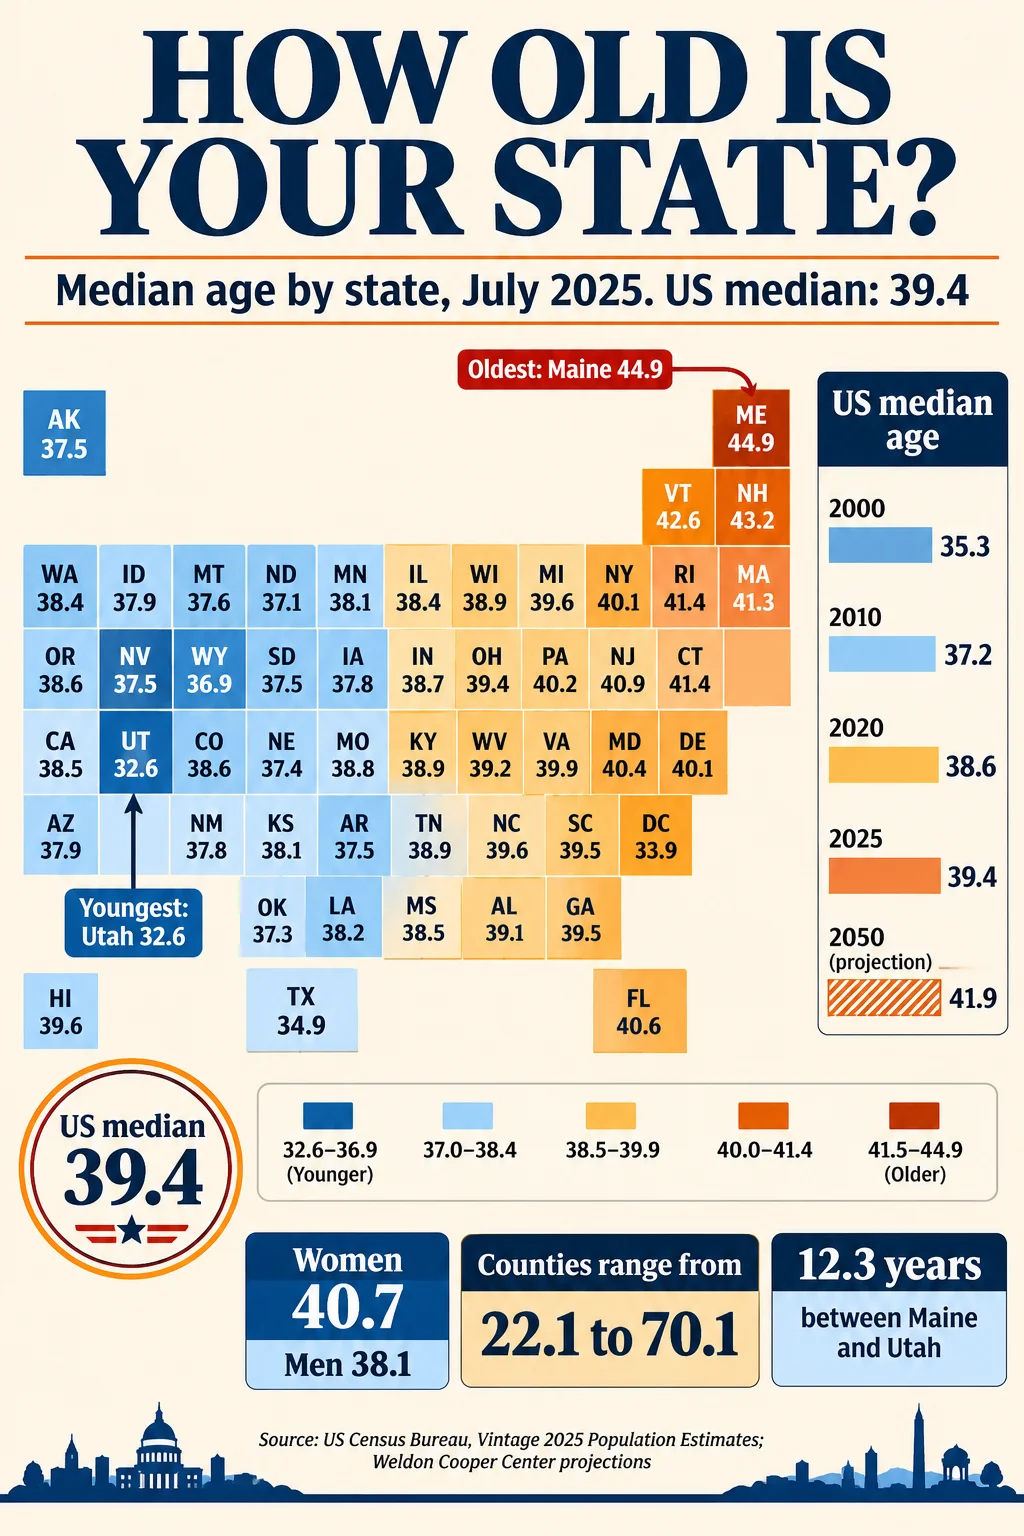
Half of all Americans are now older than 39.4 years, the highest median age the Census Bureau has recorded. The figure rose from 38.6 in April 2020 to 39.2 in July 2024 and 39.4 in July 2025, according to the Vintage 2025 estimates released June 25, 2026. Behind that national number sits a 12.3-year gap between Maine (44.9) and Utah (32.6), and a county range that runs from 22.1 to 70.1.
The median age is the age at which exactly half the population is younger, and half is older. With 341,784,857 residents on July 1, 2025, that means about 170.9 million people are under 39.4 and about 170.9 million are over it.
Note: This article uses Census Bureau Vintage 2025 national estimates, state figures from the same vintage as compiled by Population Pyramids, and long-run projections from the Census Bureau and the University of Virginia’s Weldon Cooper Center. Estimates from different vintages are labeled, because every release revises earlier years.
Data Snapshot
| Metric | Figure | Date |
|---|---|---|
| US median age | 39.4 years | July 1, 2025 |
| Women | 40.7 years | July 1, 2025 |
| Men | 38.1 years | July 1, 2025 |
| Oldest state | Maine, 44.9 | July 1, 2025 |
| Youngest state | Utah, 32.6 | July 1, 2025 |
| County range | 22.1 to 70.1 | July 1, 2025 |
| Counties at or above the national median | 2,360 of 3,144 (75%) | July 1, 2025 |
| Projected US median age, 2050 | 41.9 years | Weldon Cooper Center, 2026 |
How the National Median Has Moved
| Year | Both sexes | Men | Women | Gap |
|---|---|---|---|---|
| 2000 Census | 35.3 | 34.0 | 36.5 | 2.5 |
| 2010 Census | 37.2 | 35.8 | 38.5 | 2.7 |
| April 2020 estimates base | 38.6 | 37.4 | 39.8 | 2.4 |
| July 2024 | 39.2 | 37.9 | 40.5 | 2.5 |
| July 2025 | 39.4 | 38.1 | 40.7 | 2.6 |
The 2020 and 2024 figures by sex are calculations from single-year-of-age data by Business Stats, which reproduce the published 2025 medians exactly. Over 25 years, the national median rose 4.1 years, from 35.3 to 39.4, and the male and female medians climbed at almost the same pace (4.1 and 4.2 years). The 2.6-year gap between women and men reflects longer female lives: the Census Bureau reports the gap widened from 2.39 years in 2020 to 2.55 in 2025.
Why the Median Keeps Rising
Three population changes between April 2020 and July 2025 explain most of the rise.
| Age group | April 2020 | July 2025 | Change | Percent |
|---|---|---|---|---|
| Under 18 | 73,822,227 | 72,021,348 | -1,800,879 | -2.4% |
| 18 to 24 | 31,271,950 | 31,936,859 | +664,909 | +2.1% |
| 25 to 44 | 86,789,265 | 91,885,062 | +5,095,797 | +5.9% |
| 45 to 64 | 84,004,580 | 81,324,500 | -2,680,080 | -3.2% |
| 65 and older | 55,628,091 | 64,617,088 | +8,988,997 | +16.2% |
The 65-and-older group supplied 9.0 million of the nation’s 10.3 million additional residents, or 87.5% of growth. Children shrank by 1.8 million, which the Census Bureau links to the long decline in fertility: the total fertility rate fell from 2.11 births per woman in 2001 to 1.63 in 2024. When the bottom of the age distribution thins and the top thickens, the middle point moves upward even if no one is aging faster than before. Immigration and the arrival of young adults slow the rise but have not stopped it.
The Regional Picture
The latest regional medians available in this vintage family come from the 2024 estimates:
| Region | Median age, 2024 (Vintage 2024) |
|---|---|
| Northeast | 40.6 |
| Midwest | 39.3 |
| South | 38.8 |
| West | 38.4 |
The South and West are younger, but the South is the only region whose population under 18 grew between 2020 and 2025 (+1.1%), while the Northeast (-4.1%), Midwest (-3.9%) and West (-5.7%) lost children. The Northeast’s 45-to-64 population fell 7.1%, the steepest decline of any region.
Median Age by State, July 2025
The full state distribution, with the age structure behind each median, is below. The 65-and-older and under-18 shares are rounded to one decimal place. Ties share a rank.
| Rank | State | Median age | Under 18 | 65 and older | Population, July 2025 |
|---|---|---|---|---|---|
| 1 | Maine | 44.9 | 17.3% | 24.6% | 1,414,874 |
| 2 | Vermont | 44.4 | 17.0% | 24.1% | 644,663 |
| 3 | New Hampshire | 44.1 | 17.3% | 23.0% | 1,415,342 |
| 4 | West Virginia | 43.2 | 19.5% | 22.5% | 1,766,147 |
| 5 | Florida | 43.1 | 18.9% | 22.8% | 23,462,518 |
| 6 | Delaware | 42.3 | 19.8% | 22.8% | 1,059,952 |
| 7 | Hawaii | 42.1 | 19.7% | 22.6% | 1,432,820 |
| 8 | Connecticut | 41.4 | 19.5% | 20.4% | 3,688,496 |
| 8 | Pennsylvania | 41.4 | 19.7% | 21.4% | 13,059,432 |
| 10 | Montana | 41.2 | 20.2% | 22.2% | 1,144,694 |
| 10 | Rhode Island | 41.2 | 17.7% | 20.9% | 1,114,521 |
| 12 | Oregon | 41.1 | 19.0% | 21.0% | 4,273,586 |
| 12 | South Carolina | 41.1 | 20.6% | 21.1% | 5,570,274 |
| 14 | Wisconsin | 41.0 | 20.5% | 20.8% | 5,972,787 |
| 15 | Michigan | 40.7 | 20.4% | 20.5% | 10,127,884 |
| 16 | Massachusetts | 40.4 | 18.6% | 19.9% | 7,154,084 |
| 17 | Wyoming | 40.2 | 21.6% | 20.7% | 588,753 |
| 18 | New Jersey | 40.1 | 20.9% | 18.5% | 9,548,215 |
| 18 | New Mexico | 40.1 | 20.7% | 21.1% | 2,125,498 |
| 18 | Ohio | 40.1 | 21.3% | 20.2% | 11,900,510 |
| 21 | Alabama | 39.8 | 21.5% | 19.4% | 5,193,088 |
| 21 | Maryland | 39.8 | 21.3% | 18.4% | 6,265,347 |
| 21 | New York | 39.8 | 19.5% | 19.3% | 20,002,427 |
| 24 | Illinois | 39.7 | 20.6% | 18.7% | 12,719,141 |
| 25 | Mississippi | 39.6 | 22.3% | 19.3% | 2,954,160 |
| 25 | Missouri | 39.6 | 21.7% | 19.6% | 6,270,541 |
| 25 | Nevada | 39.6 | 20.7% | 18.3% | 3,282,188 |
| 28 | Kentucky | 39.5 | 22.1% | 18.8% | 4,606,864 |
| 28 | North Carolina | 39.5 | 21.1% | 18.9% | 11,197,968 |
| 30 | Arizona | 39.4 | 21.0% | 20.6% | 7,623,818 |
| 30 | Minnesota | 39.4 | 22.0% | 19.1% | 5,830,405 |
| 30 | Virginia | 39.4 | 20.9% | 18.4% | 8,880,107 |
| 33 | Iowa | 39.3 | 22.2% | 20.1% | 3,238,387 |
| 34 | Tennessee | 39.2 | 21.5% | 18.6% | 7,315,076 |
| 35 | Arkansas | 39.0 | 22.4% | 19.0% | 3,114,791 |
| 35 | Louisiana | 39.0 | 22.7% | 18.8% | 4,618,189 |
| 37 | Washington | 38.8 | 20.4% | 18.3% | 8,001,020 |
| 38 | California | 38.7 | 20.8% | 17.5% | 39,355,309 |
| 39 | Indiana | 38.6 | 22.6% | 18.4% | 6,973,333 |
| 40 | South Dakota | 38.4 | 23.5% | 19.4% | 935,094 |
| 41 | Georgia | 38.2 | 22.2% | 16.7% | 11,302,748 |
| 42 | Kansas | 38.1 | 22.9% | 18.9% | 2,977,220 |
| 43 | Colorado | 38.0 | 20.3% | 17.1% | 6,012,561 |
| 44 | Idaho | 37.9 | 23.3% | 18.7% | 2,029,733 |
| 45 | Oklahoma | 37.7 | 23.2% | 18.0% | 4,123,288 |
| 46 | Nebraska | 37.5 | 23.7% | 18.3% | 2,018,006 |
| 47 | Alaska | 36.7 | 23.3% | 15.8% | 737,270 |
| 48 | North Dakota | 36.5 | 22.9% | 17.9% | 799,358 |
| 49 | Texas | 36.0 | 24.0% | 14.9% | 31,709,821 |
| 50 | District of Columbia | 35.0 | 17.9% | 13.6% | 693,645 |
| 51 | Utah | 32.6 | 26.1% | 13.0% | 3,538,904 |
Twenty-nine of the 51 jurisdictions (50 states and DC) sit above the national median of 39.4, three (Arizona, Minnesota and Virginia) equal it, and 19 are below. The oldest five are Maine (44.9), Vermont (44.4), New Hampshire (44.1), West Virginia (43.2), and Florida (43.1). The youngest are Utah (32.6), the District of Columbia (35.0), Texas (36.0), North Dakota (36.5), and Alaska (36.7).
The Ten Oldest States
| Rank | State | Median age | 65 and older |
|---|---|---|---|
| 1 | Maine | 44.9 | 24.6% |
| 2 | Vermont | 44.4 | 24.1% |
| 3 | New Hampshire | 44.1 | 23.0% |
| 4 | West Virginia | 43.2 | 22.5% |
| 5 | Florida | 43.1 | 22.8% |
| 6 | Delaware | 42.3 | 22.8% |
| 7 | Hawaii | 42.1 | 22.6% |
| 8 | Pennsylvania | 41.4 | 21.4% |
| 8 | Connecticut | 41.4 | 20.4% |
| 10 | Montana | 41.2 | 22.2% |
The Ten Youngest States
| Rank (1 is youngest) | State | Median age | Under 18 |
|---|---|---|---|
| 1 | Utah | 32.6 | 26.1% |
| 2 | District of Columbia | 35.0 | 17.9% |
| 3 | Texas | 36.0 | 24.0% |
| 4 | North Dakota | 36.5 | 22.9% |
| 5 | Alaska | 36.7 | 23.3% |
| 6 | Nebraska | 37.5 | 23.7% |
| 7 | Oklahoma | 37.7 | 23.2% |
| 8 | Idaho | 37.9 | 23.3% |
| 9 | Colorado | 38.0 | 20.3% |
| 10 | Kansas | 38.1 | 22.9% |
Maine’s median age is the highest, though it is also the only state whose median age has fallen since 2020, according to the Maine State Economist’s reading of the Vintage 2025 data. That narrowed its distance from the national figure. The county range is far wider than the state range: the youngest county has a median of 22.1 and the oldest 70.1, and counties with large universities or military bases tend to be the youngest.
Two Kinds of Young
States with low medians are young for different reasons. Utah’s median age is 32.6 because 26.1% of its residents are under 18, the highest share in the country, and only 13.0% are 65 or older. The District of Columbia’s median of 35.0 comes instead from a small child population (17.9%) and many young adults. Colorado, at 38.0, has a below-average share of children (20.3%) and a relatively small older population (17.1%). The median compresses these different shapes into one number, so two places with the same median can have very different school and retirement needs.
What the Projections Say
| Source | Projection | Year |
|---|---|---|
| Weldon Cooper Center (2026) | Median age 38.8 in 2020, rising to 41.9 | 2050 |
| Weldon Cooper Center (2026) | 65 and older: 21.2% of the population, about 78 million | 2050 |
| Census Bureau 2023 projections | 65 and older: 82 million, about 23% | 2050 |
| Census Bureau 2023 projections | Median age 47.9 (women 49.1, men 46.8) | 2100 |
The Weldon Cooper Center and Census Bureau series use different bases and assumptions, which explains the 78 million versus 82 million figures for people 65 and older in 2050. The Census Bureau’s projections date from 2023 and were built on earlier population estimates. Both show the median continuing to rise, but at a slower pace than in the early 2000s, because the large baby boom cohort is aging into a period in which deaths rise.
Conclusion
The median age moved 0.2 years in the most recent year, a pace that seems small until it is multiplied across states and decades. At 39.4, it is 4.1 years above its 2000 level, and the projections point to roughly 42 by 2050. The more useful finding is the spread beneath it: Maine and Vermont have median ages near 44, Utah has one near 33, and the difference comes from how many children and older adults each place has.
Frequently Asked Questions
1. What is the median age in the United States?
39.4 years as of July 1, 2025, according to Census Bureau Vintage 2025 estimates.
2. What does median age mean?
It is the age that divides the population into two equal halves. About 170.9 million Americans are younger than 39.4, and about 170.9 million are older.
3. Which state has the highest median age?
Maine, at 44.9 years in 2025, followed by Vermont (44.4) and New Hampshire (44.1).
4. Which state has the lowest median age?
Utah, at 32.6 years, followed by Texas (36.0), North Dakota (36.5), and Alaska (36.7). The District of Columbia, which is not a state, has a median of 35.0.
5. Why do women have a higher median age than men?
Women live longer, so they make up a larger share of older age groups. The female median was 40.7 and the male median 38.1 in 2025.
6. How much has the median age risen since 2000?
From 35.3 at the 2000 Census to 39.4 in 2025, an increase of 4.1 years.
7. Is the median age the same as the average age?
No. The median is the middle value; the average (mean) adds every age and divides by the population. In an aging population with a long tail of older people, the two differ.
8. What will the median age be in 2050?
The Weldon Cooper Center projects 41.9 years in 2050. The Census Bureau’s 2023 series projects 47.9 by 2100.
9. Which region has the oldest population?
The Northeast, with a 2024 median of 40.6, compared with 38.4 in the West.
10. What is the highest county median age?
70.1 years in 2025, compared with 22.1 in the youngest county.
Sources
- U.S. Census Bureau, “Populations in All Age Groups Growing in the South, Driven by Outlying Counties in Metro Areas,” press release CB26-105 (Vintage 2025), June 25, 2026.
- Business Stats, “How Many Adults Live in the US” (median age by sex and calculations from Census single-year-of-age data), 2026.
- Population Pyramids, “Oldest States in the US by Median Age, 2025” and “Youngest States in the US by Median Age, 2025” (Census Vintage 2025 state data).
- SmartAsset via Boston 25 News, “US population trends by state,” September 17, 2026 (state populations, July 2025).
- Maine Office of the State Economist, Vintage 2025 summary.
- University of Virginia Weldon Cooper Center, “U.S. Population Projected to Grow More Slowly through 2050,” 2026.
- U.S. Census Bureau, 2023 National Population Projections.
- Population Reference Bureau, “Fact Sheet Aging in the United States” (Census 2023 projections for 2050).