Key Fact & Findings
- The 65-and-older population is projected to reach 78 to 82 million by 2050, up from 64.6 million in 2025.
- The Census Bureau projects the 65-plus share at 23% and the under-18 share at 18% in 2050, up from 17% and 22% in 2022.
- The Weldon Cooper Center projects a median age of 41.9 in 2050, up from 38.8 in 2020.
- On illustrative 2050 totals, seniors outnumber children by 11 million to 17 million.
- The old-age dependency ratio could rise from 31.5 to about 36 to 40 per 100 working-age adults.
- CBO projects deaths exceeding births from 2030 and a fertility rate of 1.53 from 2036.
- State gaps persist: Maine remains oldest and Utah youngest in the Weldon Cooper Center’s 2050 outlook.
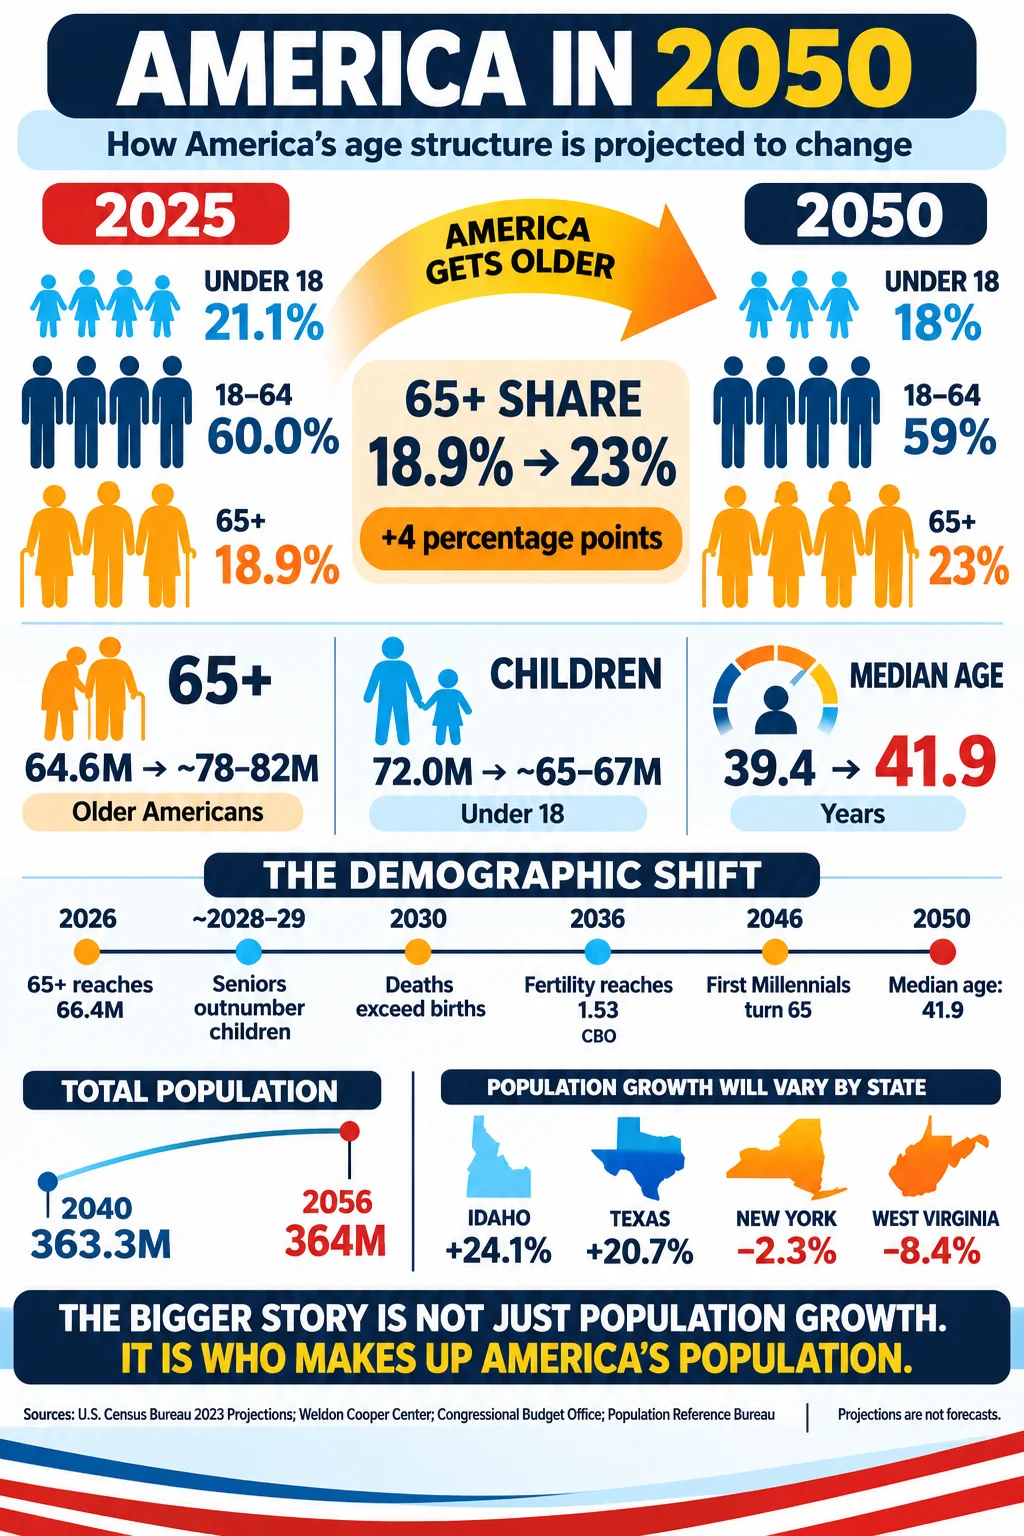
By 2050, the United States is projected to have 78 million to 82 million residents aged 65 and older and only about 65 million to 67 million under 18, reversing the 2025 balance in which children outnumber older adults by 7.4 million. The Census Bureau’s 2023 projections put the 65-and-older share at 23% in 2050, up from 17% in 2022, while the under-18 share falls from 22% to 18%. The University of Virginia’s Weldon Cooper Center projects a lower older share of 21.2% and a national median age of 41.9, up from 38.8 in 2020.
Projections describe what happens if stated assumptions about births, deaths, and migration hold. They are not forecasts. This article compares three published series, the Census Bureau’s 2023 national projections, the Weldon Cooper Center’s 2026 projections and the Congressional Budget Office’s January 2026 demographic outlook, and identifies where they agree. It adds a few simple illustrations marked as such. The 2025 baseline is the Census Bureau’s Vintage 2025 estimate: 341,784,857 residents, of whom 72,021,348 are under 18, 205,146,421 are 18 to 64, and 64,617,088 are 65 or older.
Data Snapshot
| Metric | 2025 or 2026 | 2050 projection | Source |
|---|---|---|---|
| Population aged 65 and older | 64.6 million (18.9%) | 82 million (23%) | Census Bureau 2023 projections |
| Population aged 65 and older | 64.6 million | about 78 million (21.2%) | Weldon Cooper Center 2026 |
| Share under 18 | 21.1% | 18% | Census Bureau 2023 projections |
| Median age | 39.4 | 41.9 | Weldon Cooper Center 2026 |
| Total population | 341.8 million | about 370 million | Weldon Cooper Center (2024 vintage) |
| Fertility rate | 1.63 (2024) | 1.53 from 2036 | CBO 2026 |
| Deaths exceed births from | 2030 | CBO 2026 |
Three Projection Series Compared
| Series | Producer and date | Horizon | Main age message |
|---|---|---|---|
| National projections | Census Bureau, 2023 | 2100 | 65 and older rise from 17% (2022) to 23% (2050) and 29.1% (2100); under-18 share falls from 22% to 18% (2050) and 16.4% (2100) |
| State and national projections | Weldon Cooper Center, 2026 | 2050 | Median age 41.9 in 2050; 65 and older 21.2%; Maine oldest, Utah youngest |
| Demographic outlook | CBO, January 2026 | 2056 | Population 349 million (2026) to 364 million (2056); growth slows from 0.3% to 0.1% a year; 65 and older grow about 1.6% a year through 2036 |
The series differ in their starting populations and assumptions. The Census Bureau’s 2023 series was built before the Census Bureau raised its immigration estimates for 2022 to 2024, and the Weldon Cooper Center’s 2026 series uses newer data.
CBO’s concept of population (the Social Security area population, 349 million in 2026) is also larger than the Census Bureau’s resident count (341.8 million in 2025). For these reasons, the figures should be compared in direction, not to the last decimal.
The Age Structure in 2025 and 2050
| Broad age group | Share in 2022 | Share in 2025 | Share in 2050 (Census 2023 projections) |
|---|---|---|---|
| Under 18 | 22% | 21.1% | 18% |
| 18 to 64 | 61% | 60.0% | 59% |
| 65 and older | 17% | 18.9% | 23% |
The 2022 and 2050 shares are the Census Bureau’s rounded whole numbers (the 18-to-64 share is the remainder), and the 2025 shares are Vintage 2025 estimates. Between 2022 and 2050, the older share rises 6 points, and the child share falls 4. The working-age share falls only 2 points, which is why the shift is usually described as a rise in older adults, not a loss of workers.
What the Shares Mean in People
An illustration applies the projected shares to the range of 2050 totals the three series imply. This is arithmetic, not a published projection.
| Illustrative 2050 measure | If population is 360 million | If population is 370 million |
|---|---|---|
| Under 18 at 18% | 64.8 million | 66.6 million |
| 18 to 64 at 59% | 212.4 million | 218.3 million |
| 65 and older at 23% | 82.8 million | 85.1 million |
The Census Bureau’s own projection of 82 million people aged 65 and older sits near the first column, and the Weldon Cooper Center’s 21.2% of 370 million is about 78 million. In every case, the working-age population (about 212 to 218 million) is somewhat larger than in 2025 (205.1 million), the child population is smaller than today’s 72.0 million by 5 to 7 million, and the older population is 13 to 20 million larger than today’s 64.6 million. At the extremes, seniors outnumber children by 11 million to 17 million.
The old-age dependency ratio, now 31.5 people aged 65 and older per 100 people aged 18 to 64, would rise to about 36 to 40 on those illustrative numbers, which means roughly 2.5 to 2.8 working-age adults per older person, compared with 3.2 today.
Milestones on the Way
| Year | Projected or scheduled change | Source |
|---|---|---|
| 2026 | 65 and older reach 66.4 million (+1.79 million); under 18 fall to 71.3 million | Census short-term projection |
| About 2028 to 2029 | Older adults outnumber children | Arithmetic from 2026 projection; Census 2023 series |
| 2030 | Deaths begin to exceed births; last Baby Boomers turn 66 | CBO |
| 2036 | Fertility rate 1.53 and holding; 65 and older growth of 1.6% a year ends | CBO |
| 2040 | Population 363.3 million (+6.3% from 2025) | Weldon Cooper Center, July 2026 |
| 2046 | First Millennials turn 65 | Birth-year arithmetic |
| 2050 | Median age 41.9; 65 and older 21.2% to 23% | Weldon Cooper; Census 2023 |
| 2056 | Population 364 million; growth about zero | CBO |
| Second half of century | National population begins to decline | Census Bureau 2023 projections |
The first row to watch is 2028 to 2029. Because the older population is growing about 1.8 million a year and children are shrinking about 0.7 million a year, the crossing takes place within a few years, not decades.
Where the Change Will Be Largest
Age structure will change unevenly. The Weldon Cooper Center’s July 2026 projections have the nation growing 6.3% from 2025 to 2040 but with a very wide range: Idaho +24.1%, Utah +21.9%, Texas +20.7% and Florida +19.7%, against declines in West Virginia (-8.4%), Illinois (-5.1%), Mississippi (-4.7%), Louisiana (-3.3%) and New York (-2.3%). Thirteen states have negative projected change, and Connecticut is flat. Texas and Florida alone supply 51.9% of the growth.
Today’s age gaps between states, 12.3 years in median age between Maine (44.9) and Utah (32.6), are expected to persist. The Weldon Cooper Center projects that Maine will still have the highest median age in 2050 and Utah the lowest.
States with low child shares today, such as Vermont (17.0%), Maine (17.3%), and New Hampshire (17.3%), have little room for a smaller child population to fall further. The 17 states that already have more seniors than children (by 2025 shares) will be joined by more as the 65-plus group grows.
What Could Change the Numbers
| Assumption | CBO 2026 | Why it matters |
|---|---|---|
| Fertility rate | 1.58 in 2026, 1.53 in 2036 | Smaller cohorts of children mean fewer future workers |
| Net immigration | Lower than in earlier CBO projections for 2025 to 2035 | From 2030, all projected growth comes from net immigration |
| Mortality | Continued gains in life expectancy | Longer lives raise the 65-plus and 85-plus counts |
CBO’s January 2026 outlook revised its population projections downward for 2025 to 2035 mainly because it expects less net immigration. It also notes substantial uncertainty in all three components. The immigration swing already visible in the Census Bureau’s estimates, net international migration falling from 8.08 to 3.70 per 1,000 residents in 2024 to 2025, shows how quickly the base can move. Higher immigration would add working-age adults and children and slow the rise of the older share, and lower immigration would do the reverse.
What Projected Aging Does Not Say
A projection of age shares does not predict the economy, health or retirement behavior. A rising 65-plus share raises demand for health care and retirement income, but outcomes depend on health, work after 65, productivity and policy. Population projections measure how many people will be in each age group if the assumptions hold, and each series states its assumptions differently.
Conclusion
The age structure of 2050 is already visible in the people alive today. The adults who will be 65 or older in 2050 are all at least 41 now, and the children who will be 24 in 2050 are not yet born. That is why the projections agree on direction: fewer children, a slightly smaller working-age share, many more older adults. They disagree on size, and that disagreement turns mostly on one variable, immigration, which has already moved by more than half in a year.
Frequently Asked Questions
1. How will the US age structure change by 2050?
The Census Bureau projects the 65-and-older share rising from 17% in 2022 to 23% in 2050 and the under-18 share falling from 22% to 18%. The working-age share falls slightly, from about 61% to 59%.
2. How many Americans will be 65 or older in 2050?
About 82 million in the Census Bureau’s 2023 projections and about 78 million in the Weldon Cooper Center’s 2026 projections, compared with 64.6 million in 2025.
3. What will the median age be in 2050?
41.9 years according to the Weldon Cooper Center, up from 39.4 in 2025.
4. Will older adults outnumber children?
Yes, projections suggest so by 2028 to 2029 and by 11 million to 17 million by 2050 on illustrative totals, though the exact timing depends on births, deaths, and immigration.
5. How many children will there be in 2050?
About 65 million to 67 million on an illustrative calculation applying the Census Bureau’s 18% share to a population of 360 million to 370 million. The Census Bureau does not publish that count in the tables used here.
6. Will the US population keep growing?
Slowly. CBO projects 364 million by 2056 with growth falling to near zero, and the Census Bureau’s 2023 series projects a decline in the second half of the century.
7. What happens to the working-age population?
Its share falls slightly to about 59%, and on illustrative totals the number stays near 212 million to 218 million, up from 205.1 million in 2025.
8. Why are projections different across sources?
They start from different baselines, define the population differently, and assume different fertility, mortality, and immigration. CBO uses the Social Security area population; the Census Bureau counts residents.
9. Which states will be oldest and youngest in 2050?
The Weldon Cooper Center projects Maine will have the highest median age and Utah the lowest.
10. Are these projections certain?
No. They describe outcomes under stated assumptions. CBO notes substantial uncertainty in fertility, mortality, and immigration, and projections are revised with each new vintage.
Recommended Articles in the USA Population Series:
- USA Baby Boomer Population Falls to 64.4 Million, Down 14 Million From Its Peak
- Generation X Population in the USA Reaches About 65 Million, Nearly Matching Boomers
- Working-Age Population in the US Stands at 205 Million, but Its Share Has Fallen
- Number of Children Under 18 in America Falls to 72 Million as the South Gains
- US Aging Population Statistics: 64.6 Million Seniors, 7 Million Over 85, 119,100 Centenarians
- USA States With the Oldest Populations: Maine Has 142 Seniors for Every 100 Children
- US Population Pyramid Is Turning Into a Column With a Heavy Middle
- US States With the Youngest Populations: Utah Has Twice as Many Children as Seniors
- US Population Over 65 by State Ranges From 24.6% in Maine to 13.0% in Utah
- Generation Alpha Population in America Reaches 51 Million
- Generation Z Population in the USA Reaches 71 Million, With Nearly 2 Million More Boys
- Millennial Population in America Tops 74 Million and Dominates the Middle of the Age Pyramid
- Median Age in the United States Reaches 39.4, With Maine 12.3 Years Older Than Utah
- Largest Cities in America by Population: The 25 Biggest Urban Centers
- Most Densely Populated Cities in America: A Tiny Jersey Town Outranks New York
- US Metropolitan Population Projections for 2050: Where Growth Will Be Concentrated
- Fastest-Growing Metropolitan Areas in the USA Are Concentrated in Smaller Southeast Metros
- How America’s Biggest Cities Changed Places Between 1900 and 2027
- Cities Losing Population in the USA: New York Falls by 166,000 as St. Louis Drops 7.4%
- Largest Urban Areas in the United States: The Metro Regions With the Most Residents
- Largest Metropolitan Areas in the USA: Where 86% of Americans Live
- Fastest-Growing Cities in the US Are Texas Suburbs, While Charlotte Leads in New Residents
- Top 25 Most Populated Cities in the USA in 2027: America’s Biggest Urban Centers
Sources
- U.S. Census Bureau, “U.S. Population Projected to Begin Declining in Second Half of Century,” 2023 National Population Projections.
- Population Reference Bureau, “Fact Sheet Aging in the United States” (Census 2023 projections for 2022 to 2050).
- Congressional Research Service, “Recent Census projections,” IN12327 (Census 2023 age shares).
- University of Virginia Weldon Cooper Center, “U.S. Population Projected to Grow More Slowly through 2050,” 2026.
- Congressional Budget Office, “The Demographic Outlook 2026 to 2056,” January 2026.
- U.S. Census Bureau, “Populations in All Age Groups Growing in the South,” press release CB26-105 (Vintage 2025), June 25, 2026.
- Business Stats, “How Many Adults Live in the US” (2025 age groups, July 2026 projection).