Key Findings
- Utah is the youngest state, with a median age of 32.6, 26.1% of residents under 18, and 13.0% aged 65 or older.
- Texas (36.0), North Dakota (36.5), Alaska (36.7) and Nebraska (37.5) follow Utah; DC (35.0) ranks second among all jurisdictions.
- Utah has 201 children per 100 seniors; the national ratio is 111.
- Eighteen states and DC are younger than the national median of 39.4.
- Youth has two causes: many children (Utah, Texas, Nebraska) or many young adults (DC, Colorado).
- The ten youngest jurisdictions hold 54.6 million people, 16.0% of the country.
- The Weldon Cooper Center projects Utah will still have the lowest median age in 2050.
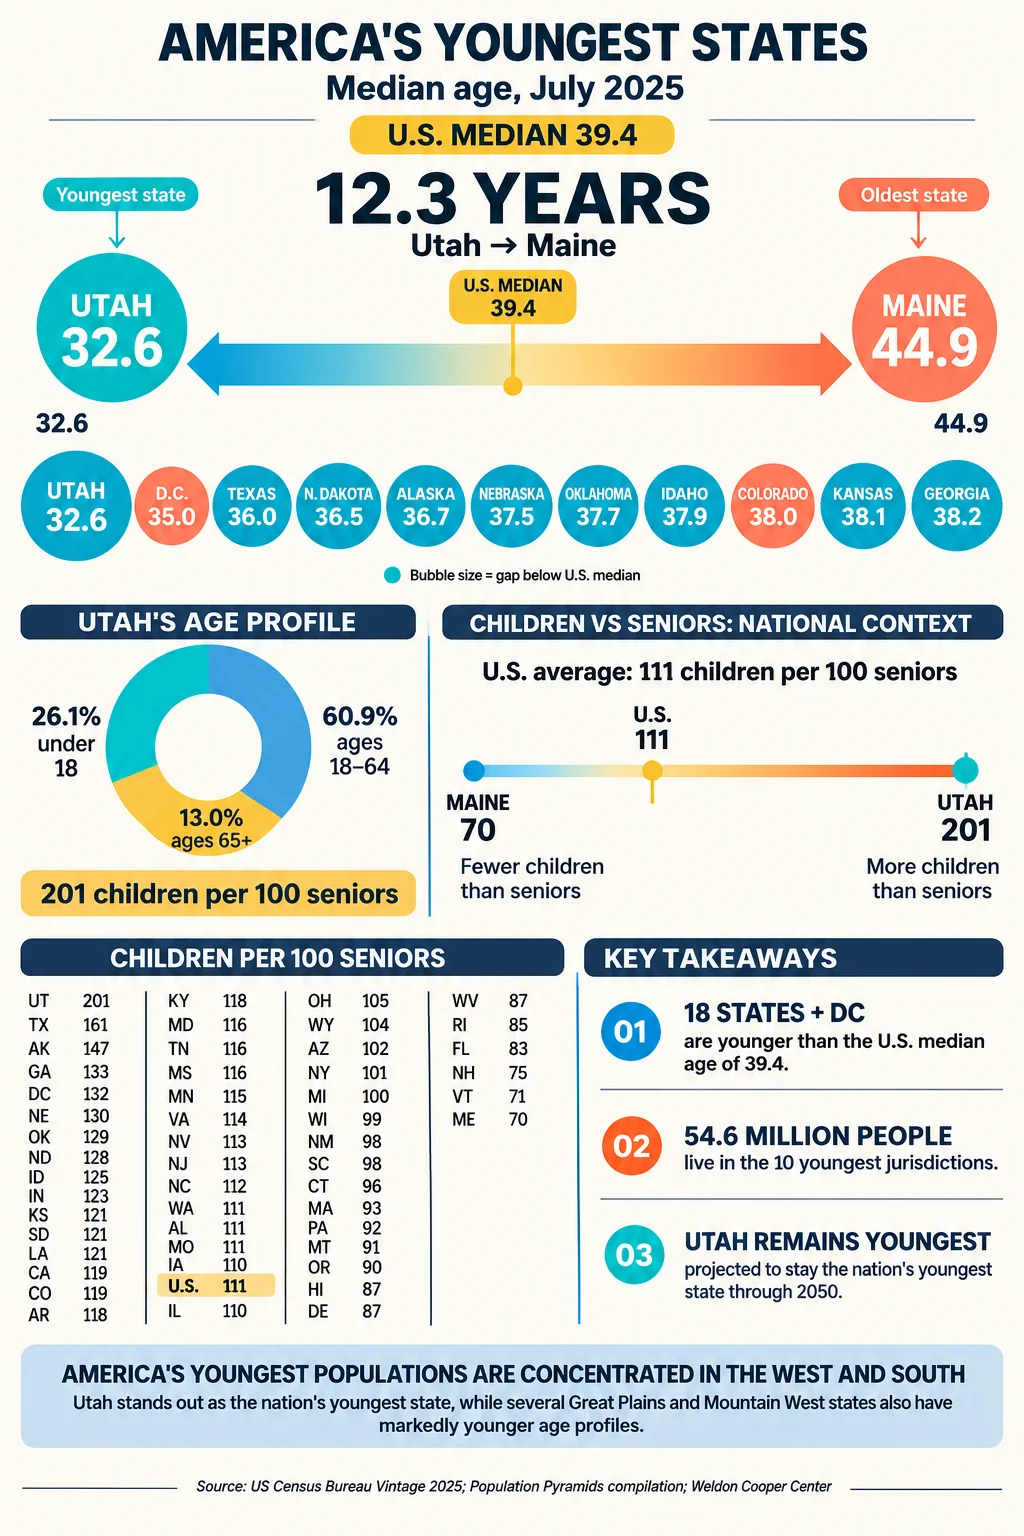
Utah has 201 children under 18 for every 100 residents aged 65 or older, the only state where the ratio reaches two to one, and its median age of 32.6 is 6.8 years below the national median of 39.4. The Census Bureau’s Vintage 2025 estimates put Texas second among states at 36.0 and North Dakota third at 36.5, with Alaska (36.7), Nebraska (37.5), Oklahoma (37.7), Idaho (37.9), Colorado (38.0) and Kansas (38.1) completing the youngest ten. The District of Columbia, which is not a state, has the second lowest median of any jurisdiction at 35.0.
Young does not mean the same thing everywhere. Utah, Texas, and the Plains states are young because they have many children. The District of Columbia and Colorado are young because they have many adults in their twenties and thirties. State figures here are from the Census Bureau’s Vintage 2025 estimates as compiled by Population Pyramids (median age and shares under 18 and 65 and older, rounded to one decimal), and populations are from SmartAsset’s compilation of the same release. Ties share a rank.
Data Snapshot
| Metric | Figure | Reference |
|---|---|---|
| Youngest state | Utah, median age 32.6 | July 1, 2025 |
| Highest child share | Utah, 26.1% under 18 | |
| Lowest 65-plus share | Utah, 13.0% | |
| Children per 100 seniors, Utah | 201 (national 111) | |
| Youngest jurisdiction including DC | Utah, then DC (35.0) | |
| Jurisdictions below the national median | 19 of 51 (18 states plus DC) | |
| Ten youngest jurisdictions combined | 54.6 million people (16.0% of the US) | |
| US median age | 39.4 |
The 15 Youngest States and DC
| Rank (1 is youngest) | State | Median age | Under 18 | 65 and older | Children per 100 seniors | Population |
|---|---|---|---|---|---|---|
| 1 | Utah | 32.6 | 26.1% | 13.0% | 201 | 3,538,904 |
| 2 | District of Columbia | 35.0 | 17.9% | 13.6% | 132 | 693,645 |
| 3 | Texas | 36.0 | 24.0% | 14.9% | 161 | 31,709,821 |
| 4 | North Dakota | 36.5 | 22.9% | 17.9% | 128 | 799,358 |
| 5 | Alaska | 36.7 | 23.3% | 15.8% | 147 | 737,270 |
| 6 | Nebraska | 37.5 | 23.7% | 18.3% | 130 | 2,018,006 |
| 7 | Oklahoma | 37.7 | 23.2% | 18.0% | 129 | 4,123,288 |
| 8 | Idaho | 37.9 | 23.3% | 18.7% | 125 | 2,029,733 |
| 9 | Colorado | 38.0 | 20.3% | 17.1% | 119 | 6,012,561 |
| 10 | Kansas | 38.1 | 22.9% | 18.9% | 121 | 2,977,220 |
| 11 | Georgia | 38.2 | 22.2% | 16.7% | 133 | 11,302,748 |
| 12 | South Dakota | 38.4 | 23.5% | 19.4% | 121 | 935,094 |
| 13 | Indiana | 38.6 | 22.6% | 18.4% | 123 | 6,973,333 |
| 14 | California | 38.7 | 20.8% | 17.5% | 119 | 39,355,309 |
| 15 | Washington | 38.8 | 20.4% | 18.3% | 111 | 8,001,020 |
The table includes the District of Columbia, so its entry sits between Utah and Texas. Excluding DC, the ten youngest states are Utah, Texas, North Dakota, Alaska, Nebraska, Oklahoma, Idaho, Colorado, Kansas and Georgia. Together with DC they hold 54.6 million people, or 16.0% of the nation, and Texas alone accounts for 31.7 million of that total. Eighteen states and DC are below the national median of 39.4, three (Arizona, Minnesota, Virginia) match it, and 29 are above.
Two Kinds of Young
The shares of children and older adults separate the youngest places into two groups.
| Type | Jurisdictions | What drives the low median |
|---|---|---|
| Child-heavy | Utah (26.1% under 18), Texas (24.0%), Nebraska (23.7%), Alaska and Idaho (23.3%), Oklahoma (23.2%), North Dakota and Kansas (22.9%), Georgia (22.2%) | Many children and few residents 65 and older |
| Young-adult-heavy | District of Columbia (68.5% working age), Colorado (62.6%) | Many adults in their twenties and thirties, with a below-average child share |
Utah’s profile is the clearest: 26.1% under 18 and 13.0% 65 and older, leaving the working-age share (60.9%) near the national figure of 60.0%. In Texas, the child share is 24.0% and the older share 14.9%. In the District of Columbia, the child share (17.9%) is lower than in any state except Rhode Island and the three oldest northern New England states, but the working-age share of 68.5% is the highest in the country, so the median is young anyway. Colorado’s child share (20.3%) is below the national 21.1%, yet it has a working-age share of 62.6%, second highest among jurisdictions after DC.
Children Per 100 Seniors
| Jurisdiction | Children per 100 seniors |
|---|---|
| Utah | 201 |
| Texas | 161 |
| Alaska | 147 |
| Georgia | 133 |
| District of Columbia | 132 |
| Nebraska | 130 |
| Oklahoma | 129 |
| North Dakota | 128 |
| Idaho | 125 |
| Kansas | 121 |
| Colorado | 119 |
| United States | 111 |
The national ratio is 111 (72.0 million children and 64.6 million older adults). Utah’s ratio is 1.8 times the national ratio, and the mirror image of Maine’s 142 seniors per 100 children.
Why These States Are Young
The reasons vary by place, and the Census estimates measure outcomes, not motives.
Large child population: Utah’s child share is the highest in the country (26.1%). The estimates used here do not include a state fertility rate, so the data cannot isolate how much of that comes from family size and how much from migration.
Migration of working-age adults and families: Texas and Colorado have attracted domestic and international movers, and the Census Bureau noted that in the year to July 2025 the South was the only region where all age groups grew. Texas, with 31.7 million residents, has the second-lowest 65-plus share among the states (14.9%).
Energy and resource economies: North Dakota and Alaska have median ages of 36.5 and 36.7. Inflows of working-age adults for energy and resource work are a plausible factor, but the Census estimates used here do not measure why people move. The share of residents 65 and older in these two states is below the national average (17.9% and 15.8%).
A government and college town: The District of Columbia’s 35.0 median reflects a large population of young adults, with 68.5% of residents aged 18 to 64.
Are the Youngest States Aging?
Yes, but more slowly. The national median rose from 38.6 in 2020 to 39.4 in 2025 and is projected by the Weldon Cooper Center to reach 41.9 by 2050. The same projections show Utah retaining the lowest median age in 2050. The state’s growth is substantial: the Weldon Cooper Center’s July 2026 projections have Utah’s population rising 21.9% between 2025 and 2040, Texas 20.7% and Idaho 24.1%, the three fastest-growing states. Young states are also the fastest-growing ones, which keeps their age structure from aging as quickly as slow-growth states. In the Great Plains and Alaska, by contrast, small population bases leave the age structure sensitive to a few thousand movers.
What a Young State Needs
A high child share means school enrollment and child care are a larger share of public budgets, while a low older share means lower demand for services such as long-term care. Utah’s working-age share of 60.9% supports a labor force similar to the national proportion, but the state also has 26.1% of residents under 18 to educate and house. The demographics describe the population, not outcomes: young states can have strong or weak schools, and old states can have strong or weak health systems.
Conclusion
The youngest places in America are young for a reason that is visible in their age pyramids: Utah and Texas have a wide base of children, while DC and Colorado have a wide middle of adults. Both patterns keep their medians below 39.4, and both are tied to growth. As the national median creeps toward 42 by 2050, the gap between the youngest and oldest states, 12.3 years today, is the clearest measure of how uneven aging has become.
Frequently Asked Questions
1. Which state has the youngest population?
Utah, with a median age of 32.6 in 2025.
2. What are the 10 youngest states?
Utah, Texas, North Dakota, Alaska, Nebraska, Oklahoma, Idaho, Colorado, Kansas and Georgia, by median age. The District of Columbia (35.0) would rank second if included.
3. Which state has the highest percentage of children?
Utah, with 26.1% of residents under 18, followed by Texas (24.0%) and Nebraska (23.7%).
4. Why is Utah so young?
It has the highest share of children (26.1%) and the lowest share of residents 65 and older (13.0%) of any state. The Census estimates measure the result, not the reasons, which include family size and migration.
5. Is Texas a young state?
Yes. Its median age of 36.0 is the second lowest among states, and its 65-plus share of 14.9% is the second lowest, though its child share (24.0%) is also second highest.
6. Which state has the lowest percentage of seniors?
Utah, at 13.0%, followed by Texas (14.9%) and Alaska (15.8%).
7. How many states are younger than the national median?
Eighteen states and the District of Columbia are below the national median of 39.4.
8. Is the District of Columbia young?
Yes. Its median age is 35.0, driven by young adults, with 68.5% of residents aged 18 to 64.
9. Will the youngest states stay young?
According to the Weldon Cooper Center, Utah will still have the lowest median age in 2050, though the national median is projected to rise to 41.9.
10. How much younger is Utah than Maine?
12.3 years in median age (32.6 versus 44.9).
Recommended Articles in the USA Population Series:
- USA Baby Boomer Population Falls to 64.4 Million, Down 14 Million From Its Peak
- Generation X Population in the USA Reaches About 65 Million, Nearly Matching Boomers
- Working-Age Population in the US Stands at 205 Million, but Its Share Has Fallen
- Number of Children Under 18 in America Falls to 72 Million as the South Gains
- US Aging Population Statistics: 64.6 Million Seniors, 7 Million Over 85, 119,100 Centenarians
- USA States With the Oldest Populations: Maine Has 142 Seniors for Every 100 Children
- How Will America’s Age Structure Change by 2050? Key Shifts to Watch
- US Population Pyramid Is Turning Into a Column With a Heavy Middle
- US Population Over 65 by State Ranges From 24.6% in Maine to 13.0% in Utah
- Generation Alpha Population in America Reaches 51 Million
- Generation Z Population in the USA Reaches 71 Million, With Nearly 2 Million More Boys
- Millennial Population in America Tops 74 Million and Dominates the Middle of the Age Pyramid
- Median Age in the United States Reaches 39.4, With Maine 12.3 Years Older Than Utah
- Largest Cities in America by Population: The 25 Biggest Urban Centers
- Most Densely Populated Cities in America: A Tiny Jersey Town Outranks New York
- US Metropolitan Population Projections for 2050: Where Growth Will Be Concentrated
- Fastest-Growing Metropolitan Areas in the USA Are Concentrated in Smaller Southeast Metros
- How America’s Biggest Cities Changed Places Between 1900 and 2027
- Cities Losing Population in the USA: New York Falls by 166,000 as St. Louis Drops 7.4%
- Largest Urban Areas in the United States: The Metro Regions With the Most Residents
- Largest Metropolitan Areas in the USA: Where 86% of Americans Live
- Fastest-Growing Cities in the US Are Texas Suburbs, While Charlotte Leads in New Residents
- Top 25 Most Populated Cities in the USA in 2027: America’s Biggest Urban Centers
Sources
- Population Pyramids, “Youngest States in the US, Ranked by Median Age (2025)” (state median age and age-group shares, Census Vintage 2025).
- Population Pyramids, “Oldest States in the US, Ranked by Median Age (2025).”
- SmartAsset via Boston 25 News, “US population trends by state,” September 17, 2026 (state populations, July 2025).
- U.S. Census Bureau, “Populations in All Age Groups Growing in the South,” press release CB26-105, June 25, 2026.
- University of Virginia Weldon Cooper Center, “U.S. Population Projected to Grow More Slowly through 2050.”
- Business Stats, “How Many Adults Live in the US” (national totals and fertility rate).