
Key Fact & Findings
- 64,617,088 Americans (18.9%) were 65 or older in July 2025, up 16.2% since 2020.
- Maine (24.6%), Vermont (24.1%) and New Hampshire (23.0%) have the highest shares; Utah (13.0%), the District of Columbia (13.6%) and Texas (14.9%) have the lowest.
- California (about 6.9 million) and Florida (about 5.3 million) have the most residents aged 65 and over.
- 17 states have a larger 65-plus share than under-18 share in 2025 figures, compared with 11 in the Census Bureau’s 2024 estimates.
- The 65-and-older population grew at least 14.6% in every region, with the South highest at 17.5%.
- There are 7,041,036 people aged 85 and older; Hawaii has the highest 85-plus share (3.0%).
- The 65-plus group is projected to reach 78 to 82 million by 2050.
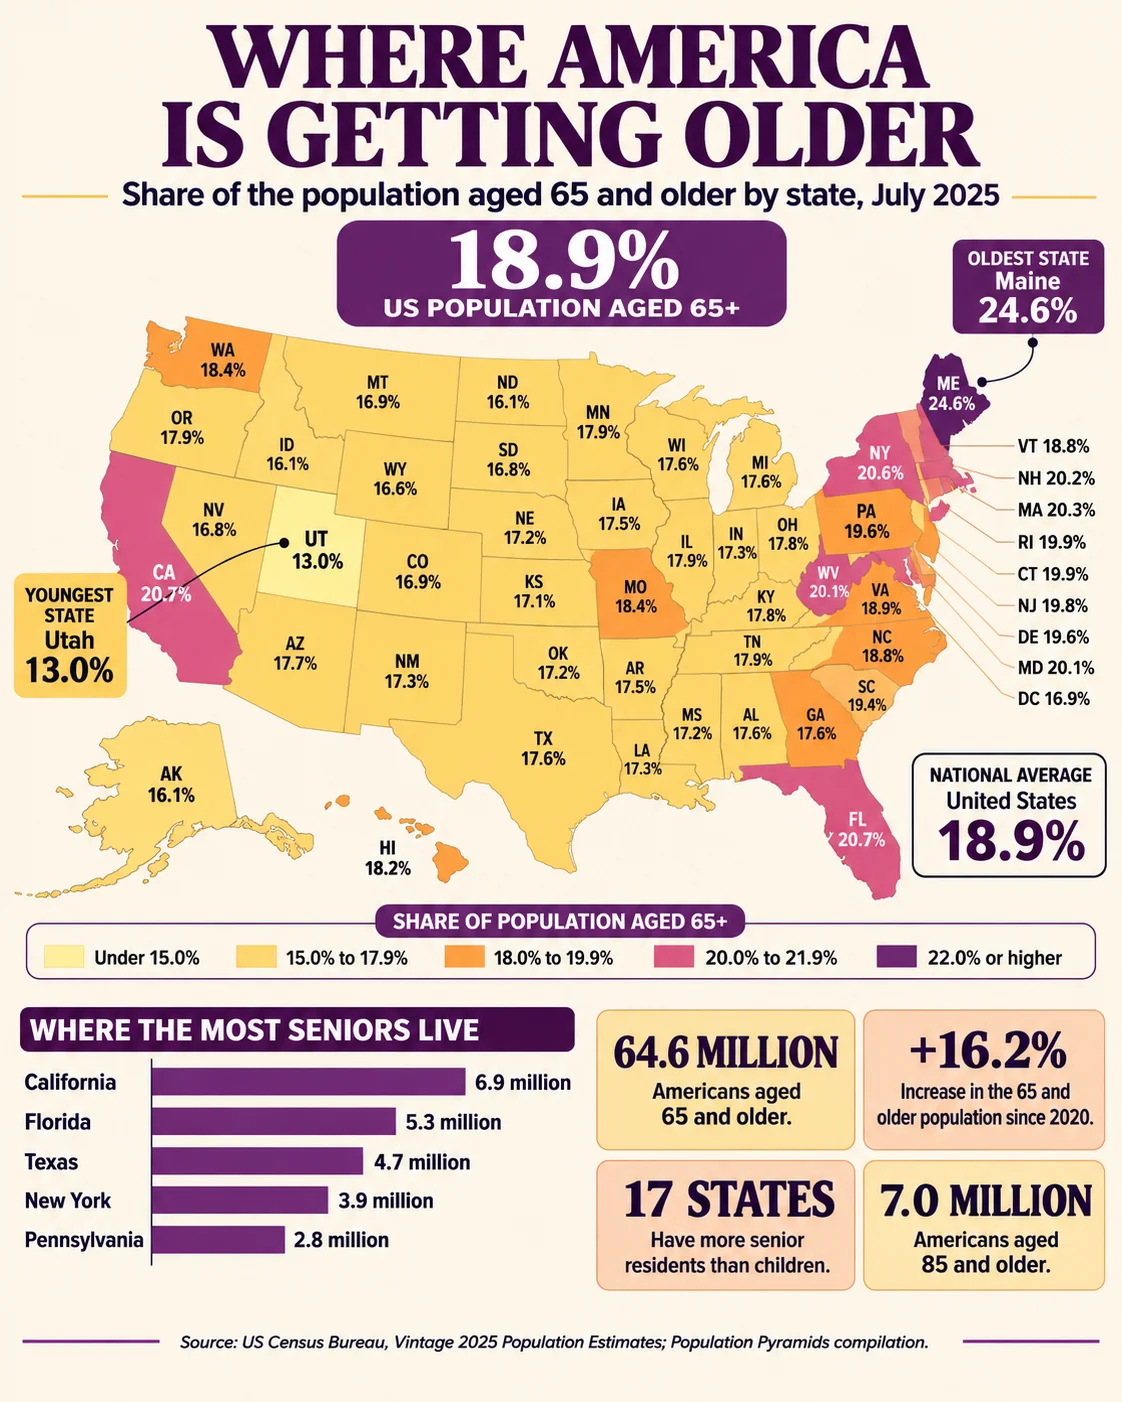
One in four Mainers is 65 or older, compared with about one in eight Utahns, and the gap between the oldest and youngest state by this measure, 11.6 percentage points, is larger than the difference between the national figure (18.9%) and either extreme. The Census Bureau counted 64,617,088 Americans aged 65 and over on July 1, 2025, up 16.2% from the April 2020 base, and that 8,988,997 increase was 87.5% of all the growth in the US population in those five years. Where those older residents live shapes health care demand, housing markets and local budgets very differently from state to state.
State figures here are shares of each state’s population, taken from the Census Bureau’s Vintage 2025 estimates as compiled by Population Pyramids, rounded to one decimal place. Counts for each state are calculated by multiplying the share by the state’s July 2025 population (from SmartAsset’s compilation of the same Census release), rounded to the nearest thousand, so they can be off by about 5,000 in a large state. The sum of the 51 calculated counts is 64.62 million, matching the national figure.
Data Snapshot
| Metric | Figure | Reference |
|---|---|---|
| US population 65 and older | 64,617,088 (18.9%) | July 1, 2025 |
| Growth since April 2020 | +8,988,997 (+16.2%) | |
| Share of all US growth, 2020 to 2025 | 87.5% | |
| Population 85 and older | 7,041,036 | July 1, 2025 |
| Highest 65-plus share | Maine, 24.6% | |
| Lowest 65-plus share | Utah, 13.0% | |
| Largest 65-plus population | California, about 6.89 million | |
| Counties where older adults outnumber children | 1,411 of 3,143 (2024 estimates) |
All 50 States and DC Ranked by Share Aged 65 and Older
Ties share a rank. The 85-plus column is the share of each state’s population aged 85 or older.
| Rank | State | Share aged 65 and older | Approximate 65 and older population | Share aged 85 and older |
|---|---|---|---|---|
| 1 | Maine | 24.6% | 348,000 | 2.6% |
| 2 | Vermont | 24.1% | 155,000 | 2.4% |
| 3 | New Hampshire | 23.0% | 326,000 | 2.3% |
| 4 | Delaware | 22.8% | 242,000 | 2.1% |
| 4 | Florida | 22.8% | 5,349,000 | 2.7% |
| 6 | Hawaii | 22.6% | 324,000 | 3.0% |
| 7 | West Virginia | 22.5% | 397,000 | 2.2% |
| 8 | Montana | 22.2% | 254,000 | 2.2% |
| 9 | Pennsylvania | 21.4% | 2,795,000 | 2.5% |
| 10 | New Mexico | 21.1% | 448,000 | 2.1% |
| 10 | South Carolina | 21.1% | 1,175,000 | 2.0% |
| 12 | Oregon | 21.0% | 897,000 | 2.2% |
| 13 | Rhode Island | 20.9% | 233,000 | 2.4% |
| 14 | Wisconsin | 20.8% | 1,242,000 | 2.2% |
| 15 | Wyoming | 20.7% | 122,000 | 1.9% |
| 16 | Arizona | 20.6% | 1,571,000 | 2.2% |
| 17 | Michigan | 20.5% | 2,076,000 | 2.1% |
| 18 | Connecticut | 20.4% | 752,000 | 2.5% |
| 19 | Ohio | 20.2% | 2,404,000 | 2.2% |
| 20 | Iowa | 20.1% | 651,000 | 2.5% |
| 21 | Massachusetts | 19.9% | 1,424,000 | 2.3% |
| 22 | Missouri | 19.6% | 1,229,000 | 2.1% |
| 23 | Alabama | 19.4% | 1,007,000 | 2.0% |
| 23 | South Dakota | 19.4% | 181,000 | 2.3% |
| 25 | Mississippi | 19.3% | 570,000 | 1.9% |
| 25 | New York | 19.3% | 3,860,000 | 2.4% |
| 27 | Minnesota | 19.1% | 1,114,000 | 2.2% |
| 28 | Arkansas | 19.0% | 592,000 | 2.0% |
| 29 | Kansas | 18.9% | 563,000 | 2.1% |
| 29 | North Carolina | 18.9% | 2,116,000 | 1.9% |
| 31 | Kentucky | 18.8% | 866,000 | 1.8% |
| 31 | Louisiana | 18.8% | 868,000 | 1.9% |
| 33 | Idaho | 18.7% | 380,000 | 1.8% |
| 33 | Illinois | 18.7% | 2,378,000 | 2.2% |
| 35 | Tennessee | 18.6% | 1,361,000 | 1.8% |
| 36 | New Jersey | 18.5% | 1,766,000 | 2.2% |
| 37 | Indiana | 18.4% | 1,283,000 | 1.9% |
| 37 | Maryland | 18.4% | 1,153,000 | 2.0% |
| 37 | Virginia | 18.4% | 1,634,000 | 1.9% |
| 40 | Nebraska | 18.3% | 369,000 | 2.0% |
| 40 | Nevada | 18.3% | 601,000 | 1.6% |
| 40 | Washington | 18.3% | 1,464,000 | 1.9% |
| 43 | Oklahoma | 18.0% | 742,000 | 1.9% |
| 44 | North Dakota | 17.9% | 143,000 | 2.2% |
| 45 | California | 17.5% | 6,887,000 | 2.1% |
| 46 | Colorado | 17.1% | 1,028,000 | 1.7% |
| 47 | Georgia | 16.7% | 1,888,000 | 1.6% |
| 48 | Alaska | 15.8% | 116,000 | 1.1% |
| 49 | Texas | 14.9% | 4,725,000 | 1.5% |
| 50 | District of Columbia | 13.6% | 94,000 | 1.7% |
| 51 | Utah | 13.0% | 460,000 | 1.3% |
Where the Most Older Residents Live
Share and size rank differently. The largest numbers of older residents are in the biggest states.
| Rank by number | State | Approximate population | Share of state |
|---|---|---|---|
| 1 | California | 6,887,000 | 17.5% |
| 2 | Florida | 5,349,000 | 22.8% |
| 3 | Texas | 4,725,000 | 14.9% |
| 4 | New York | 3,860,000 | 19.3% |
| 5 | Pennsylvania | 2,795,000 | 21.4% |
| 6 | Ohio | 2,404,000 | 20.2% |
| 7 | Illinois | 2,378,000 | 18.7% |
| 8 | North Carolina | 2,116,000 | 18.9% |
| 9 | Michigan | 2,076,000 | 20.5% |
| 10 | Georgia | 1,888,000 | 16.7% |
California has the most residents aged 65 and over at roughly 6.9 million, even though its share (17.5%) is below the national figure. Florida’s 5.3 million is 22.8% of its population, and its 65-plus group is larger than the entire population of 27 states. Texas has 4.7 million older residents, but they are only 14.9% of its population, the second lowest share after Utah among the states, because it is the second youngest large state.
Older Adults and Children
In 2024, the Census Bureau reported that older adults outnumbered children in 11 states and in 1,411 of 3,143 counties, nearly half of all counties. By the 2025 shares in the table above, 17 states have a larger share of residents aged 65 and over than under 18: Connecticut, Delaware, Florida, Hawaii, Maine, Massachusetts, Michigan, Montana, New Hampshire, New Mexico, Oregon, Pennsylvania, Rhode Island, South Carolina, Vermont, West Virginia and Wisconsin. Michigan and Wisconsin barely qualify (20.5% versus 20.4%, and 20.8% versus 20.5%) and are within the rounding of the published shares, so a precise count depends on the unrounded data.
The widest gaps are in northern New England and Florida. Maine has 24.6% aged 65 and over against 17.3% under 18, a gap of 7.3 points; Vermont 24.1% against 17.0% (7.1 points); New Hampshire 23.0% against 17.3% (5.7 points); Florida 22.8% against 18.9% (3.9 points); and West Virginia 22.5% against 19.5% (3.0 points). At the opposite end Utah has 26.1% under 18 against 13.0% aged 65 and over, and Texas has 24.0% against 14.9%.
How Fast the Older Population Is Growing
Every region added older residents faster than any other age group between 2020 and 2025. The 65-and-older population grew by at least 14.6% in every region, with the South highest at 17.5% (to 24.8 million). The Census Bureau’s short-term projection adds another 1,787,987 people aged 65 and over, about 2.8%, in the year to July 2026, taking the group to 66.4 million. The group’s growth is the main reason the national median age keeps rising.
The oldest group is growing too. The 85-and-older population reached 7,041,036 in July 2025, and the number of centenarians rose from 80,151 in 2020 to 119,182. Hawaii has the highest 85-plus share among the states at 3.0%, followed by Florida (2.7%) and Maine (2.6%), while Alaska (1.1%) and Utah (1.3%) have the lowest.
Four Types of Older States
The pattern behind the rankings is not a single cause. Four groups of states stand out.
Retirement destinations: Florida (22.8%), Delaware (22.8%), South Carolina (21.1%), and Arizona (20.6%) attract older adults from other states. Florida’s 85-plus share is among the highest at 2.7%.
Northern New England: Maine, Vermont and New Hampshire are the three oldest states by median age and 65-plus share, partly because of long-term out-migration of younger adults and low birth rates, according to state demographers cited by the Maine State Economist. Maine is also the only state whose median age dropped between 2020 and 2025.
Industrial and rural states: West Virginia (22.5%), Pennsylvania (21.4%), Montana (22.2%) and Michigan (20.5%) have high shares because of aging resident populations rather than inflows of retirees.
Younger states with large birth cohorts: Utah (13.0%), Texas (14.9%), Alaska (15.8%), Georgia (16.7%) and Colorado (17.1%) have the lowest 65-plus shares. In the District of Columbia, the share is 13.6%, reflecting young adult residents.
What the Projections Imply for States
Projections from the Weldon Cooper Center and the Census Bureau put the 65-and-older population at about 78 million (21.2%) and 82 million (23%) in 2050, so every state is likely to see its older share rise. The Census Bureau’s 2023 projections have the national 65-and-over share rising from 17% in 2022 to 23% in 2050, and the CBO projects the group growing about 1.6% a year through 2036.
Because those series are national, a state-level projection of the older population has to come from state demographers. The states with the lowest current shares, such as Utah and Texas, will age more slowly in relative terms but will still add large numbers of older residents because of their size.
Conclusion
The geography of aging is uneven but easy to read: the oldest states are in northern New England, Florida, and the Appalachian and Midwestern states with long-run out-migration, and the youngest are in the Mountain West and Texas. The more striking trend is the growth of the group itself, 9 million in five years and nearly nine of every ten new Americans. With 17 states already having more residents over 65 than under 18, the question for planners is no longer whether their population is aging, but how fast.
Frequently Asked Questions
1. Which state has the highest percentage of people over 65?
Maine, at 24.6% in 2025, followed by Vermont (24.1%) and New Hampshire (23.0%).
2. Which state has the lowest percentage of people over 65?
Utah, at 13.0%. Among states, Texas (14.9%) and Alaska (15.8%) follow. The District of Columbia, at 13.6%, is also below most states.
3. How many Americans are 65 or older?
64,617,088 as of July 1, 2025, which is 18.9% of the population.
4. Which state has the most residents over 65?
California, with roughly 6.9 million, followed by Florida (about 5.3 million) and Texas (about 4.7 million).
5. Is Florida the oldest state?
Not by share. Florida’s 22.8% is fourth, tied with Delaware, behind Maine, Vermont, and New Hampshire. It has the second-highest 85-plus share (2.7%) and a median age of 43.1.
6. In how many states do older adults outnumber children?
The Census Bureau counted 11 states in its 2024 estimates. On the 2025 shares in the table above the number is 17, though several are within rounding.
7. How fast is the 65-and-over population growing?
16.2% between April 2020 and July 2025, and the Census Bureau projects another 2.8% in the year to July 2026.
8. How many Americans are 85 or older?
7,041,036 in July 2025, with a higher share in Hawaii (3.0%) than in any other state.
9. Which region has the fastest-growing older population?
The South, where the 65-and-older population grew 17.5% to 24.8 million between 2020 and 2025.
10. What will the over-65 population be in 2050?
About 82 million (23%) in the Census Bureau’s 2023 projections and about 78 million (21.2%) in the Weldon Cooper Center’s 2026 projections.
Recommended Articles in the USA Population Series:
- USA Baby Boomer Population Falls to 64.4 Million, Down 14 Million From Its Peak
- Generation X Population in the USA Reaches About 65 Million, Nearly Matching Boomers
- Working-Age Population in the US Stands at 205 Million, but Its Share Has Fallen
- Number of Children Under 18 in America Falls to 72 Million as the South Gains
- US Aging Population Statistics: 64.6 Million Seniors, 7 Million Over 85, 119,100 Centenarians
- USA States With the Oldest Populations: Maine Has 142 Seniors for Every 100 Children
- How Will America’s Age Structure Change by 2050? Key Shifts to Watch
- US Population Pyramid Is Turning Into a Column With a Heavy Middle
- US States With the Youngest Populations: Utah Has Twice as Many Children as Seniors
- Generation Alpha Population in America Reaches 51 Million
- Generation Z Population in the USA Reaches 71 Million, With Nearly 2 Million More Boys
- Millennial Population in America Tops 74 Million and Dominates the Middle of the Age Pyramid
- Median Age in the United States Reaches 39.4, With Maine 12.3 Years Older Than Utah
- Largest Cities in America by Population: The 25 Biggest Urban Centers
- Most Densely Populated Cities in America: A Tiny Jersey Town Outranks New York
- US Metropolitan Population Projections for 2050: Where Growth Will Be Concentrated
- Fastest-Growing Metropolitan Areas in the USA Are Concentrated in Smaller Southeast Metros
- How America’s Biggest Cities Changed Places Between 1900 and 2027
- Cities Losing Population in the USA: New York Falls by 166,000 as St. Louis Drops 7.4%
- Largest Urban Areas in the United States: The Metro Regions With the Most Residents
- Largest Metropolitan Areas in the USA: Where 86% of Americans Live
- Fastest-Growing Cities in the US Are Texas Suburbs, While Charlotte Leads in New Residents
- Top 25 Most Populated Cities in the USA in 2027: America’s Biggest Urban Centers
Sources
- U.S. Census Bureau, “Populations in All Age Groups Growing in the South,” press release CB26-105 (Vintage 2025), June 25, 2026.
- U.S. Census Bureau, “Older Adults Outnumber Children in 11 States and Nearly Half of U.S. Counties,” June 26, 2025.
- Population Pyramids, “Oldest States in the US, Ranked by Median Age (2025)” (state 65-plus and 85-plus shares, Census Vintage 2025).
- SmartAsset via Boston 25 News, “US population trends by state,” September 17, 2026 (state populations, July 2025).
- Business Stats, “How Many Adults Live in the US” (national 65-plus and 85-plus figures).
- Maine Office of the State Economist, Vintage 2025 summary.
- Population Reference Bureau, “Fact Sheet Aging in the United States.”
- University of Virginia Weldon Cooper Center, “U.S. Population Projected to Grow More Slowly through 2050.”