
Key Findings
- About 64.4 million Americans (19%) are Baby Boomers, aged 61 to 79 in 2025.
- The cohort peaked at 78.8 million in 1999 and has lost about 14.4 million since.
- Boomers are the fourth largest of six generations, behind Millennials (74.1 million), Generation Z (71.1 million) and slightly behind Generation X (about 65 million).
- The 75-to-79 age group grew 30.4% from 2020 to 2025; the 55-to-59 group shrank 8.9%.
- The last Boomers turn 65 in 2029, ending the wave of 4 million turning 65 each year.
- There are about 89 men per 100 women at ages 65 to 69 and 82 at ages 75 to 79.
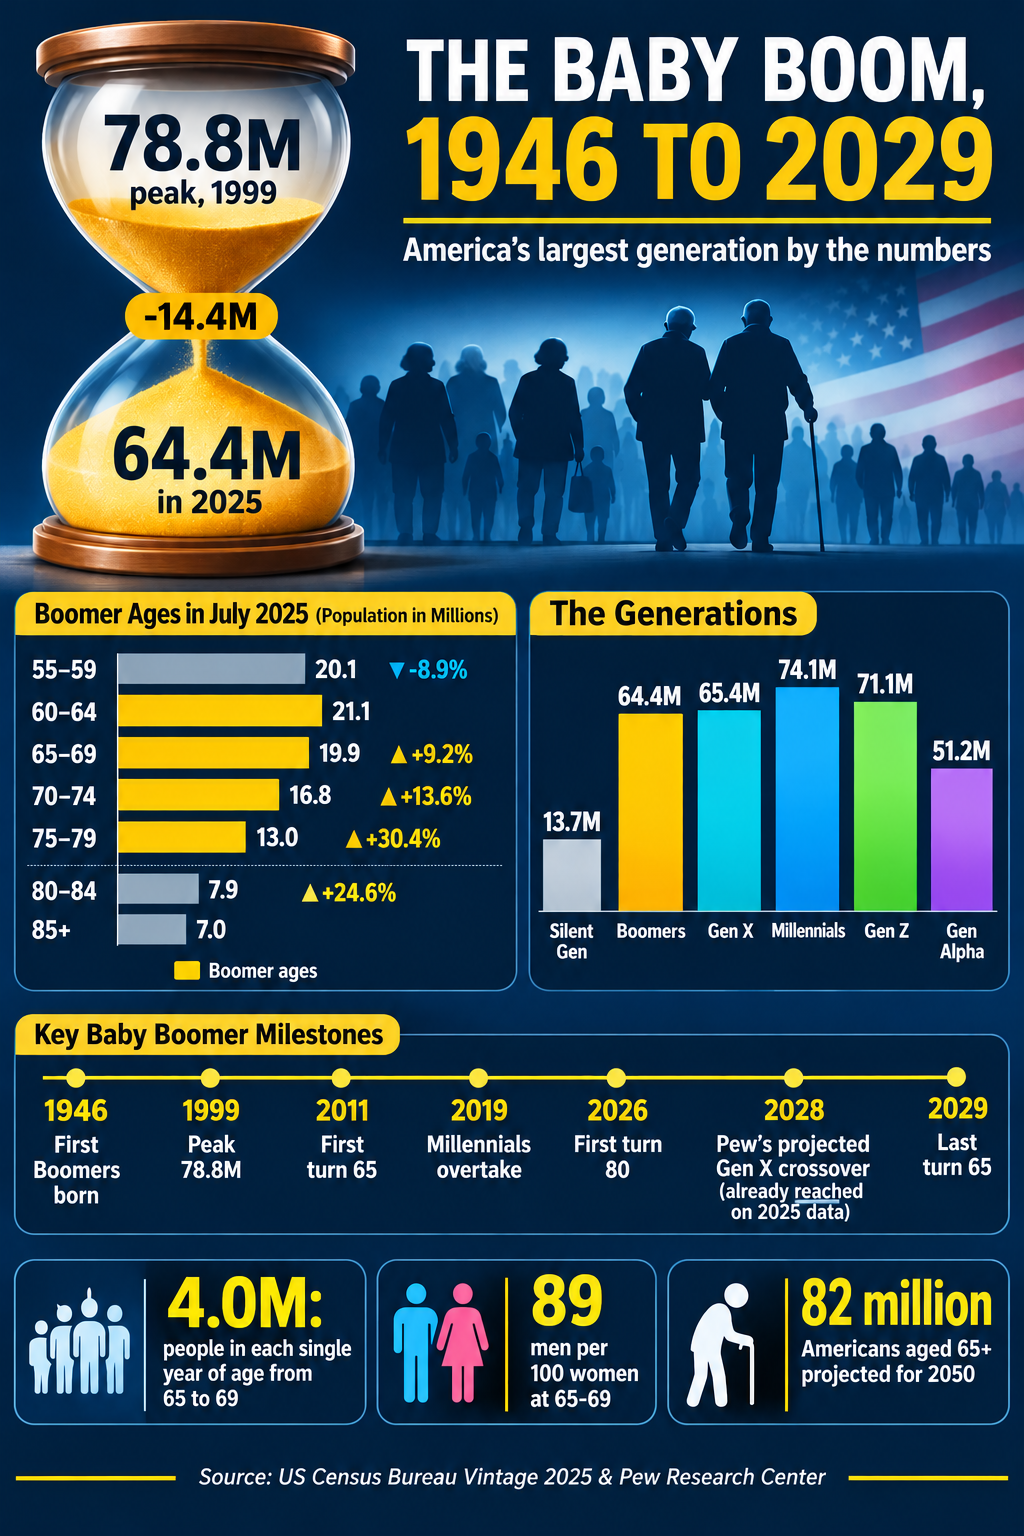
At its peak in 1999, the baby boom generation counted 78.8 million Americans. By 2025, it was down to about 64.4 million, a drop of roughly 14.4 million that comes almost entirely from deaths, since a birth cohort cannot be replenished. The first Boomers, born in 1946, turn 80 in 2026. The last, born in 1964, turn, 65 in 2029, which means the largest wave of Americans entering retirement age is almost over, even as its effects on health care, housing and the labor force continue.
The Census Bureau defines Baby Boomers as people born between 1946 and 1964, the only generation it officially designates, because the dates follow a measurable surge in births after World War II and a decline after 1964. In 2025, that puts Boomers at ages 61 to 79. Generation sizes here come from a Visual Capitalist analysis of Census Bureau data and sum to 340.1 million, the Census Bureau’s July 2024 total, so they are slightly lower than the 341.8 million residents counted in July 2025. Five-year age figures come from Vintage 2025.
Data Snapshot
| Metric | Figure | Reference |
|---|---|---|
| Baby Boomer population | about 64.4 million (19% of US) | 2025 ages, Census data |
| Birth years | 1946 to 1964 | Census Bureau and Pew |
| Ages in 2025 | 61 to 79 | |
| Peak population | 78.8 million | 1999 |
| Women per 100 men, ages 65 to 69 | about 112 | July 2025 |
| First Boomers turn 80 | 2026 | |
| Last Boomers turn 65 | 2029 |
Where Boomers Rank Among Generations
| Generation | Birth years | Age range in 2025 | Population | Share |
|---|---|---|---|---|
| Silent Generation | 1928 to 1945 | 80 to 97 | 13,741,630 | 4% |
| Baby Boomers | 1946 to 1964 | 61 to 79 | 64,448,248 | 19% |
| Generation X | 1965 to 1980 | 45 to 60 | about 65.4 million | 19% |
| Millennials | 1981 to 1996 | 29 to 44 | 74,104,186 | 22% |
| Generation Z | 1997 to 2012 | 13 to 28 | 71,146,116 | 21% |
| Generation Alpha | 2013 to 2025 | 0 to 12 | 51,238,687 | 15% |
| Total | 340,110,988 | 100% |
The Generation X figure is calculated as the remainder of the published total after subtracting the other five generations, and the published rounded value is “65 million.” Boomers are the fourth largest of the six groups. Different sources give different Boomer counts: a Census-based tally one vintage earlier put the group at 66.9 million, and the UN’s projection puts it near 66.6 million for 2026 on a different age convention and population base. The gap is mostly in how age is counted and which year’s total is used.
From 78.8 Million to 64.4 Million
The Pew Research Center calculated that Boomers peaked at 78.8 million in 1999 and remained the largest living adult generation until 2019, when Millennials passed them. Pew’s 2020 projections, which rely on an earlier Census base, had Generation X passing the Boomers in 2028, at about 63.9 million Gen Xers against 62.9 million Boomers. The newer Census-based tally shows the crossover has effectively already happened: Generation X (about 65 million) is slightly larger than the Boomers (64.4 million).
| Milestone | Year |
|---|---|
| First Boomers born | 1946 |
| Boomer population peaks (78.8 million) | 1999 |
| First Boomers turn 65 | 2011 |
| Millennials overtake Boomers | 2019 |
| First Boomers turn 80 | 2026 |
| Pew’s 2020 projection for Gen X passing Boomers (Census 2025 data already show Gen X ahead) | 2028 |
| Last Boomers turn 65 | 2029 |
| First Boomers turn 100 | 2046 |
What the Age Pyramid Shows
The bulge between ages 60 and 79 in the 2025 age pyramid is the baby boom. The numbers by five-year age group, from the Census Bureau’s Vintage 2025 estimates, show it moving upward.
| Age group | April 2020 | July 2025 | Change | Percent |
|---|---|---|---|---|
| 55 to 59 | 22,074,569 | 20,112,899 | -1,961,670 | -8.9% |
| 60 to 64 | 21,201,323 | 21,076,817 | -124,506 | -0.6% |
| 65 to 69 | 18,236,838 | 19,921,459 | +1,684,621 | +9.2% |
| 70 to 74 | 14,764,604 | 16,766,692 | +2,002,088 | +13.6% |
| 75 to 79 | 9,940,167 | 12,959,591 | +3,019,424 | +30.4% |
| 80 to 84 | 6,361,028 | 7,928,310 | +1,567,282 | +24.6% |
The 75-to-79 group grew 30.4% in five years as the oldest Boomers entered it, and the 80-to-84 group grew 24.6% as the larger cohorts of the early 1940s aged into it (Boomers themselves begin reaching 80 in 2026). Meanwhile, the 55-to-59 group shrank 8.9%, since the large early-1960s birth cohorts left it for their sixties. Every single year of age between 65 and 69 holds about 4.0 million people (19.92 million over five years), which is the scale of the annual flow into the traditional retirement age that the baby boom produced between 2011 and 2029.
A Cohort With More Women Than Men
| Age group | Men per 100 women, July 2025 |
|---|---|
| 60 to 64 | 92.2 |
| 65 to 69 | 89.1 |
| 70 to 74 | 85.6 |
| 75 to 79 | 81.9 |
| 80 to 84 | 75.4 |
| 85 and older | 61.0 |
At ages 65 to 69, there are 89.1 men for every 100 women, which is the same as about 112 women per 100 men. By 75 to 79, the ratio is 81.9. According to the National Center for Health Statistics, life expectancy at birth in 2024 was 81.4 years for women and 76.5 for men, and at age 65 women could expect another 20.8 years against 18.4 for men. The Census Bureau notes the gap at older ages has been narrowing for decades as male mortality rates fell faster than female ones.
Boomers Inside the 65-and-Older Population
The nation’s 65-and-older group reached 64,617,088 in July 2025, up 16.2% since April 2020 and 87.5% of all population growth in the period. Most of it is Boomers (ages 65 to 79), with a smaller, older Silent Generation group above them. The oldest-old group, ages 85 and over, reached 7,041,036, and the number of centenarians rose from 80,151 to 119,182 in five years. Those very old groups will grow much faster in the 2030s and 2040s as Boomers reach them, but their size depends heavily on mortality assumptions that can change.
The geographic spread follows retirement migration and local aging. The Census Bureau found that the 65-and-older share of a county’s population was highest in parts of the West, especially Arizona, Idaho, Nevada and the Pacific Northwest coast, and in some counties in Florida, Texas and along the East Coast. Every region’s 65-and-older population grew at least 14.6% between 2020 and 2025, with the South highest at 17.5% (24.8 million people).
What a Shrinking Boomer Cohort Means
Because the baby boom is shrinking while the older population as a whole is still growing, the burden on the system will shift from one generation to the next rather than ease. The Census Bureau’s 2023 series projects the number of people 65 and older to reach 82 million by 2050, from 58 million in 2022, a 42% rise.
That increase will be driven in part by Generation X, which is much smaller than the Boomer cohort at its peak, and later by Millennials, and the share of the population aged 65 and older is projected to rise from 17% to 23%. The Congressional Budget Office projects annual deaths to exceed births from 2030. That is a statement about the whole population, not just Boomers, but the Boomers’ age is the main reason it happens.
Conclusion
The baby boom is now in the stage where its size shrinks every year, but its effect on the nation’s age structure peaks. The cohort has lost about 14.4 million people since 1999, the largest group of newly retired workers is almost through, and the 75-to-79 and 80-to-84 groups are growing at 25% to 30% over five years. What follows is a smaller but older cohort and a growing share of Americans who are 80 and over.
Frequently Asked Questions
1. How many Baby Boomers are there in America?
About 64.4 million in 2025, or 19% of the population, according to a Visual Capitalist analysis of Census Bureau data. Other tallies range from 64 million to 67 million depending on the vintage and age convention.
2. What years define the Baby Boom generation?
1946 to 1964, which is the Census Bureau’s definition and the same as Pew’s.
3. How old are Baby Boomers in 2025?
61 to 79, and 62 to 80 in 2026.
4. When did Baby Boomers peak in population?
In 1999, at 78.8 million, according to Pew Research Center’s analysis of Census Bureau data.
5. Are Millennials larger than Baby Boomers?
Yes. Millennials passed Boomers as the largest living adult generation in 2019, and in 2025 they number about 74.1 million against 64.4 million.
6. When will Generation X become larger than the Boomers?
Pew’s 2020 projection placed it at 2028, but the newer Census-based tally for 2025 already shows Generation X (about 65 million) slightly ahead of Boomers (64.4 million).
7. When do the last Baby Boomers turn 65?
In 2029, when those born in 1964 reach 65.
8. Are there more female or male Boomers?
More females. At ages 65 to 69, there are 89.1 men per 100 women, and 81.9 at ages 75 to 79.
9. How many Americans are 65 or older?
64,617,088 in July 2025, or 18.9% of the population, which includes Boomers and members of the Silent Generation.
10. How many Boomers will be alive in 2050?
No official count by generation exists. The Census Bureau projects 82 million Americans aged 65 and older in 2050, but by then the oldest Boomers will be 104.
Recommended Articles in the USA Population Series:
- Generation X Population in the USA Reaches About 65 Million, Nearly Matching Boomers
- Working-Age Population in the US Stands at 205 Million, but Its Share Has Fallen
- Number of Children Under 18 in America Falls to 72 Million as the South Gains
- US Aging Population Statistics: 64.6 Million Seniors, 7 Million Over 85, 119,100 Centenarians
- USA States With the Oldest Populations: Maine Has 142 Seniors for Every 100 Children
- How Will America’s Age Structure Change by 2050? Key Shifts to Watch
- US Population Pyramid Is Turning Into a Column With a Heavy Middle
- US States With the Youngest Populations: Utah Has Twice as Many Children as Seniors
- US Population Over 65 by State Ranges From 24.6% in Maine to 13.0% in Utah
- Generation Alpha Population in America Reaches 51 Million
- Generation Z Population in the USA Reaches 71 Million, With Nearly 2 Million More Boys
- Millennial Population in America Tops 74 Million and Dominates the Middle of the Age Pyramid
- Median Age in the United States Reaches 39.4, With Maine 12.3 Years Older Than Utah
- Largest Cities in America by Population: The 25 Biggest Urban Centers
- Most Densely Populated Cities in America: A Tiny Jersey Town Outranks New York
- US Metropolitan Population Projections for 2050: Where Growth Will Be Concentrated
- Fastest-Growing Metropolitan Areas in the USA Are Concentrated in Smaller Southeast Metros
- How America’s Biggest Cities Changed Places Between 1900 and 2027
- Cities Losing Population in the USA: New York Falls by 166,000 as St. Louis Drops 7.4%
- Largest Urban Areas in the United States: The Metro Regions With the Most Residents
- Largest Metropolitan Areas in the USA: Where 86% of Americans Live
- Fastest-Growing Cities in the US Are Texas Suburbs, While Charlotte Leads in New Residents
- Top 25 Most Populated Cities in the USA in 2027: America’s Biggest Urban Centers
U.S. Census Bureau, “Populations in All Age Groups Growing in the South,” press release CB26-105 (Vintage 2025), June 25, 2026.
Business Stats, “How Many Adults Live in the US” (five-year age groups by sex, Vintage 2025).
Pew Research Center, “Millennials overtake Baby Boomers as America’s largest generation,” April 28, 2020.
Library of Congress, “Generations” research guide (Census Bureau baby boom definition).
Population Reference Bureau, “Fact Sheet Aging in the United States” (Census 2023 projections).
Congressional Budget Office, “The Demographic Outlook 2026 to 2056,” January 2026.
National Center for Health Statistics, “Mortality in the United States 2024,” Data Brief 548 (as summarized by Business Stats).