
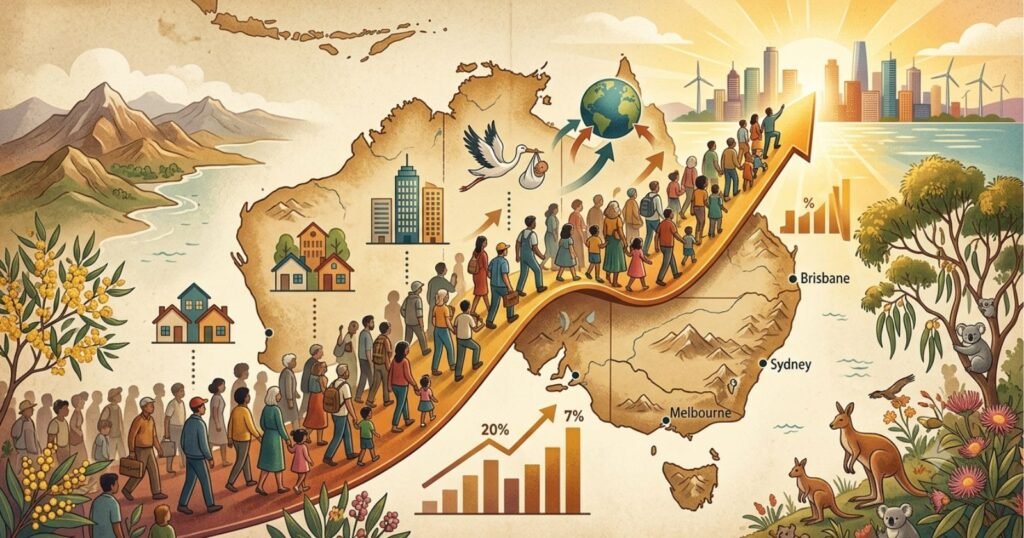
An extra person joins Australia’s population roughly every minute and 15 seconds. That figure is not a rounding trick, it is how the Australian Bureau of Statistics literally calibrates the national population clock, and it captures something important: Australia’s growth is now a migration story first and a birth-rate story second. In the year to December 2025, net overseas migration outweighed natural increase by nearly three to one, a ratio that would have seemed backwards to almost any earlier generation of Australians.
Australia’s Population Growth in One Snapshot
At 31 December 2025, Australia’s population stood at 27,801,023 people. The population passed 28 million during 2026, according to the ABS population clock. Over the year to December 2025, the population grew by 412,500 people, or 1.5%, made up of 111,500 from natural increase and 301,000 from net overseas migration.
In the twelve months to September 2025, the split was similar: 423,600 total growth (1.6%), with 112,600 from natural increase and 311,000 from net overseas migration, meaning migration accounted for roughly 73% of all growth and natural increase the remaining 27%.
What Australia’s Population Growth Rate Actually Measures
Population growth in Australia is calculated as:
Population growth = Natural increase + Net overseas migration
Where:
- Births are babies born and registered in Australia during the period
- Deaths are deaths registered in Australia during the period
- Natural increase equals births minus deaths
- Net overseas migration (NOM) equals overseas migration arrivals minus overseas migration departures, counting anyone who stays in or leaves Australia for 12 months or more out of a 16-month period
- Net interstate migration shifts population between states and territories but does not change the national total
The ABS releases these figures quarterly as Estimated Resident Population data, and revises preliminary migration figures as more complete visa and travel data become available.
Australia’s Population Growth Since Federation
| Year | Approx. population | Note |
|---|---|---|
| 1901 | 3.8 million | Federation baseline |
| 1918 | 5 million | Reached during WWI |
| 1925 | 6 million | Fastest million added to that point, 7 years |
| 1939 | 7 million | Depression-era slowdown |
| 1949 | 8 million | Post-war baby boom and migration program begin |
| 1959 | 10 million | Population had already doubled since 1901 |
| 1970 | ~12.5 million | Sustained post-war immigration |
| 1990 | 17 million | Fastest million ever added, 3 years 9 months |
| 2000 | ~19.2 million | Approaching the 20 million mark |
| 2004 | 20 million | |
| 2010 | ~22.3 million | |
| 2016 | 24 million | Census year |
| 2020 | ~25.5 million | Just before COVID-19 disruption |
| 2021 | 25,687,041 | Census-adjusted estimate |
| 2025 | 27,801,023 | 31 December estimate |
| 2026 | 28 million | Milestone reached during the year |
Australia’s population has grown roughly sevenfold since Federation, and it has grown in every year except 1916, when large numbers of soldiers left for the First World War.
Australia’s Major Population Growth Eras
Rather than repeat the same pattern decade by decade, Australia’s growth history breaks cleanly into distinct eras.
The natural increase era (1901 to 1945): Growth was driven almost entirely by births outnumbering deaths, as living conditions, sanitation and infant mortality improved. Migration was a minor contributor and occasionally negative during the Depression.
The assisted migration boom (1945 to late 1960s): Australia actively recruited migrants through assisted passage schemes, doubling the population from 8 million in 1949 to 12 million by 1968 in under 20 years. This era produced the fastest string of “million milestones” in the nation’s history, with a new million added roughly every 4 to 5 years.
The slowdown and diversification era (1970s to 1990s): Fertility fell sharply through the 1970s, migration policy diversified beyond Europe, and overall growth rates settled into a lower, steadier band.
The migration-driven boom (2000s to 2019): From the early 2000s, net overseas migration overtook natural increase as the dominant driver of growth, fueled by skilled migration, international education and a resources-investment boom that drew workers from overseas.
The COVID-19 shock (2020 to 2021): Border closures produced the first negative net overseas migration since 1946 and the slowest population growth in over a century.
The post-pandemic rebound and normalization (2022 to 2026): A sharp catch-up surge in arrivals was followed by a deliberate cooling as growth returned toward the pre-pandemic average.
Track Real-time Australia Population Growth @ AUSTRALIA POPULATION CLOCK
Natural Increase
Natural increase, births minus deaths, has become a smaller and steadier share of Australia’s growth. In the year to December 2025, natural increase was 111,500 people. The total fertility rate sat at 1.49 babies per woman in 2023-24, well below the replacement level of 2.1, and births have been broadly flat for several years even as the total population grows, because a larger and older population also produces more deaths each year. Deaths reached roughly 188,000 in the year to March 2025, up from around 183,000 two years earlier, reflecting the aging of the population rather than any decline in health outcomes.
Net Overseas Migration
Net overseas migration is the swing factor in Australia’s growth rate, and it has been the largest single component of population change since the mid-2000s.
- Permanent migration operates through Australia’s annual planning levels, covering skilled and family visa streams
- Temporary migration includes international students, working holiday makers and temporary skilled visa holders, and drives most of the year-to-year volatility in NOM
- International students were the largest single component of the post-pandemic migration surge, as universities and colleges rebuilt enrolments that had collapsed during border closures
- Skilled migration responds directly to labor shortages, particularly in health, construction and technology
- Humanitarian migration is a smaller but steady component, shaped by global displacement events
- Departures include both returning temporary migrants and Australians moving abroad, and departures typically rise a few years after any arrivals surge as temporary visa holders complete their stay
Net overseas migration was 547,300 people in 2023, the highest level on record, before easing to 311,000 in the year to September 2025 and 301,000 by December 2025 as the post-pandemic catch-up faded and policy settings tightened around student and graduate visas.
Why Australia’s Growth Rate Changes
Three forces explain most of the year-to-year swings in Australia’s growth rate. Economic cycles shape both interstate and international migration, since people move toward states and countries with stronger job markets. Migration policy, including annual permanent migration caps, student visa settings and skilled occupation lists, directly controls the largest component of growth. And demographic momentum, an aging population producing more deaths and fewer births relative to its size, gradually shrinks the natural increase component regardless of policy settings.
Australia’s Fastest-Growing States and Territories
| Rank | State/Territory | Annual growth rate (year to Sept 2025) |
|---|---|---|
| 1 | Western Australia | 2.2% |
| 2 | Victoria | ~1.8% |
| 3 | Queensland | ~1.8% |
| 4 | New South Wales | ~1.2% |
| 5 | South Australia | ~1.1% |
| 6 | Northern Territory | ~1.3% |
| 7 | Australian Capital Territory | ~1.3% |
| 8 | Tasmania | 0.3% |
Western Australia has held the fastest growth rate among all states and territories through 2024 and 2025, driven by strong net overseas migration tied to resources-sector employment. Tasmania has consistently recorded the slowest growth in the country, a pattern that has held for several consecutive years.
Population Growth Before, During and After COVID-19
Australia’s COVID-19 experience is one of the clearest natural experiments in the country’s demographic history. In the September 2020 quarter, Australia’s population fell for the first time on record in modern data, a decline of 4,200 people, as international students, temporary workers and New Zealand citizens left the country while border closures blocked new arrivals.
For the year to March 2021, population growth slowed to just 0.1%, the lowest rate in over a century, with net overseas migration turning negative for the first time since 1946 at -95,300 people, only partly offset by 131,000 in natural increase. Growth stayed near zero through most of 2021 before rebounding sharply once international borders reopened in late 2021, reaching 2.5% growth in both 2022-23 and calendar year 2023, before settling back toward the long-run average of around 1.4% to 1.5% by 2024-25.
Australia’s Population Growth Compared With Other Developed Countries
Australia’s growth rate has consistently outpaced most other high-income countries over the past two decades, largely because its migration intake is proportionally larger relative to population size than in the United States, United Kingdom or most of Western Europe.
Where several European countries and Japan have recorded population decline or near-zero growth driven by low fertility and limited migration, Australia’s growth has stayed positive throughout, aside from the isolated COVID-19 shock, because net overseas migration has consistently more than offset the country’s below-replacement fertility rate.
Projected Population Growth to 2050 and Beyond
The Centre for Population and ABS projections outline three broad scenarios rather than a single fixed number, since migration policy and fertility can both shift meaningfully over a 25-year horizon.
- Baseline scenario: Population growth gradually eases toward 1% to 1.3% annually as migration normalizes and natural increase continues shrinking, reaching roughly 33 to 34 million people by 2050
- Higher-growth scenario: Sustained strong net overseas migration keeps growth closer to 1.5%, pushing the population toward 36 to 38 million by 2050
- Lower-growth scenario: Tighter migration settings and continued fertility decline slow growth toward 0.7% to 0.9% annually, with the population reaching only around 30 to 31 million by 2050
Under most scenarios, net overseas migration remains the dominant driver of growth through 2050, while natural increase continues its long decline as the population ages further.
What Population Growth Means for Australia
- Housing: Demand for new dwellings continues to outpace construction in fast-growing states, particularly Western Australia, Victoria and Queensland
- Infrastructure: Roads, water and energy networks in outer-suburban growth corridors face the most direct pressure from rapid local population increases
- Jobs: Migration-driven growth has consistently added to labor supply in sectors facing skill shortages, including health care and construction
- Transport: Capital cities absorbing the bulk of overseas migration face the steepest increases in commuter demand
- Schools: Fast-growing outer-metropolitan areas regularly outstrip planned school capacity
- Healthcare: An aging population combined with continued growth increases demand for both general and aged-specific health services
- Water and energy: Population growth concentrated in already water-stressed and grid-constrained regions adds long-term planning pressure
Final Demographic Dashboard
| Indicator | Latest figure | Period |
|---|---|---|
| Total population | 27,801,023 | 31 December 2025 |
| Annual growth | 412,500 people (1.5%) | Year to December 2025 |
| Natural increase | 111,500 | Year to December 2025 |
| Net overseas migration | 301,000 | Year to December 2025 |
| Total fertility rate | 1.49 | 2023-24 |
| Fastest-growing state | Western Australia (2.2%) | Year to September 2025 |
| Slowest-growing state | Tasmania (0.3%) | Year to September 2025 |
| COVID-19 low point | 0.1% growth | Year to March 2021 |
| Post-pandemic peak | 2.5% growth | 2022-23 and calendar 2023 |
Key Findings
- Australia’s population reached 27,801,023 by 31 December 2025 and passed 28 million during 2026
- Net overseas migration drove roughly 73% of population growth in the year to September 2025, with natural increase contributing the remaining 27%
- The total fertility rate has fallen to 1.49 births per woman, well below the 2.1 replacement level
- COVID-19 produced the slowest annual growth in over a century, just 0.1% in the year to March 2021, and the first negative net overseas migration since 1946
- Growth rebounded to 2.5% in 2022-23 before easing back toward the long-run average of around 1.4% to 1.5%
- Western Australia has been the fastest-growing state through 2024-25; Tasmania the slowest
- Long-run projections place Australia’s population between roughly 30 million and 38 million by 2050, depending on migration settings
Recommended Articles Related to Australia Population & Policy:
- Australia Population Geography: Why Most Australians Live Along the Coast
- Australia Immigration Demographics: How Migration Is Shaping the Population Future
- Only 1 in 3 New Zealand-Born Residents Are Australian Citizens
- More Boys Are Born, But Australia Ends Up Mostly Female
- Australia Just Crossed a Line It Can Never Uncross: More Seniors Than Children
- From Age 55 to Age 81: How Australians Bought Themselves an Extra Generation of Life
- Australia Population by Religion: How a Once-Christian Nation Became One of the World’s Most Secular
- Australia Population by Ancestry: The Cultural Backgrounds Shaping Modern Australia
- One Country, Two Realities: Inside Australia’s Empty Interior and Packed Coastline
- Australia Population 2026 by State and Territory: Historical Trends and Future Growth
- After 150 Years, England Is No Longer Australia’s Top Birthplace: India Just Took Over
Frequently Asked Questions
1. What is Australia’s current population growth rate?
Australia’s population grew by 1.5% in the year to 31 December 2025, adding 412,500 people to reach 27,801,023.
2. What drives most of Australia’s population growth?
Net overseas migration, which accounted for roughly 73% of total population growth in the year to September 2025, compared with 27% from natural increase.
3. When did Australia’s population growth rate hit its lowest point?
In the year to March 2021, growth slowed to just 0.1%, the slowest rate in over a century, due to COVID-19 border closures.
4. Did Australia’s population ever decline?
Yes, briefly. The population fell by 4,200 people in the September 2020 quarter, the first quarterly decline in modern ABS records, and the country also saw a slight decline during 1916 due to World War I.
5. What is Australia’s total fertility rate?
1.49 births per woman as of 2023-24, below the 2.1 replacement level needed for natural increase alone to sustain the population long term.
6. Which state is growing fastest in Australia?
Western Australia, with annual growth of 2.2% in the year to September 2025, ahead of Victoria and Queensland.
7. Which state is growing slowest?
Tasmania, at 0.3% annual growth in the year to September 2025, a pattern that has persisted for several consecutive years.
8. How is net overseas migration calculated?
As overseas migration arrivals minus departures, counting anyone present in or absent from Australia for 12 months or more within a 16-month period.
9. When is Australia expected to reach 30 million people?
Under baseline migration and fertility assumptions, Australia is projected to reach around 30 million in the early 2030s, though the exact timing depends heavily on future migration levels.
10. What could Australia’s population be by 2050?
Projections range from roughly 30 to 31 million under a lower-growth scenario to 36 to 38 million under a higher-growth scenario, with most baseline projections clustering around 33 to 34 million.
Sources
- Australian Bureau of Statistics, National, State and Territory Population, September and December 2025 releases
- Australian Bureau of Statistics, Historical Population, 2021
- Australian Bureau of Statistics, Australia’s population grows by 2.5% (media releases, 2023 and 2024)
- Australian Bureau of Statistics, Australia’s population growth close to zero (media release, 2021)
- Centre for Population, National, State and Territory Population, March 2025
- Australian Institute of Health and Welfare, Profile of Australia’s population
- Lowy Institute, Surmounting Australia’s COVID immigration pause





