
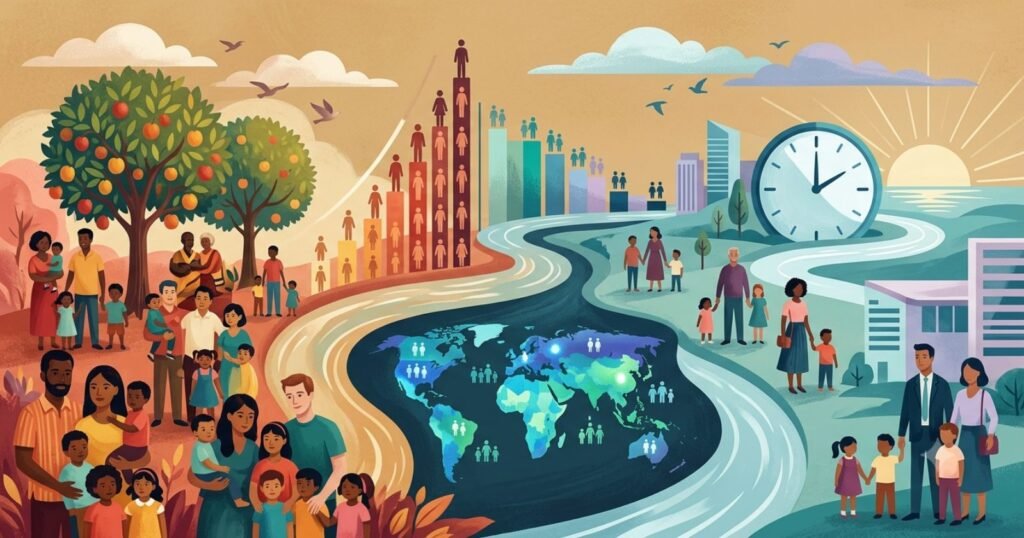
Somewhere on earth, a baby is born roughly every four seconds. Add those births up across a full year and the total comes to approximately 132 million, spread across nearly 200 countries but concentrated overwhelmingly in a small handful of them. That raw number, and the rate at which it is calculated against total population, is the crude birth rate, one of the oldest and most widely reported demographic statistics in the world, and one frequently confused with a related but different measure covered elsewhere in this series: the fertility rate.
The crude birth rate answers a narrower, more mechanical question than fertility rate does. It does not ask how many children a typical woman will have over her lifetime. It asks, simply, how many babies were born this year for every 1,000 people alive, a figure shaped as much by a country’s underlying age structure as by how many children each woman is actually having.
What Is the World Birth Rate?
- Definition of crude birth rate: the number of live births during a year, divided by the total midyear population, expressed per 1,000 people.
- Births per 1,000 people: the global crude birth rate stands at approximately 17 per 1,000 population as of 2024, according to World Bank and UN-derived estimates.
- How it is calculated: total annual live births divided by total population, multiplied by 1,000, a simpler calculation than the fertility rate but one that mixes together two separate effects.
- Why age structure affects the crude birth rate: a country with a young population, many people currently in their reproductive years, will post a higher crude birth rate than a country with identical fertility per woman but an older population structure, simply because a larger share of its people are of childbearing age.
How Many Babies Are Born Around the World?
- Annual number of global births: approximately 132 million in 2024, according to Our World in Data’s analysis of UN figures.
- Historical changes: annual global births have leveled off after decades of growth, and the UN projects the figure will remain close to 135 million for roughly the next two decades before beginning a gradual decline.
- Births per day: approximately 361,600, based on 132 million annual births divided across 365 days.
- Births per hour: approximately 15,070.
- Long-term trend: unlike total population, which continues rising, annual global births have essentially plateaued, meaning the raw number of new humans added to the planet each year is no longer growing the way it did throughout most of the 20th century.
Key note: Six countries, India, the Democratic Republic of the Congo, Egypt, Ethiopia, Nigeria, and Pakistan, together accounted for approximately 43 percent of all births worldwide in 2024, according to the UN’s World Fertility 2024 report, an extraordinary concentration in a world of nearly 200 countries.
Countries With the Highest Birth Rates
| Country | Approximate Crude Birth Rate (per 1,000) | Region |
|---|---|---|
| Central African Republic | ~45-46 | Africa |
| Chad | ~39-40 | Africa |
| Somalia | ~37-38 | Africa |
| Niger | ~46-47 | Africa |
| Democratic Republic of the Congo | ~39 | Africa |
| Angola | ~41 | Africa |
| Mali | ~40 | Africa |
Twenty-nine countries and territories worldwide currently post a crude birth rate above 30 per 1,000 people, and 27 of them sit in Africa, with Afghanistan and Yemen the only exceptions. High infant mortality remains part of the explanation in several of these countries, since higher birth rates have historically helped offset higher rates of child death, alongside cultural and economic factors favoring larger families in agricultural, small-scale farming economies.
Countries With the Lowest Birth Rates
At the opposite extreme, the Holy See posts the world’s lowest crude birth rate, at approximately 4.3 per 1,000, followed closely by South Korea and San Marino, both under 5. These figures reflect two very different underlying situations layered together: extremely low fertility per woman, and, in most of these countries, an unusually old population structure that further compresses the crude birth rate beyond what fertility alone would predict.
South Korea illustrates this compounding effect clearly. Its total fertility rate of roughly 0.72 to 0.76 children per woman is already among the lowest ever recorded, and its correspondingly older population structure, with a shrinking share of residents in their prime childbearing years, pushes its crude birth rate even lower still.
Birth Rate Versus Fertility Rate
The distinction between these two measures matters more than it might first appear, because they can tell noticeably different stories about the same country.
- Key difference: fertility rate isolates reproductive behavior per woman; birth rate mixes reproductive behavior together with a population’s overall age structure.
- Why a country can have moderate fertility but a low birth rate: an aging country with fertility close to replacement level can still post a comparatively low crude birth rate if a shrinking share of its total population sits in prime childbearing years.
- Role of population age structure: two countries with identical fertility rates can post very different crude birth rates purely because one has a younger population and the other an older one.
- Examples of young versus aging countries: Niger’s crude birth rate is elevated by both very high fertility and a young population structure working in the same direction; Japan’s low crude birth rate reflects both low fertility and an aging population structure compounding each other in the opposite direction.
Why Global Birth Rates Are Falling
- Fertility decline: the underlying collapse in children per woman, covered in depth elsewhere in this series, is the primary driver of the falling global birth rate.
- Smaller families: family size preferences have shifted across nearly every world region over the past half century.
- Later parenthood: rising average age at first birth compresses the total number of births occurring within any given year.
- Urbanization: children carry less economic value as household labor in cities than in rural, agricultural settings.
- Female education: rising educational attainment among women correlates closely with delayed childbearing and smaller completed family sizes.
- Contraception: expanded access to modern contraception has given women far greater control over both the timing and total number of births.
- Economic and social changes: rising housing and childcare costs, alongside shifting social norms around family size, have reinforced the decline across a wide range of economies.
Where Will Most Future Babies Be Born?
- Africa: Sub-Saharan Africa’s share of global births is projected to keep rising for decades, even as its own birth rate gradually declines, simply because its population is growing so much faster than the rest of the world’s.
- South Asia: India, Pakistan, and Bangladesh together continue to account for a substantial share of annual global births, even as fertility falls across the region.
- Other high fertility regions: parts of the Middle East, including Afghanistan and Yemen, remain outliers with birth rates well above their immediate regional neighbors.
- Shifting global share of births: as fertility continues falling fastest in Asia and Latin America, Africa’s share of the world’s annual births is projected to rise from roughly a quarter today toward well over a third by mid-century.
- Future birth projections: the UN projects annual global births will hold close to 135 million for roughly the next two decades before beginning a gradual decline as falling fertility outpaces the continued growth in the number of women of reproductive age.
Births and Global Population Growth
- Births versus deaths: in 2024, the world recorded approximately 132 million births against approximately 63 million deaths, a net natural increase of roughly 69 million people.
- Natural population increase: this gap between births and deaths, independent of migration, remains the primary driver of global population growth, since international migration nets to zero at the global level.
- Migration as a separate population driver: migration reshuffles where people live but does not change the global total, unlike the birth-death gap, which does.
- Why declining birth rates do not immediately stop population growth: population momentum, the continued growth in the number of women of reproductive age even as fertility per woman falls, keeps total births above total deaths for decades after fertility rates begin declining.
The Future of Global Births
- Expected global births: annual births are projected to hold roughly steady near 135 million for the next two decades before beginning a slow decline in the second half of the century.
- Declining child populations: as covered elsewhere in this series, the global under-15 population is projected to plateau and then gradually shrink even as total population keeps rising toward its projected peak.
- Regional differences: the geographic center of the world’s births is shifting decisively toward Sub-Saharan Africa, even as the absolute global total stops growing.
- Implications for schools, healthcare, and future workers: where births are concentrated today determines where the demand for schools, pediatric healthcare, and eventually entry-level jobs will be concentrated for the next two decades, making today’s birth geography one of the clearest available previews of tomorrow’s workforce map.
Frequently Asked Questions
1. What is the world’s crude birth rate?
Approximately 17 births per 1,000 people as of 2024.
2. How many babies are born worldwide each year?
Approximately 132 million, according to recent UN-derived estimates.
3. How many babies are born per day worldwide?
Approximately 361,600, based on annual births divided across the year.
4. What is the difference between birth rate and fertility rate?
Birth rate counts births per 1,000 total population and is heavily shaped by age structure, while fertility rate measures average children per woman independent of how many people happen to be of reproductive age.
5. Which country has the highest birth rate in the world?
Niger and the Central African Republic, both posting crude birth rates above 45 per 1,000 people.
6. Which country has the lowest birth rate in the world?
The Holy See, at approximately 4.3 per 1,000, followed closely by South Korea and San Marino.
7. Which countries account for the largest share of global births?
India, the Democratic Republic of the Congo, Egypt, Ethiopia, Nigeria, and Pakistan together accounted for approximately 43 percent of all births worldwide in 2024.
8. Are global births still increasing?
No. Annual global births have essentially plateaued near 132 to 135 million and are projected to begin gradually declining within the next two decades.
9. Why can a country have moderate fertility but a low birth rate?
Because its overall population may be older, with a smaller share of residents currently in prime childbearing years, which mechanically lowers the crude birth rate regardless of fertility per woman.
10. Which region will account for the largest share of future births?
Sub-Saharan Africa, whose share of global births is projected to keep rising for decades even as its own birth rate gradually declines.
Sources
- United Nations, World Fertility 2024, Population Division, Department of Economic and Social Affairs
- Our World in Data, “How Many People Die and How Many Are Born Each Year?”
- World Bank, “Birth Rate, Crude (per 1,000 People),” based on UN World Population Prospects 2024
- StatisticsTimes.com, “Countries by Birth Rate 2024”
- The Global Economy, “Birth Rate by Country, Around the World”





