
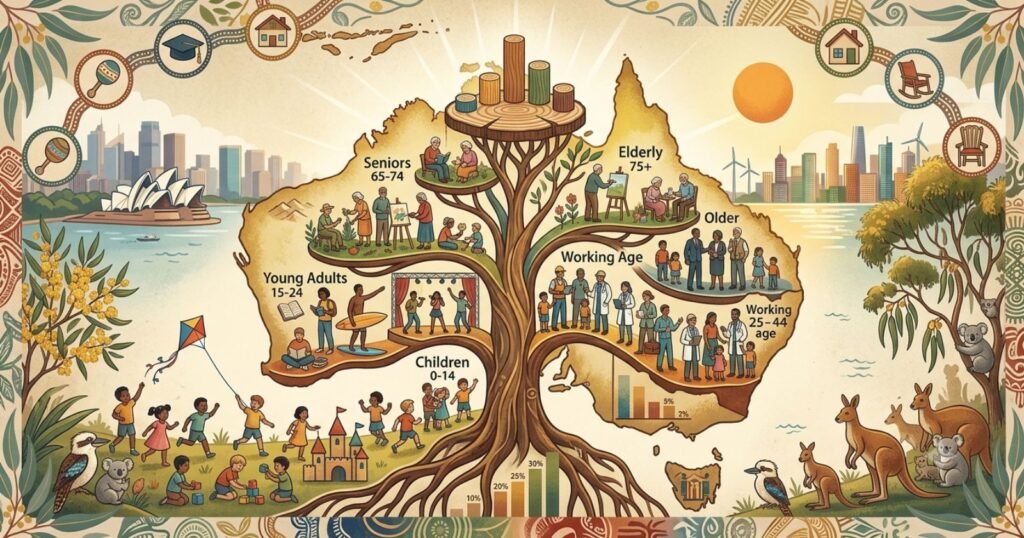
Sometime in 2024, Australia crossed a threshold it can never uncross: for the first time in its history, the country had more people aged 65 and over than children aged under 15. At 30 June 2025, the 65-plus population stood at 4.84 million against 4.80 million children, a gap of just 40,000 people that will only widen from here. This is the moment Australia’s age structure quietly flipped from a young country’s pyramid toward an aging nation’s column.
Australia’s Population by Major Age Group Today
Based on the Australian Bureau of Statistics Estimated Resident Population at 30 June 2025 (base population 27,613,654):
| Age group | Approx. population | Share of total |
|---|---|---|
| 0–14 | 4.80 million | 17.4% |
| 15–24 | ~3.4 million | 12.3% |
| 25–44 | ~8.1 million | 29.3% |
| 45–64 | ~6.5 million | 23.5% |
| 65–74 | ~2.6 million | 9.4% |
| 75–84 | ~1.5 million | 5.4% |
| 85+ | ~0.75 million | 2.7% |
The national median age was 38.4 years in 2024-25, meaning half of all Australians are older than 38 and half younger. Among the total 2021 Census population, the male median age was 37 and the female median age was 39, a gap driven almost entirely by women living longer at the oldest ages.
Australia’s Age Structure Since 1901
Australia’s age profile has transformed twice over in little more than a century. At Federation in 1901, the median age sat in the low twenties, a young colonial population still shaped by high birth rates and comparatively short lifespans. By 1987, the working-age population (15-64) held steady around 66.6% and those 65 and over made up just 10.7% of the country. By June 2007, the national median age had reached 36.8 years, and the 65-plus share had climbed to 13.1%.
In the 1994-95 financial year, median age stood at 33.7 years and the 65-plus share was 12%. Thirty years later, in 2024-25, median age reached 38.4 years and the 65-plus share had risen to 18%, the fastest sustained aging the country has recorded outside of a full generational replacement.
Children and Young Australians
Children aged 0-14 made up 17.4% of the population in mid-2025, continuing a long, slow decline from 21.5% in 1987. That decline tracks Australia’s falling fertility rate almost exactly.
The total fertility rate fell from 1.84 births per woman in 1994-95 to 1.52 in 2024-25, and just 292,318 births were registered in calendar 2024, a modest 1.9% rise on 2023 but still historically low relative to the size of the adult population. Registered births reached 300,000 in the 2024-25 financial year, following 290,000 the year before, the lowest annual count since 2006-07.
The decline is concentrated among women under 30, who are increasingly delaying parenthood into their 30s without fully offsetting the shortfall with higher births later in life. State by state, the child population share is highest in the Northern Territory and lowest in Tasmania and South Australia, mirroring those states’ median age extremes.
Australia’s Working-Age Population
The working-age population, defined as 15 to 64 years, remains the backbone of Australia’s labor force and tax base, accounting for roughly 64.2% of the population, or approximately 17.3 million people, in the most recent estimates. That share has drifted down slightly from 67.5% in 2007 as the population ages at both ends.
The more revealing number is the old-age dependency ratio, the number of people 65 and over for every 100 people of working age, which climbed from 15.3 in 1983-84 to 26.3 in 2022-23, and is projected to keep rising as Baby Boomers move fully into retirement. A rising dependency ratio means fewer working-age Australians are available, in relative terms, to support the health, aged care and pension costs of each retiree.
Millennials, Gen X, Baby Boomers and Younger Generations
Generational labels map roughly onto today’s age brackets. Baby Boomers, born 1946 to 1964, now sit almost entirely within the 60-79 age range and form the bulk of Australia’s fastest-growing 65-74 and 75-84 cohorts.
Generation X, born 1965 to 1980, occupies the 45-59 bracket and represents the largest share of Australia’s peak-earning, peak-tax-paying population. Millennials, born 1981 to 1996, span roughly 29 to 44 years old, and are now the largest single generational bloc within the 25-44 age group that anchors Australia’s workforce and housing demand.
Generation Z, born 1997 to 2012, is moving through the 15-24 bracket into early adulthood, and Generation Alpha, born from 2013 onward, makes up the bulk of the 0-14 cohort. Each successive generation has been smaller relative to the total population than the one before it in proportional terms, even as absolute numbers rise through migration.
Australia’s 65+ Population
The 65-plus population has grown from roughly 10.7% of Australians in 1987 to 18% in 2024-25, an increase from around 1.6 million people to 4.84 million over less than four decades.
Annual growth in this cohort has consistently outpaced total population growth for over a decade; in the year to June 2007 alone, the 65-plus population grew 2.7%, adding 72,000 people in a single year, a pace that has only accelerated as the largest Baby Boomer birth cohorts pass 65.
Under the Intergenerational Report’s central projections, the 65-plus share is expected to reach 24.0% of the population by 2064-65, up from 17.3% in 2022-23.
The 85+ Population
The oldest-old, those aged 85 and over, deserve separate treatment because they place the most concentrated demand on aged care, palliative and high-acuity health services of any age group. This cohort already grew 7.1% in a single year as far back as 2006-07, faster than any other age bracket at the time, and now numbers around 750,000 people.
Because this group is drawn from birth cohorts born in the 1930s and 1940s, a comparatively small generation, its growth has been steadier than the 65-74 bracket, but it is set to accelerate sharply in the 2030s and 2040s as the large Baby Boomer cohorts reach their mid-eighties.
Median Age Across Australia
| State/Territory | Approx. current median age |
|---|---|
| Tasmania | 42 years (oldest) |
| South Australia | 41 years |
| Victoria | ~38 years |
| New South Wales | ~38 years |
| Queensland | ~38 years |
| Western Australia | ~37 years |
| Australian Capital Territory | 35 years |
| Northern Territory | 33 years (youngest) |
Tasmania overtook South Australia as Australia’s oldest state as early as 2007, when its median age reached 39.1 years against South Australia’s 38.9, and the gap between the two has persisted ever since, driven by younger Tasmanians migrating to the mainland for study and work.
The Northern Territory has held the youngest median age in the country for decades, partly due to a younger Aboriginal and Torres Strait Islander population and partly due to a transient workforce of younger adults on shorter-term postings.
Australia’s Youngest and Oldest Regions
Within states, the contrast is even sharper than the state averages suggest. Acton and Duntroon in the Australian Capital Territory, both dominated by university and defense populations, recorded median ages of just 19.9 and 21.1 years respectively.
Clayton (North)-Notting Hill in Victoria and St Lucia in Queensland, both university precincts, sit in the mid-20s. At the other extreme, Tea Gardens-Hawks Nest in New South Wales recorded a median age of 65.5 years, the oldest in the country, followed by nearby Tuncurry at 62.3, both classic coastal retirement destinations.
Remote areas with large Aboriginal and Torres Strait Islander populations, such as Victoria River in the Katherine region at 26.2 years, sit at the younger end for entirely different reasons tied to higher fertility and shorter life expectancy rather than lifestyle migration.
Population Aging and Migration
Migration is the main lever slowing Australia’s aging rate, since most migrants arrive in their 20s and 30s. Capital cities, which absorb the bulk of net overseas migration, have consistently younger median ages than their surrounding states; the median age for capital cities nationally sits around 36.9 years, younger than the country as a whole. Darwin, the youngest capital at 34.8 years, and Canberra at 35.7 years, both benefit from this migration effect combined with transient education and public-service populations.
Without continued migration at current levels, demographers project Australia’s aging would accelerate considerably faster than current projections show, since natural increase alone is no longer enough to offset a fertility rate of 1.52 births per woman.
Australia’s Age Structure in 2030
By the early 2030s, the last and largest Baby Boomer cohorts, those born in the late 1950s and early 1960s, will have moved fully past 65, pushing the 65-plus share toward roughly 19-20% of the population. The working-age dependency ratio is projected to continue climbing steadily through this period as Millennials and Generation X fill most of the workforce while Generation Z enters it in smaller relative numbers than the generations before them.
Australia’s Age Structure in 2050
Longer-run ABS and Treasury projections place Australia’s population between 34.3 and 45.9 million by 2071, with median age climbing to somewhere between 43.8 and 47.6 years under different migration and fertility assumptions.
The Intergenerational Report’s central case has median age reaching 43.6 years by 2064-65 and the 65-plus share reaching 24.0%. State-level projections diverge sharply: Tasmania is expected to remain the oldest state, with a projected median age between 46.3 and 52.2 years by the early 2080s, while the Northern Territory is expected to remain the youngest, at between 37.3 and 40.7 years over the same horizon.
The gap between Australia’s youngest and oldest state median age, just 5.3 years in 1975-76, had already widened to 8.2 years by 2021-22 and is projected to reach 10.3 years by 2035-36.
What Aging Means for Australia
- Retirement: A rising dependency ratio, from 15.3 in 1983-84 to 26.3 in 2022-23, means fewer working-age Australians per retiree, intensifying pressure on superannuation adequacy and the age pension
- Workforce: Slower growth in the working-age share increases reliance on migration and later workforce participation to sustain labor supply
- Healthcare: Demand for chronic disease management and specialist geriatric care rises fastest in the 65-74 and 75-84 brackets
- Aged care: The fast-growing 85-plus population drives the steepest increase in demand for high-acuity residential and home-based aged care
- Housing: An aging population shifts housing demand toward downsizing, accessible design and retirement-specific housing stock, particularly in regional retirement destinations
- Government spending: Treasury’s Intergenerational Report identifies an aging population as one of the primary long-term drivers of rising health, aged care and pension expenditure as a share of the federal budget
Key Findings
- Australia’s 65-plus population overtook its 0-14 population for the first time by mid-2025, at 4.84 million versus 4.80 million
- The national median age reached 38.4 years in 2024-25, up from 33.7 years just three decades earlier
- The working-age population (15-64) has slipped to around 64.2% of the total, down from 67.5% in 2007
- The old-age dependency ratio has nearly doubled since the early 1980s, from 15.3 to 26.3 people 65-plus per 100 working-age Australians
- Tasmania remains Australia’s oldest state at a median age around 42, while the Northern Territory remains the youngest at around 33
- By 2064-65, the 65-plus share is projected to reach 24.0% of the population under Treasury’s central case
- The total fertility rate has fallen to 1.52 births per woman, well below replacement level, reinforcing the long-term aging trend
Frequently Asked Questions
1. What is the median age in Australia?
38.4 years as of 2024-25, meaning half the population is older and half younger than that age.
2. Are there more children or more older Australians now?
More older Australians. By mid-2025, the 65-plus population (4.84 million) had overtaken the 0-14 population (4.80 million) for the first time on record.
3. What percentage of Australia’s population is working age?
Around 64.2%, covering people aged 15 to 64, down from 67.5% in 2007 as the population ages at both ends.
4. Which Australian state has the oldest population?
Tasmania, with a median age of roughly 42 years, ahead of South Australia at around 41 years.
5. Which Australian state or territory has the youngest population?
The Northern Territory, with a median age of roughly 33 years, followed by the Australian Capital Territory at around 35 years.
6. How fast is Australia’s 65+ population growing?
It has grown from about 10.7% of the population in 1987 to 18% in 2024-25, consistently outpacing total population growth for over a decade.
7. What is Australia’s total fertility rate?
1.52 births per woman in 2024-25, down from 1.84 three decades earlier and well below the 2.1 replacement level.
8. What will Australia’s median age be in 2050?
Government projections place it around 43 to 44 years by the mid-2060s under central assumptions, with a range of 43.8 to 47.6 years by 2071 depending on migration and fertility settings.
9. Why do capital cities have younger populations than the rest of their states?
Because migration, both international and interstate, concentrates young adults in capital cities for education and employment, while older residents are more likely to remain in or move to regional and coastal areas.
10. What is the old-age dependency ratio and why does it matter?
It measures the number of people aged 65 and over for every 100 working-age Australians. It has risen from 15.3 in 1983-84 to 26.3 in 2022-23, directly affecting the fiscal sustainability of health, aged care and pension spending.
Sources
- Australian Bureau of Statistics, National, State and Territory Population, June and December 2025 releases
- Australian Bureau of Statistics, Regional population by age and sex, 2024
- Australian Bureau of Statistics, Births, Australia, 2024
- Australian Institute of Health and Welfare, Profile of Australia’s population
- Centre for Population, 2025 Population Snapshot
- The Treasury, 2023 Intergenerational Report
- Australian Bureau of Statistics, Population Projections, Australia, 2022 (base) to 2071
- Australian Bureau of Statistics, Australian Demographic Statistics, historical releases (2007, 2018, 2019)





