There are roughly 42 million more men than women on Earth in 2026, yet in the age group where it matters most for daily life expectancy, women outnumber men by more than two to one. That contradiction is the starting point for understanding how humanity is actually distributed across age and sex. A single global tally of 4.17 billion males and 4.13 billion females tells almost nothing about what the population looks like at any specific age, because the balance between men and women shifts dramatically and predictably as a cohort moves from birth to old age.
This is why demographers rarely stop at the headline sex ratio. They build a population pyramid instead, a chart that stacks every age group by sex and reveals, at a glance, where a country or the planet sits in its demographic transition.
The Global Population by Age and Sex at a Glance
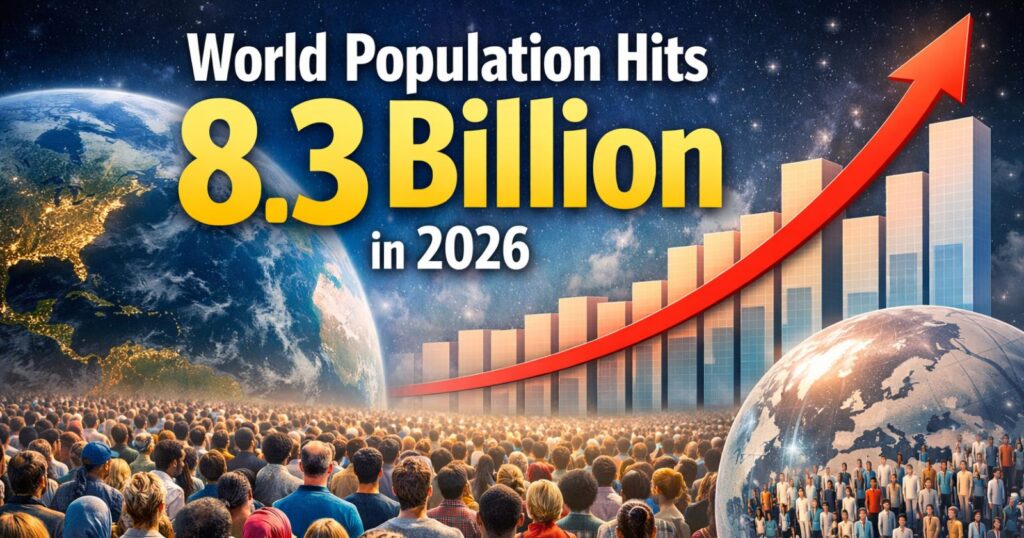
The world population reached approximately 8.3 billion people in 2026, split into about 4.17 billion males (50.26 percent) and 4.13 billion females (49.74 percent), according to UN Population Division data compiled by StatisticsTimes and World Bank gender statistics. Men have outnumbered women globally every year since 1971, when the world crossed from a female-majority to a male-majority population for the first time in recorded demographic history.
That male surplus, however, is almost entirely a product of two countries. China and India together carry a large excess of men, driven historically by elevated sex ratios at birth. Strip those two countries out of the calculation and the rest of the world has more women than men. Roughly 140 of the world’s 195 or so countries and territories have female-majority populations; the global figure only tips male because of population-weighting toward Asia’s two demographic giants.
Age changes the picture just as much as geography does:
- Sex ratio at birth: about 105.3 boys per 100 girls, the biologically typical range observed almost everywhere except where sex-selective practices distort it
- Ages 0 to 14: roughly 105.8 boys per 100 girls, reflecting the birth ratio carried forward with only mild differential mortality
- Ages 15 to 19: the male-to-female ratio peaks around 106.6, the highest point across the entire lifespan
- Ages 15 to 64 (working age): about 103.2 men per 100 women
- Age 65 and over: the ratio flips hard, to roughly 80 men per 100 women
- Age 90 to 94: women outnumber men by about 2 to 1
- Age 100 and over (centenarians): women outnumber men by roughly 4 to 1
That last row explains the opening statistic. The global population is male-majority only because of how births and working-age migration are distributed; by the time a cohort reaches advanced old age, the sex composition has reversed entirely.
How the World Population Pyramid Is Structured
A population pyramid stacks age groups in five-year bands, men on one side and women on the other, from infants at the base to the oldest survivors at the peak. Three broad shapes recur in demographic literature, and the world as a whole is currently transitioning between the first two.
Expanding pyramids have a wide base and taper steadily toward the top, indicating high fertility and a young population where each successive birth cohort is larger than the one before it. Niger, Chad, and much of the Sahel still show this classic triangular shape.
Contracting or stationary pyramids bulge in the middle, at working ages, with a narrower base because fertility has fallen below the level needed to replace each generation. Germany, Japan, Italy, and South Korea are the clearest examples, with pyramids that look more like inverted cones or even urns, wider at the top than the bottom.
The global pyramid sits between these extremes. It is no longer a clean triangle because fertility has fallen from about 4.8 births per woman in 1970 to roughly 2.3 today, but it has not yet inverted because the enormous cohorts born in the 1990s and 2000s are still moving through their reproductive years. The UN’s 2024 revision projects that women aged 15 to 49 will keep growing in absolute number, from nearly 2 billion in 2024 to a peak of about 2.2 billion in the late 2050s, which alone will keep pushing global births upward even as the average number of children per woman continues to fall.
World Population by Broad Age Band, 2024
| Age Group | Approximate Share of World Population | Approximate Population |
|---|---|---|
| 0 to 14 years | 24.7% | 2.03 billion |
| 15 to 64 years (working age) | 64.9% | 5.32 billion |
| 65 and over | 10.3% | 0.85 billion |
Figures are rounded from UN World Population Prospects 2024 and UNFPA World Population Dashboard age-share indicators; totals may not sum exactly due to rounding.
Men and Women Across the Life Course
Birth and Early Childhood
Sex ratio at birth sits naturally around 105 boys per 100 girls in almost every population without external interference, a pattern so consistent across history and geography that demographers treat any strong deviation from it as a signal of sex-selective practices. A handful of countries, mostly in East and South Asia, have shown elevated birth ratios in past decades tied to a cultural preference for sons combined with access to prenatal sex determination; several of those countries, including China, have seen the ratio move back toward the biological norm as policy and social change progressed.
Adolescence and Young Adulthood
The male-to-female ratio actually widens slightly after birth, peaking around ages 15 to 19 at roughly 106.6 males per 100 females, before beginning a long, steady decline. This reflects two things happening simultaneously: the birth cohort’s original sex ratio is still largely intact, and adult male mortality has not yet started eroding the male share.
Working-Age Adults
Through the core working-age range, the ratio remains modestly male-leaning worldwide, around 103 men per 100 women, though this masks large country-level variation driven by labor migration. Gulf states such as Qatar (about 246 males per 100 females) and the UAE (about 181) show extreme male skews because of male-dominated migrant labor forces, while countries with high rates of male out-migration, or historically elevated male mortality from conflict, run in the opposite direction. Russia is a well-known example on the female-heavy end, with a sex ratio around 86 men per 100 women overall, a legacy in part of both historical mortality shocks and a persistent gap in adult male life expectancy.
Older Adulthood and Advanced Old Age
This is where the global pattern becomes most consistent and least dependent on migration or cultural factors. From roughly age 50 onward, women begin to outnumber men in nearly every population on Earth, and the gap widens with each successive age band:
- Ages 60 to 64: about six fewer men than women per 100
- Age 65 and over: roughly 80 men per 100 women globally
- Ages 90 to 94: about 50 men per 100 women (women outnumber men 2 to 1)
- Age 100 and over: about 25 men per 100 women (women outnumber men roughly 4 to 1)
The mechanism is almost entirely biological and behavioral rather than geographic. Male mortality rates exceed female mortality rates at nearly every adult age, a pattern documented across virtually every country regardless of income level, health system, or culture, though the size of the gap varies with factors like smoking history, occupational hazard exposure, and cardiovascular risk.
How Age Structure Differs Across World Regions
Median age is the single most useful summary statistic for comparing the age structure of different regions, because it condenses an entire pyramid shape into one number: half the population is older, half is younger.
Median Age by World Region
| Region | Approximate Median Age | Notable Characteristic |
|---|---|---|
| Africa | 19.4 years | Youngest region globally; only region with a still-rising birth rate this century |
| Asia | 30.2 to 30.3 years | Wide internal range, from Japan’s high 40s to Afghanistan’s high teens |
| Latin America and the Caribbean | 29.2 to 31 years | Aging faster than any other region; projected to become the oldest region by 2100 |
| Northern America | Low-to-mid 30s, among the oldest currently | High life expectancy combined with below-replacement fertility |
| Europe | Low-to-mid 40s | First region where population aged 65+ outnumbered those under 15, around 2005 |
| Oceania | Low-to-mid 30s | Mixed pattern; Australia and New Zealand skew older, Pacific Island states skew much younger |
Regional figures compiled from UN Population Division and World Bank age-distribution data; individual country figures vary widely within each region.
Africa’s youth is structural rather than temporary. The continent’s total fertility rate remains well above replacement across most countries, and more than 60 percent of its population is under age 25, roughly 20 percentage points above the global share. Africa’s population is projected to nearly quadruple between 2015 and 2100, rising from about 1.19 billion to close to 4.4 billion, and to account for close to 40 percent of the world’s population by the end of the century, up from about 16 percent in 2015.
Europe sits at the opposite pole. It became the first major world region where people aged 65 and older outnumbered children under 15, a milestone reached around 2005, and by 2050 roughly one in four Europeans is projected to be 65 or older. As of January 2025, the EU’s own population, 450.6 million people, already had 22.0 percent of its members aged 65 or over, with a median age of 44.9 years, up sharply from 43.9 just five years earlier.
Why Men and Women Are Distributed Differently
Four separate mechanisms combine to produce the age-and-sex patterns described above, and none of them alone explains the full picture.
Sex ratio at birth sets the starting point, and it is close to universal at roughly 105 boys per 100 girls, with departures from that norm concentrated in a small number of countries with documented sex-selective practices.
Differential mortality by sex is the dominant force reshaping the ratio after birth. Men die at higher rates than women at nearly every adult age, from a combination of biological factors (women’s two X chromosomes appear to confer some cardiovascular and immune advantages) and behavioral or occupational factors that vary by country and era, including smoking, alcohol use, workplace injury risk, and historically, combat mortality. The cumulative effect is that women’s numerical advantage widens continuously from midlife onward.
Migration by sex reshapes the picture at working ages specifically, and its effects are highly country-specific rather than universal. Labor migration corridors into the Gulf states, for instance, are overwhelmingly male, producing sex ratios in destination countries that no fertility or mortality pattern could explain on its own.
Conflict and historical mortality shocks leave long visible scars on a population pyramid that can persist for decades. Russia’s female-skewed sex ratio, for example, reflects not only ongoing gaps in male life expectancy but also the demographic legacy of 20th-century mortality events that removed a disproportionate share of men from certain birth cohorts, an imbalance that continued to show up in the population structure for the rest of those cohorts’ lives.
How the Global Sex and Age Structure Is Changing
The shift already visible in the data is a move from a young, fast-growing population toward an older, slower-growing one, and it is happening on a timeline demographers can chart with reasonable confidence through mid-century, with more uncertainty further out.
Global Age Structure, Estimated and Projected
| Year | Median Age (World) | Share Aged 65+ | Share Aged 0 to 14 |
|---|---|---|---|
| 1970 | 20.3 years | Not a majority concern; well under 5% | Roughly 37% |
| 2024 | Approximately 30.9 years | Just under 13% (age 60+) | Approximately 25% |
| 2054 | Projected high 30s | Rising sharply as large cohorts age in | Continuing to fall |
| 2100 (projected) | 42.1 years | 28.8% | Falling roughly ten percentage points from 2024 |
Historical figures from UN DESA and Statista compilations of World Population Prospects 2024; 2054 and 2100 figures are medium-variant UN projections and should be read as scenarios rather than certainties.
Two forces are driving this simultaneously. Life expectancy at birth reached 73.3 years globally in 2024, up 8.4 years since 1995, and is projected to reach around 77.4 years by 2054 as mortality continues to fall, particularly in lower-income regions still catching up to global averages. At the same time, the global fertility rate has fallen from 3.3 births per woman in 1990 to 2.3 in 2024, and more than half of all countries and territories worldwide now have fertility below the 2.1 replacement threshold.
Even so, the global population is not close to shrinking. The UN’s medium-variant projection has world population continuing to grow for another 50 to 60 years, peaking at around 10.3 billion in the mid-2080s before beginning a slow decline toward roughly 10.2 billion by 2100. The main reason growth continues even as fertility falls is population momentum: today’s unusually large cohorts of young people, a legacy of high past fertility, are projected to account for 79 percent of the total population increase through 2054, or around 1.4 billion additional people, essentially independent of what happens to the fertility rate itself.
What the Age and Sex Structure Means for Society
A population’s age-and-sex profile is not an abstract statistic; it shapes concrete demand for schools, jobs, housing, and healthcare years in advance, because the people who will need those services in 2040 are already alive and countable today.
Countries with young, expanding pyramids, concentrated heavily in sub-Saharan Africa, face rising demand for primary and secondary education and, over the following decade, for entry-level jobs, a challenge described in demographic literature as the test of whether a large youth cohort becomes a demographic dividend or a source of youth unemployment and instability.
Countries with older, contracting pyramids, concentrated in Europe, East Asia, and increasingly parts of Latin America, face the reverse problem: a shrinking working-age base supporting a growing number of pensioners, alongside rising demand for long-term and geriatric care. Because women dominate the oldest age groups so heavily, roughly 4 to 1 among centenarians, policies aimed at eldercare, widow support, and pension adequacy in old age are disproportionately policies affecting women, even when they are written in gender-neutral language.
Conclusion
A single global sex ratio obscures far more than it reveals. Humanity’s population is male-majority only because of the outsized weight of China and India, and that male edge evaporates entirely by the time a cohort reaches its later decades, replaced by a widening female majority that reaches roughly 4 to 1 among centenarians.
The more consequential story is structural: the world is moving from a young, fast-growing population toward an older, slower-growing one, driven by fertility that has fallen from 4.8 to 2.3 births per woman since 1970 and life expectancy that has climbed past 73 years. That transition is not uniform. Africa’s median age of 19.4 sits at one extreme, Europe’s low-to-mid 40s at the other, and the gap between them is projected to widen before it narrows, as Africa’s population growth continues while Europe’s population begins to contract within the coming decades.
Frequently Asked Questions
1. How many men and women are there in the world?
As of 2026, there are approximately 4.17 billion men (50.26 percent) and 4.13 billion women (49.74 percent) globally, a surplus of about 42 million men, driven almost entirely by China and India.
2. Which age group is the largest worldwide?
The working-age population, 15 to 64 years, is by far the largest band, holding close to 65 percent of the global population, or roughly 5.3 billion people.
3. Are there more men or women globally?
Slightly more men overall, but only because of China and India’s combined population weight. Excluding those two countries, the rest of the world has a female-majority population, and around 140 of roughly 195 countries have more women than men.
4. Why are there more women among older people?
Men have higher mortality rates than women at nearly every adult age, a gap driven by a mix of biological and behavioral factors. That gap compounds year after year, so by advanced old age, such as ages 90 to 94, women outnumber men roughly 2 to 1, and among centenarians, roughly 4 to 1.
5. Which regions have the youngest populations?
Africa, with a median age of about 19.4 years, is by far the youngest major region, roughly ten years younger than the next-youngest regions, Asia and Latin America and the Caribbean, both in the low 30s.
6. What does a population pyramid show?
It displays the number or share of people in each five-year age band, split by sex, revealing at a glance whether a population is young and expanding (wide base, narrow top), aging and stabilizing (bulging middle), or contracting (narrower at the base than the middle).
7. When did men start outnumbering women globally?
1971 was the first year the global population tipped from female-majority to male-majority, and men have outnumbered women in every year since.
8. Which country has the most extreme sex ratio?
Qatar has the highest recorded ratio, at roughly 246 men per 100 women, a result of a very large, male-dominated migrant labor force rather than any birth or mortality pattern.
9. Will the world’s population ever become female-majority again?
UN projections suggest the global sex ratio is expected to shift back toward parity and eventually tip female-majority again, with some projections pointing to around 2088, as aging continues to expand the older, female-skewed segment of the population relative to the working-age segment where male migration concentrates.
10. How is the age structure of the world expected to change by 2100?
The share of people aged 65 and over is projected to rise from just under 13 percent (60+) in 2024 to 28.8 percent of the population by 2100, while the share under 15 is expected to fall by roughly ten percentage points over the same period, continuing the shift from a young global population toward an older one
Sources
- United Nations, World Population Prospects 2024: Summary of Results, UN Department of Economic and Social Affairs, Population Division, 2024
- United Nations Population Fund, World Population Dashboard, based on World Population Prospects 2024 revision
- StatisticsTimes.com, World Sex Ratio 2026, compiled from UN Population Division data
- World Bank, Population ages 15-64 (% of total population) and Population, female (% of total population), World Development Indicators
- Eurostat, Population structure and ageing, data extracted February 2026
- United Nations Statistics Division, Demographic Yearbook, historical age and sex ratio tables
- Our World in Data, Sex ratio by age, sourced from UN World Population Prospects 2024