
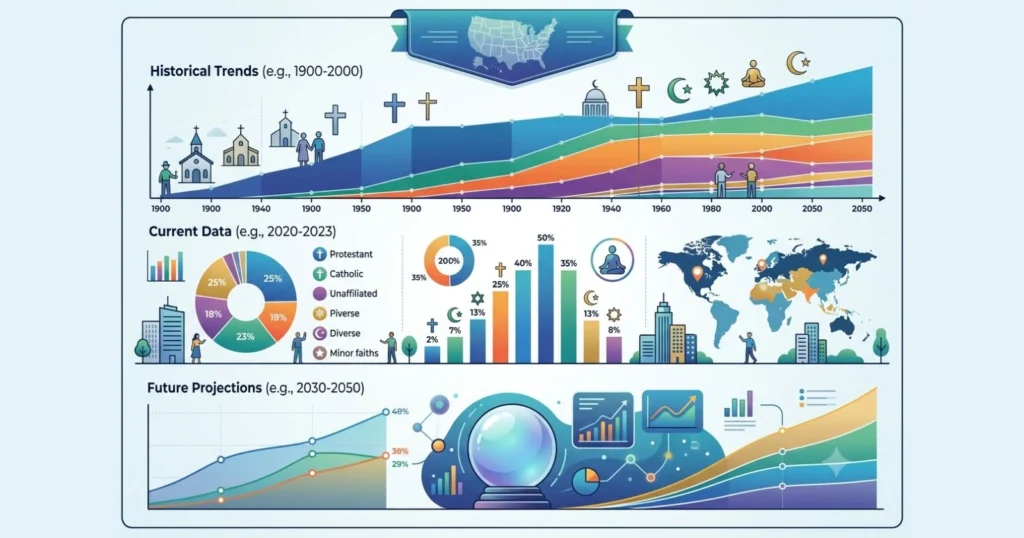
Religion has always played a defining role in shaping American identity, culture, and public life. Yet the religious composition of the United States has shifted dramatically over the past several decades. The country that was once overwhelmingly Christian is gradually becoming more religiously diverse, with a growing share of adults who claim no religious affiliation at all.
This article breaks down the USA population by religion across three time frames. It looks at long-term historical trends going back to 1990, the last ten years of measured data, and projections that stretch out to 2070. Along the way, it explains what is driving these shifts, which groups are growing, which are shrinking, and what the numbers suggest about the country’s religious future.
Why Religious Composition Data Matters
Religious affiliation data is not just a matter of academic curiosity. It informs public policy, marketing strategy, political forecasting, education planning, and healthcare delivery. Religious identity often intersects with voting behavior, family structure, fertility rates, and regional demographics. Understanding how the religious makeup of the country is changing helps researchers, journalists, businesses, and policymakers anticipate cultural and social shifts before they fully arrive.
The primary sources for this data are the Pew Research Center’s Religious Landscape Studies (conducted in 2007, 2014, and 2023 to 2024), Pew’s annual National Public Opinion Reference Survey, PRRI’s Census of American Religion, and Gallup’s long-running polling archive. These organizations use large, nationally representative samples, which makes their findings the most reliable benchmark available for tracking religious change in America.
Historical Trends in the USA Population by Religion
The religious landscape of the United States has undergone a slow but steady transformation since the early 1990s. In the early part of that decade, roughly 86 percent of American adults identified as Christian, according to Gallup and the American Religious Identification Survey. Religiously unaffiliated adults, often called religious “nones,” made up less than 10 percent of the population.
By the time Pew Research Center conducted its first Religious Landscape Study in 2007, the Christian share had already dropped to about 78 percent, while the unaffiliated share had climbed to 16 percent. This marked the beginning of an acceleration in religious disaffiliation that would define the next two decades.
Several forces have driven this long-term shift:
- Generational replacement, as older, more religious generations are gradually replaced by younger adults who are less likely to identify with any faith.
- Religious switching, particularly the movement of people raised Christian into the unaffiliated category during early adulthood.
- Declining religious transmission from parents to children compared to previous generations.
- Rising education levels, delayed marriage, and broader cultural secularization trends are common across many Western nations.
- Modest but steady growth in non-Christian faiths such as Islam, Hinduism, and Buddhism, driven partly by immigration.
Past Trends Table (1990 to 2020)
| Year | Christian (%) | Religiously Unaffiliated (%) | Non-Christian Faiths (%) | Source |
|---|---|---|---|---|
| 1990 | 86 | 8 | 6 | ARIS / Gallup |
| 2000 | 81 | 14 | 5 | ARIS |
| 2007 | 78 | 16 | 5 | Pew RLS 2007 |
| 2014 | 71 | 23 | 6 | Pew RLS 2014 |
| 2020 | 64 | 30 | 6 | Pew NPORS baseline |
Note: Figures for 1990 and 2000 include children and combine several survey sources, so they should be read as approximate historical benchmarks rather than exact point estimates. Figures from 2007 onward come directly from Pew Research Center adult surveys.
The table above shows the core long-term trend clearly. Christian affiliation fell by roughly 22 percentage points between 1990 and 2020, while the unaffiliated population grew nearly fourfold over the same period. Non-Christian religions grew only modestly in percentage terms, though their absolute numbers increased due to overall population growth and immigration.
The Last 10 Years of USA Religious Data (2015 to 2024)
The most recent decade tells a more nuanced story. While the long arc of American religious history points toward secularization, the pace of that change has slowed considerably since around 2019. Pew’s 2023 to 2024 Religious Landscape Study, based on more than 36,000 respondents, found that the Christian share of the population has been relatively stable, hovering between 60 and 64 percent for five consecutive years.
Last 10 Years Table (2015 to 2024)
| Year | Christian (%) | Unaffiliated (%) | Non-Christian Religions (%) | Notes |
|---|---|---|---|---|
| 2015 | 75 | 22 | 6 | Pew estimates, adults and children |
| 2017 | 70 | 25 | 6 | PRRI Census of American Religion |
| 2018 | 69 | 25 | 6 | PRRI |
| 2019 | 65 | 26 | 7 | Pew NPORS |
| 2020 | 64 | 30 | 6 | Pew NPORS baseline |
| 2021 | 63 | 29 | 6 | Pew NPORS |
| 2022 | 64 | 28 | 6 | PRRI Census |
| 2023 | 62 to 66 | 27 to 29 | 6 to 7 | Pew and PRRI combined |
| 2024 | 62 to 65 | 28 to 30 | 6 to 7 | Pew RLS and PRRI Census |
According to the 2023 to 2024 Religious Landscape Study, 62 percent of U.S. adults describe themselves as Christian. Within that group, 40 percent are Protestant, and 19 percent are Catholic, with roughly 3 percent belonging to other Christian traditions such as Orthodox Christianity, the Church of Jesus Christ of Latter-day Saints, and Jehovah’s Witnesses. Meanwhile, 29 percent of adults are religiously unaffiliated, made up of 5 percent atheists, 6 percent agnostics, and 19 percent who describe their religion as nothing in particular.
Non-Christian faiths together account for about 7 percent of U.S. adults. This includes 2 percent who identify as Jewish, and roughly 1 percent each who identify as Muslim, Buddhist, or Hindu. PRRI’s 2024 Census of American Religion, based on a sample of 40,000 adults, reported a similar picture, with 65 percent identifying as Christian and 28 percent unaffiliated, the highest level PRRI has recorded to date.
Key Findings from the Last Decade
- Evangelical Protestants now make up 23 percent of U.S. adults, down from 26 percent in 2007.
- Mainline Protestants account for 11 percent of adults, down sharply from 18 percent in 2007.
- Historically Black Protestant churches represent about 5 percent of adults, down from 7 percent in 2007.
- The Catholic share of the population has been remarkably stable, ranging between 18 and 21 percent since 2014.
- Members of the Church of Jesus Christ of Latter-day Saints have held steady at about 2 percent across all three Religious Landscape Studies.
- About 35 percent of U.S. adults report having switched religions since childhood, which has produced net losses for Christianity and net gains for the unaffiliated population.
- Younger adults remain far less religious than older generations. Roughly 38 percent of adults aged 18 to 29 identify as unaffiliated, compared with only about 18 percent of adults aged 65 and older.
Regional and Demographic Patterns
Religious affiliation in the United States is not evenly distributed. Protestant Christianity remains heavily concentrated in the South, while Catholics are spread more evenly across the Northeast, Midwest, South, and West. Women continue to report higher levels of religious affiliation than men, although the gap has narrowed since 2007. Immigrants, as a group, remain more religious than the U.S.-born population, with about 58 percent of foreign-born adults identifying as Christian and roughly a quarter reporting no religious affiliation.
Future Projections for the USA Population by Religion
Predicting religious change decades into the future requires making assumptions about fertility, migration, mortality, and religious switching patterns, all of which can shift in unexpected ways. The Pew Research Center has produced two major projection efforts relevant to the United States. The first, published in 2015, modeled global religious change through 2050. The second, published in 2022, modeled several detailed scenarios for the United States through 2070.
Under Pew’s original 2015 projections, the Christian share of the U.S. population was expected to decline from about 78 percent in 2010 to roughly two-thirds by 2050, while the unaffiliated share was projected to rise from 16 percent to 26 percent over the same period. Notably, actual data from 2020 already resembled what had been projected for 2050, suggesting that religious disaffiliation happened faster than originally modeled.
Pew’s 2022 report modeled four main scenarios for 2070, based on different assumptions about how quickly religious switching might continue among young adults.
- In the most conservative scenario, where disaffiliation does not accelerate beyond current rates, Christians would still make up about 54 percent of the population in 2070, with the unaffiliated at around 34 percent.
- In a moderate scenario, where switching accelerates somewhat, Christians would fall to about 46 percent and the unaffiliated would rise to about 41 percent.
- In a faster secularization scenario, Christians could fall to roughly 35 percent, while the unaffiliated could become the largest group at around 48 percent by 2070.
- In an implausible scenario where all religious switching stopped entirely after 2020, Christians would still decline to about 59 percent by 2070 due to the natural effects of aging and generational replacement alone.
Pew researchers are careful to note that none of these are firm predictions. They are illustrations of what could happen under different sets of assumptions. Still, every single scenario modeled points in the same direction: continued relative decline in the Christian share of the population and continued growth in the unaffiliated share, at least through the middle of this century.
Future Projected Table (2030 to 2070)
| Year | Christian (%) | Unaffiliated (%) | Non-Christian Faiths (%) | Scenario Basis |
|---|---|---|---|---|
| 2030 | 58 to 60 | 32 to 34 | 7 to 8 | Trend extrapolation |
| 2040 | 53 to 56 | 35 to 38 | 8 | Pew moderate scenario |
| 2050 | 46 to 54 | 34 to 41 | 8 to 9 | Pew scenarios 1 and 2 |
| 2060 | 40 to 50 | 38 to 45 | 9 | Pew scenarios 2 and 3 |
| 2070 | 35 to 54 | 34 to 48 | 9 to 10 | Pew scenarios 1 through 3 |
Because so much depends on the pace of religious switching among young adults, the range of outcomes widens considerably the further out the projection extends. The most important variable is how religious teenagers and young adults remain as they move through their twenties, since this is the age range in which most disaffiliation from Christianity has historically occurred.
Combined Table: USA Population by Religion, 1990 to 2070
| Year | Christian (%) | Unaffiliated (%) | Non-Christian Faiths (%) | Data Type |
|---|---|---|---|---|
| 1990 | 86 | 8 | 6 | Historical |
| 2000 | 81 | 14 | 5 | Historical |
| 2007 | 78 | 16 | 5 | Historical |
| 2014 | 71 | 23 | 6 | Historical |
| 2019 | 65 | 26 | 7 | Recent |
| 2020 | 64 | 30 | 6 | Recent |
| 2022 | 64 | 28 | 6 | Recent |
| 2024 | 62 to 65 | 28 to 30 | 6 to 7 | Current |
| 2030 | 58 to 60 | 32 to 34 | 7 to 8 | Projected |
| 2050 | 46 to 54 | 34 to 41 | 8 to 9 | Projected |
| 2070 | 35 to 54 | 34 to 48 | 9 to 10 | Projected |
This combined view makes the overall trajectory easy to see. Christian affiliation has fallen by roughly 24 percentage points since 1990 and could fall by another 10 to 30 points by 2070, depending on how quickly younger generations continue to disaffiliate. The unaffiliated population, meanwhile, has grown from a small minority into a group that could rival or even surpass Christians as the largest religious category in the country within the next several decades.
Breakdown of Major Religious Groups in the USA Today
To understand the current religious landscape in more depth, it helps to look beyond the broad Christian versus unaffiliated framing and examine individual religious traditions.
| Religious Group | Share of U.S. Adults (2023 to 2024) |
|---|---|
| Evangelical Protestant | 23% |
| Catholic | 19% |
| Mainline Protestant | 11% |
| Nothing in particular | 19% |
| Agnostic | 6% |
| Atheist | 5% |
| Historically Black Protestant | 5% |
| Other Christian | 3% |
| Jewish | 2% |
| Muslim | 1% |
| Buddhist | 1% |
| Hindu | 1% |
Figures are rounded and drawn from the 2023 to 2024 Pew Religious Landscape Study. Categories may not sum exactly to 100 percent due to rounding.
What Is Driving the Shift Toward Religious Unaffiliation
Several interconnected factors explain why the unaffiliated population has grown so consistently over the past three decades.
- Generational turnover. Each successive generation of Americans has entered adulthood less religious than the one before it, and this pattern has held steady across every Religious Landscape Study conducted since 2007.
- Delayed and reduced religious transmission. Parents today are less likely than earlier generations to raise their children within an organized faith tradition.
- Increased educational attainment. Higher levels of formal education have historically correlated with lower rates of religious affiliation in the United States.
- Political and cultural associations. Some researchers point to the increasing association between organized religion and conservative politics as a factor that has pushed some younger and more politically moderate or liberal Americans away from religious identification.
- The rise of the internet and social media. Greater exposure to diverse worldviews and reduced reliance on local community institutions, including churches, has coincided with the growth of the unaffiliated population, though this remains an area of ongoing research rather than a settled consensus.
Conclusion
The religious composition of the United States has changed more in the past three decades than in the previous century. What was once a country defined by near-universal Christian identification has become a more religiously plural society, with nearly three in ten adults claiming no religious affiliation at all.
The last several years suggest this shift may be stabilizing in the short term, even as long-range projections continue to point toward a more secular future. Whether that trajectory continues, slows further, or reverses will depend largely on how the youngest generations of Americans relate to faith as they move through adulthood in the decades ahead.
Frequently Asked Questions
What percentage of the U.S. population is Christian today?
As of the 2023 to 2024 Pew Religious Landscape Study, 62 percent of U.S. adults identify as Christian. PRRI’s 2024 Census of American Religion put the figure slightly higher, at 65 percent.
What percentage of Americans have no religion?
About 28 to 29 percent of U.S. adults currently identify as religiously unaffiliated, a category that includes atheists, agnostics, and those who describe their religion as nothing in particular.
Is the decline of Christianity in America slowing down?
Yes. After decades of steady decline, the Christian share of the population has remained relatively stable, between 60 and 64 percent, since around 2019, according to Pew Research Center.
Which religious groups are growing the fastest in the United States?
In percentage terms, the religiously unaffiliated have grown the fastest since 1990. Among religious groups, nondenominational Protestant Christianity and several non-Christian faiths, including Islam and Hinduism, have shown consistent growth, driven partly by immigration.
Will Christians remain the majority religion in the United States?
Under most projection scenarios modeled by the Pew Research Center, Christians are expected to remain the single largest religious group through at least 2050. Whether they retain a numerical majority by 2070 depends heavily on how quickly religious switching continues among young adults.
What is the difference between Pew’s Religious Landscape Study and PRRI’s Census of American Religion?
Both are large, high-quality surveys of religious affiliation in the United States, but they use different sampling methods and question wording, which accounts for small differences in their published figures. Pew’s Religious Landscape Study is conducted roughly once every seven years, while PRRI’s Census of American Religion is conducted annually.





