
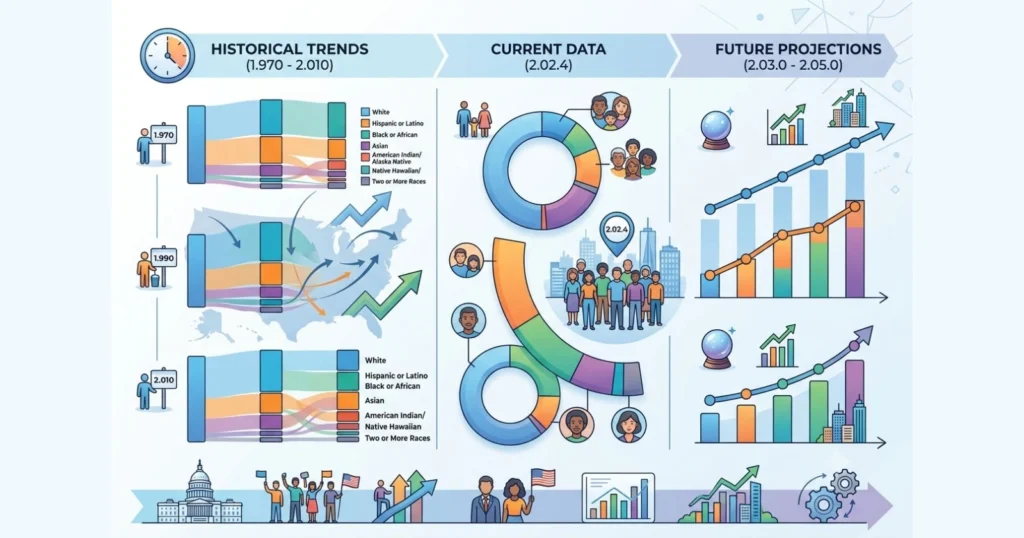
The ethnic and racial composition of the United States has changed more in the last 45 years than in the previous century combined. What began as a country where non-Hispanic White residents made up roughly four out of every five people has become one of the most demographically diverse nations on earth, and the pace of change is not slowing down.
This article breaks down the story into four parts. First, a look at the past trends from 1980 through 2020. Second, a detailed year-by-year table covering the last 10 years. Third, a projected table showing where the country is headed through 2060. Fourth, a combined table that lets you see the entire arc, from the past through the present and into the future, in one place. Along the way, we explain what is driving these shifts and what they mean for the country’s future.
All figures are drawn from and rounded based on U.S. Census Bureau sources, including the Decennial Census, the Population Estimates Program (PEP), the American Community Survey (ACS), and the Census Bureau’s 2023 National Population Projections. Because the Census Bureau has changed its race and ethnicity methodology several times, particularly between the 2010 and 2020 Censuses, figures across different vintages are not perfectly comparable, and this is noted where relevant.
How the Census Bureau Defines Race and Ethnicity
Before diving into the numbers, it helps to understand the framework:
- Race categories include White, Black or African American, American Indian and Alaska Native (AIAN), Asian, and Native Hawaiian and Other Pacific Islander (NHPI), along with a Two or More Races category for people who select multiple groups.
- Ethnicity is a separate question with only two categories: Hispanic or Latino and Not Hispanic or Latino. A person of Hispanic origin can be of any race.
- Because of this, tables often show both “alone” figures (a single race regardless of Hispanic origin) and “non-Hispanic” figures (a race group excluding people who also identify as Hispanic).
- The 2020 Census changed how write-in responses were coded, which caused a large jump in the Two or More Races and Some Other Race categories that is partly a methodology effect rather than a pure population shift.
Past Trends: USA Population by Ethnicity, 1980 to 2020
| Year | Total Population | White Alone | White Non-Hispanic | Black Alone | Hispanic or Latino | Asian Alone | AIAN Alone | Two or More Races |
|---|---|---|---|---|---|---|---|---|
| 1980 | 226.5 million | 83.1% | 79.6% | 11.7% | 6.4% | 1.5% | 0.6% | Not measured |
| 1990 | 248.7 million | 80.3% | 75.6% | 11.8% | 9.0% | 2.8% | 0.8% | Not measured |
| 2000 | 281.4 million | 75.1% | 69.1% | 12.3% | 12.5% | 3.6% | 0.9% | 2.4% |
| 2010 | 308.7 million | 72.4% | 63.7% | 12.6% | 16.3% | 4.8% | 0.9% | 2.9% |
| 2020 | 331.4 million | 61.6% | 57.8% | 12.4% | 18.7% | 6.0% | 1.1% | 10.2% |
The table shows the long arc of change across four decennial census counts. Figures are for race alone (or the closest historical equivalent) and Hispanic origin as a percent of the total population.
Key takeaways from this table:
- The non-Hispanic White share of the population fell by more than 21 percentage points between 1980 and 2020, from nearly 80 percent to under 58 percent.
- The Hispanic population nearly tripled its share of the total population, rising from 6.4 percent in 1980 to 18.7 percent in 2020.
- The Black population’s share stayed relatively steady, moving only slightly, from around 11.7 percent to 12.4 percent, even as its absolute numbers grew significantly.
- The Asian population’s share quadrupled over four decades, reflecting sustained immigration from Asia since the 1965 Immigration and Nationality Act.
- The large jump in Two or More Races between 2010 and 2020 is partly a real increase in multiracial identification and partly a result of Census Bureau coding changes.
USA Population by Ethnicity, 2016 to 2025
| Year | Total Population | White Non-Hispanic | Hispanic or Latino | Black Alone | Asian Alone | AIAN Alone | Two or More Races |
|---|---|---|---|---|---|---|---|
| 2016 | 323.1 million | 61.3% | 17.8% | 12.7% | 5.7% | 0.9% | 2.6% |
| 2017 | 325.1 million | 60.9% | 18.1% | 12.7% | 5.8% | 0.9% | 2.7% |
| 2018 | 326.8 million | 60.4% | 18.3% | 12.7% | 5.9% | 0.9% | 2.8% |
| 2019 | 328.2 million | 60.1% | 18.5% | 12.8% | 5.9% | 0.9% | 2.9% |
| 2020 | 331.4 million | 57.8% | 18.7% | 12.4% | 6.0% | 1.1% | 10.2% |
| 2021 | 331.9 million | 58.4% | 18.9% | 12.6% | 6.1% | 1.3% | 3.6% |
| 2022 | 333.3 million | 58.9% | 19.1% | 12.6% | 6.3% | 1.4% | 4.0% |
| 2023 | 334.9 million | 57.7% | 19.5% | 13.0% | 6.4% | 1.6% | 4.3% |
| 2024 | 340.1 million | 56.3% | 20.0% | 13.3% | 6.7% | 1.8% | 4.6% |
| 2025 | 341.8 million | 56.1% | 20.5% | 13.5% | 6.9% | 2.1% | 4.9% |
This table presents annual estimates for the last decade, based on Census Bureau Population Estimates Program vintages and American Community Survey data. Figures are rounded and represent race alone or Hispanic origin as a share of the total resident population.
Note: The 2020 figures reflect the 2020 Decennial Census count, while the surrounding years reflect Population Estimates Program vintages, which use a somewhat different methodology. This explains the visible jump in the Two or More Races line for 2020 specifically.
What stands out over this 10-year window:
- The White non-Hispanic share fell from about 61.3 percent in 2016 to 56.1 percent in 2025, a decline of more than five percentage points in less than a decade.
- The Hispanic population added nearly three percentage points of national population share, and by 2025, stood at just over one in five Americans.
- The Asian alone population grew from 5.7 percent to 6.9 percent, continuing to be one of the fastest growing groups by percentage.
- The American Indian and Alaska Native alone population more than doubled its recorded share, from 0.9 percent to 2.1 percent, driven largely by growth in multiracial self-identification among people with partial Indigenous ancestry.
- Population growth over this period slowed sharply around 2020 and 2021 due to the COVID-19 pandemic, then picked back up through natural increase and net international migration by 2023 and 2024.
Current Snapshot: The United States in 2025 and 2026
As of the most recent Census Bureau Population Estimates Program release (Vintage 2025, reflecting population as of July 1, 2025), the total U.S. population stood at 341,784,857. The current racial and ethnic breakdown is as follows:
- White alone: 72.3 percent of the population
- White alone, not Hispanic or Latino: 56.1 percent
- Hispanic or Latino, of any race: 20.5 percent
- Black or African American alone: 13.5 percent
- Asian alone: 6.9 percent
- Two or More Races: 4.9 percent
- American Indian and Alaska Native alone: 2.1 percent
- Native Hawaiian and Other Pacific Islander alone: 0.3 percent
A few points help put this snapshot in context:
- The gap between White alone (72.3 percent) and White non-Hispanic (56.1 percent) exists because a meaningful share of Hispanic Americans also identify racially as White. This is one of the most common sources of confusion when people compare ethnicity statistics across different sources.
- Population growth between 2024 and 2025 slowed to about 0.5 percent, down from 0.98 percent the prior year, largely due to a decline in net international migration.
- Foreign-born residents made up about 14.1 percent of the total population as of the most recent five-year American Community Survey estimate, continuing a long-term upward trend from just 5 percent in the mid 1960s.
- Racial and ethnic diversity is not evenly distributed. States such as California, Texas, New Mexico, Nevada, Hawaii, and Maryland already have no single racial or ethnic majority group, while several Northeastern and Midwestern states remain over 85 percent White non-Hispanic.
Future Projections: USA Population by Ethnicity, 2030 to 2060
| Year | Total Population (Projected) | White Non-Hispanic | Hispanic or Latino | Black Non-Hispanic | Asian Non-Hispanic | Two or More Races / Other |
|---|---|---|---|---|---|---|
| 2030 | 347 million | 55% | 21% | 13% | 7% | 4% |
| 2040 | 355 million | 51% | 23% | 13% | 8% | 5% |
| 2050 | 360 million | 47% | 25% | 14% | 9% | 5% |
| 2060 | 364 million | 45% | 27% | 14% | 9% | 5% |
The Census Bureau publishes long-range population projections that model future births, deaths, and migration under several scenarios. The figures below reflect the main series (the Bureau’s most likely outcome scenario) from its 2023 National Population Projections release, rounded for readability.
Highlights from the projected future:
- The United States is projected to become a plurality nation rather than a majority White nation sometime around 2045, meaning the non-Hispanic White population will remain the single largest group, but no group will hold an outright majority.
- The Hispanic population is projected to grow from about 19 percent today to nearly 27 percent by 2060, making it close to one in every four Americans.
- The Asian population’s share is expected to keep climbing, roughly reaching 9 to 10 percent by 2060, making it the fastest-growing group by percentage over the projection period.
- The non-Hispanic Black population’s share is projected to stay comparatively stable, in the 13 to 15 percent range, through 2060.
- Under the Bureau’s main series, all future population growth after roughly 2040 is expected to come from immigration, since deaths are projected to outnumber births among the existing native born population.
- Younger age groups are already far more diverse than older ones. By 2060, roughly two-thirds of American children are projected to belong to a racial or ethnic minority group, compared with about half today.
- These projections carry real uncertainty. The Census Bureau’s alternative high and low immigration scenarios diverge substantially by 2060, with total population estimates ranging from under 300 million under a zero immigration scenario to well over 400 million under continued high immigration.
Past, Current, and Future Population of the USA by Ethnicity
| Year | Total Population | White Non-Hispanic | Hispanic or Latino | Black (Alone/NH) | Asian (Alone/NH) | AIAN Alone | Two or More Races / Other |
|---|---|---|---|---|---|---|---|
| 1980 | 226.5 million | 79.6% | 6.4% | 11.7% | 1.5% | 0.6% | Not measured |
| 1990 | 248.7 million | 75.6% | 9.0% | 11.8% | 2.8% | 0.8% | Not measured |
| 2000 | 281.4 million | 69.1% | 12.5% | 12.3% | 3.6% | 0.9% | 2.4% |
| 2010 | 308.7 million | 63.7% | 16.3% | 12.6% | 4.8% | 0.9% | 2.9% |
| 2020 | 331.4 million | 57.8% | 18.7% | 12.4% | 6.0% | 1.1% | 10.2% |
| 2025 (Current) | 341.8 million | 56.1% | 20.5% | 13.5% | 6.9% | 2.1% | 4.9% |
| 2030 (Projected) | 347 million | 55% | 21% | 13% | 7% | 4% (combined) | included above |
| 2040 (Projected) | 355 million | 51% | 23% | 13% | 8% | 5% (combined) | included above |
| 2050 (Projected) | 360 million | 47% | 25% | 14% | 9% | 5% (combined) | included above |
| 2060 (Projected) | 364 million | 45% | 27% | 14% | 9% | 5% (combined) | included above |
This single table lets you compare the sweep of change across nearly 80 years, from 1980 through the projected 2060 figures.
Reading this table from left to right tells the whole story of American demographic change at a glance. The country has moved, and is continuing to move, from a population overwhelmingly composed of one group toward one where several groups each hold a substantial and growing share, with no single group commanding a majority within the coming decades.
What Is Driving These Shifts
A few forces explain most of the movement seen in the tables above.
- Immigration patterns. Since the Immigration and Nationality Act of 1965 removed national origin quotas, immigration to the United States has shifted heavily toward Latin America and Asia, fueling growth in the Hispanic and Asian populations.
- Differences in age structure. The non-Hispanic White population is considerably older on average than other groups, which means more deaths relative to births each year, a pattern demographers call natural decrease.
- Fertility rate differences. Birth rates have historically been higher among Hispanic and, to a lesser extent, Black populations than among non-Hispanic White populations, although these gaps have narrowed substantially in recent years across nearly all groups.
- Rising multiracial identification. More Americans are identifying with two or more races than in past decades, both due to rising numbers of interracial families and due to changes in how the Census Bureau codes responses.
- Regional migration patterns. Growth in diversity is concentrated in the South and West, while parts of the Northeast and Midwest have seen comparatively modest change.
Conclusion
The story told by these tables is one of steady, accelerating diversification. From a country that was over three-quarters non-Hispanic White in 1980, the United States has moved to a present-day population where that same group makes up just over half of all residents, and Census Bureau projections suggest that share will keep falling through the middle of this century.
Meanwhile, the Hispanic and Asian populations are set to keep growing both in absolute numbers and as a share of the total, while the Black population’s share is expected to remain relatively stable, and the multiracial population continues to expand. Understanding these shifts matters for everything from business planning and public policy to healthcare delivery and education, since the country’s future population will look meaningfully different from its present one.
Frequently Asked Questions
What is the current percentage of White people in the United States?
As of the 2025 Census Bureau estimate, White alone individuals make up about 72.3 percent of the population, while White alone, non-Hispanic individuals make up about 56.1 percent.
Is the Hispanic population the fastest-growing group in the United States?
The Hispanic population has contributed the largest single share of total population growth in recent years, though the Asian population has often grown at a faster percentage rate.
When will the United States become a majority-minority nation?
Under the Census Bureau’s main series projections, the country is expected to become a plurality nation, where non-Hispanic White residents remain the largest single group, but no group holds a majority, sometime in the mid 2040s.
Why do White alone and White non-Hispanic numbers look so different?
Because Hispanic origin is a separate ethnicity question from race, a significant share of Hispanic Americans also identify racially as White, which creates a gap between the two figures.
Are the Census Bureau’s future projections guaranteed to be accurate?
No. Projections depend heavily on assumptions about future immigration, birth rates, and mortality, and the Census Bureau publishes multiple scenarios precisely because outcomes can shift meaningfully depending on policy and demographic trends.





