
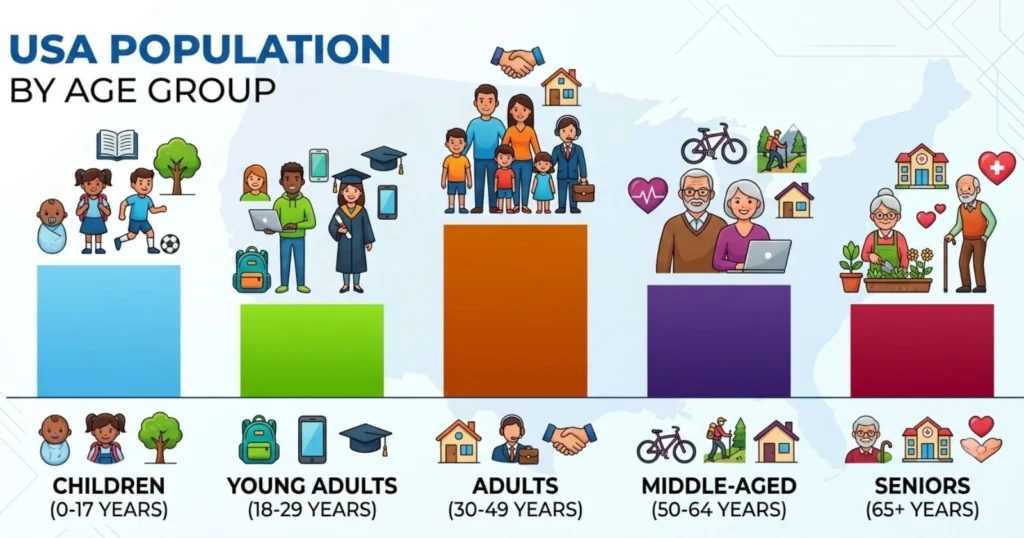
The United States is undergoing one of the most significant demographic shifts in its history. The population is getting older, birth rates are falling, and the balance between children, working-age adults, and seniors is changing in ways that affect the economy, health care, housing, and public policy. Understanding the USA population by age group is essential for planners, businesses, researchers, and policymakers who need to prepare for a country that looks very different today than it did in 1980, and will look different again by 2060.
This article breaks down the data into four parts. It reviews long-term historical trends, presents the last ten years of Census Bureau estimates, outlines official projections through 2060, and closes with a single combined table that shows the full arc of change from the past through the present and into the future. All figures are rounded and sourced from the U.S. Census Bureau, including the Population Estimates Program and the 2023 National Population Projections.
Why Age Structure Matters for the United States
Age distribution is not just a statistic. It shapes national priorities in direct and measurable ways.
- Workforce supply: A shrinking share of working-age adults relative to retirees affects labor availability and economic output.
- Social Security and Medicare: These programs depend on a favorable ratio of workers to beneficiaries. As the senior share grows, that ratio narrows.
- Health care demand: Older populations require more chronic disease management, long-term care, and specialized medical services.
- Housing and consumer markets: Household formation, school enrollment, and demand for retirement housing all shift with age structure.
- State and local planning: Schools, infrastructure, and public services are budgeted around expected population by age.
Track Real-time United States Population Growth @ USA POPULATION CLOCK
Historical Trends in US Population by Age Group (1980 to 2020)
Between 1980 and 2020, the United States added more than 100 million residents. During this period, the country moved from a relatively young population, shaped by the Baby Boom generation entering adulthood, to an aging one, as that same generation approached retirement.
Past Trends in US Population by Age Group (1980 to 2020)
| Year | Total Population (millions) | Under 18 | 18 to 44 | 45 to 64 | 65 and Older |
|---|---|---|---|---|---|
| 1980 | 226.5 | 63.7 (28.1%) | 88.9 (39.2%) | 44.5 (19.6%) | 25.5 (11.3%) |
| 1990 | 248.7 | 63.6 (25.6%) | 107.7 (43.3%) | 46.4 (18.7%) | 31.2 (12.5%) |
| 2000 | 281.4 | 72.3 (25.7%) | 112.2 (39.9%) | 61.9 (22.0%) | 35.0 (12.4%) |
| 2010 | 308.7 | 74.2 (24.0%) | 112.8 (36.5%) | 81.5 (26.4%) | 40.3 (13.0%) |
| 2020 | 331.4 | 74.6 (22.5%) | 120.0 (36.2%) | 82.9 (25.0%) | 54.0 (16.3%) |
Source: U.S. Census Bureau, Decennial Census and Population Estimates Program. Figures are rounded to the nearest tenth of a million.
A few patterns stand out over these four decades:
- The under 18 share of the population fell steadily, from 28.1 percent in 1980 to 22.5 percent in 2020, even though the total number of children rose slightly in absolute terms through most of the period.
- The 45 to 64 age group expanded significantly as the large Baby Boom cohort aged through midlife, rising from 19.6 percent of the population in 1980 to 26.4 percent in 2010.
- The 65 and older population nearly doubled in raw numbers, climbing from 25.5 million in 1980 to 54.0 million in 2020, as life expectancy improved and the Boomer generation began reaching retirement age after 2011.
- The 18 to 44 group, which includes most of the prime working age population, held a fairly stable share through the 1990s and 2000s before easing slightly by 2020.
US Population by Age Group: The Last 10 Years (2015 to 2024)
The most recent decade tells a more detailed story of accelerating change. Fertility rates have declined, net international migration has fluctuated, and the Baby Boom generation has moved firmly into retirement age. The result is the fastest sustained aging of the American population on record.
US Population by Age Group, Last 10 Years (2015 to 2024)
| Year | Total Population (millions) | Under 18 | 18 to 44 | 45 to 64 | 65 and Older |
|---|---|---|---|---|---|
| 2015 | 320.9 | 74.8 (23.3%) | 114.2 (35.6%) | 85.0 (26.5%) | 46.9 (14.6%) |
| 2016 | 323.1 | 74.6 (23.1%) | 116.0 (35.9%) | 84.7 (26.2%) | 47.8 (14.8%) |
| 2017 | 325.1 | 74.4 (22.9%) | 117.4 (36.1%) | 84.2 (25.9%) | 49.1 (15.1%) |
| 2018 | 326.8 | 74.2 (22.7%) | 118.6 (36.3%) | 83.7 (25.6%) | 50.3 (15.4%) |
| 2019 | 328.2 | 74.2 (22.6%) | 119.1 (36.3%) | 83.0 (25.3%) | 51.9 (15.8%) |
| 2020 | 331.4 | 74.6 (22.5%) | 120.0 (36.2%) | 82.9 (25.0%) | 54.0 (16.3%) |
| 2021 | 332.0 | 74.0 (22.3%) | 120.2 (36.2%) | 82.0 (24.7%) | 55.8 (16.8%) |
| 2022 | 333.3 | 73.3 (22.0%) | 121.3 (36.4%) | 81.3 (24.4%) | 57.3 (17.2%) |
| 2023 | 336.8 | 73.1 (21.7%) | 123.6 (36.7%) | 81.2 (24.1%) | 58.9 (17.5%) |
| 2024 | 340.1 | 73.1 (21.5%) | 124.8 (36.7%) | 81.0 (23.8%) | 61.2 (18.0%) |
Source: U.S. Census Bureau, Vintage 2024 Population Estimates. Figures for years between decennial benchmarks are annual estimates and are subject to periodic revision.
Key developments from this ten-year window:
- The 65 and older population grew from 46.9 million in 2015 to 61.2 million in 2024, an increase of roughly 30 percent in under a decade.
- The under-18 population declined in absolute numbers even as the total population grew, a reversal of the historical norm.
- The national median age crossed 39 for the first time in 2024, a record high.
- Older adults now outnumber children in eleven states, up from just three states in 2020, a shift concentrated in lower growth and rural areas.
- The gap between the number of children and the number of seniors narrowed from about 20 million in 2020 to under 12 million in 2024.
Future Projections: US Population by Age Group Through 2060
Looking ahead, the U.S. Census Bureau’s 2023 National Population Projections describe a country where population growth continues but slows considerably, driven increasingly by immigration rather than natural increase, since deaths are expected to outnumber births at the national level within the next two decades.
Projected US Population by Age Group (2030 to 2060)
| Year | Total Population (millions) | Under 18 | 18 to 44 | 45 to 64 | 65 and Older |
|---|---|---|---|---|---|
| 2030 | 352.0 | 76.0 (21.6%) | 116.0 (33.0%) | 89.0 (25.3%) | 71.0 (20.2%) |
| 2040 | 362.0 | 77.0 (21.3%) | 118.0 (32.6%) | 89.0 (24.6%) | 78.0 (21.5%) |
| 2050 | 367.0 | 78.0 (21.3%) | 121.0 (33.0%) | 86.0 (23.4%) | 82.0 (22.3%) |
| 2060 | 369.0 | 79.0 (21.4%) | 122.0 (33.1%) | 84.0 (22.8%) | 84.0 (22.8%) |
Source: U.S. Census Bureau, 2023 National Population Projections, main series. Figures are rounded projections and may vary from alternative migration scenarios.
The projections point to several structural shifts:
- The 65 and older share of the population is projected to surpass the under 18 share around 2029, a demographic crossover that has never before occurred in U.S. history.
- By 2030, an estimated 71 million Americans, roughly one in five, will be 65 or older.
- By 2040, the senior population is expected to reach approximately 78 million, about 22 percent of all residents.
- By 2050, the number of Americans 65 and older is projected to reach 82 million, a 42 percent increase from 2022 levels.
- The 85 and older population is projected to more than double between 2022 and 2040, placing added pressure on long-term care systems.
- Total population growth is expected to slow from roughly half a percent per year in the early 2020s to a fraction of that by the late 2030s, as natural increase approaches zero.
Combined View: US Population by Age Group, 1980 to 2060
The table below places the full timeline side by side, from the earliest historical data through the most current estimates and into the projected future. It offers a single reference point for tracking how the American age structure has evolved and where it is headed.
US Population by Age Group, Combined Historical and Projected View (1980 to 2060)
| Year | Total Population (millions) | Under 18 (%) | 18 to 44 (%) | 45 to 64 (%) | 65 and Older (%) |
|---|---|---|---|---|---|
| 1980 | 226.5 | 28.1% | 39.2% | 19.6% | 11.3% |
| 1990 | 248.7 | 25.6% | 43.3% | 18.7% | 12.5% |
| 2000 | 281.4 | 25.7% | 39.9% | 22.0% | 12.4% |
| 2010 | 308.7 | 24.0% | 36.5% | 26.4% | 13.0% |
| 2020 | 331.4 | 22.5% | 36.2% | 25.0% | 16.3% |
| 2024 (Current) | 340.1 | 21.5% | 36.7% | 23.8% | 18.0% |
| 2030 (Projected) | 352.0 | 21.6% | 33.0% | 25.3% | 20.2% |
| 2040 (Projected) | 362.0 | 21.3% | 32.6% | 24.6% | 21.5% |
| 2050 (Projected) | 367.0 | 21.3% | 33.0% | 23.4% | 22.3% |
| 2060 (Projected) | 369.0 | 21.4% | 33.1% | 22.8% | 22.8% |
Source: U.S. Census Bureau, Decennial Census, Population Estimates Program, and 2023 National Population Projections.
This combined view makes the long arc clear. The under-18 share has fallen by roughly seven percentage points since 1980 and is expected to stabilize around 21 percent through midcentury. The 65 and older share, by contrast, has moved from just above 11 percent to a projected 22.8 percent by 2060, a shift of more than double, marking the most significant transformation in the American age structure in over a century.
Key Age Group Definitions
For consistency across the Census Bureau and demographic reporting, the age brackets referenced in this article are defined as follows:
- Under 18: Children and dependents, generally not part of the labor force.
- 18 to 44: Young adults and early to mid-career workers, the group most associated with new household formation and childbearing.
- 45 to 64: Established working age adults, typically at peak earning years and approaching retirement.
- 65 and older: Seniors, the population eligible for Medicare and most Social Security retirement benefits.
Regional Variation Within the National Trend
While the national figures describe the overall pattern, aging is not distributed evenly across the country.
- States such as Maine, Florida, Vermont, and West Virginia already have among the highest shares of residents 65 and older, in several cases approaching or exceeding 22 percent.
- Rural counties and small towns are aging faster than large metro areas, partly because younger residents tend to migrate toward metro regions for employment.
- The South and West are expected to continue gaining population share relative to the Northeast and Midwest through 2050, though this shift is driven more by migration than by age structure alone.
- Nearly half of all U.S. counties now have more older adults than children, compared to less than a third just four years earlier.
What the Age Shift Means for the Economy and Policy
The changing shape of the U.S. population by age group carries direct consequences across several sectors.
- Retirement systems: A shrinking base of working-age contributors relative to retirees increases pressure on Social Security financing and pushes more households toward personal retirement savings and workplace retirement plans.
- Labor force participation: Since older adults participate in the labor force at lower rates than younger adults, an aging population tends to reduce the overall labor force participation rate, even if participation within each age bracket holds steady or rises slightly.
- Health care systems: Demand for services related to chronic disease management, home health care, and memory care is projected to rise sharply, with Alzheimer’s disease cases potentially more than doubling by 2050.
- Federal spending: Combined Social Security and Medicare spending is projected to rise as a share of gross domestic product through the mid 2030s, reflecting the growing senior population.
- Housing markets: Demand is expected to grow for age-restricted housing, accessible design, and smaller households, while demand tied to school-age children may grow more slowly in many regions.
Final Thoughts
The USA population by age group has shifted from a relatively young, expanding profile in 1980 to an aging, slower-growing one heading into the 2060s. Children now make up a smaller share of the population than at any point in modern U.S. history, while the senior population is on track to represent close to a quarter of all residents by midcentury.
These shifts carry meaningful implications for the workforce, health care systems, retirement programs, and regional planning, and they are expected to remain a defining feature of American demographics for decades to come.
Recommended Articles: USA Population & Governance Policies
- USA’s Changing Religious Landscape: Christians, Atheists and Other Faiths
- USA Population Growth Rate: The Demographic Shift Reshaping America’s Future
- USA Population by Race: Historical Trends, Current Data, and Future Projections
- USA vs China Population: The Demographic Battle Shaping the 21st Century
- US Population by Ethnicity: 1980 to 2060 Trends and Projections
- US Population Density by State: The Most and Least Crowded Areas
- US Life Expectancy by Year: A Century of Change and What the Future Holds
- US Male and Female Population by Year: Historical Data and 2060 Forecast
Frequently Asked Questions
What percentage of the US population is under 18?
As of 2024, approximately 21.5 percent of the U.S. population, or about 73.1 million people, is under the age of 18, according to U.S. Census Bureau estimates.
What percentage of the US population is 65 and older?
In 2024, about 18.0 percent of the U.S. population, or roughly 61.2 million people, was 65 or older. This share has risen steadily from 12.4 percent in 2004.
When will older adults outnumber children nationally in the United States?
Census Bureau projections indicate that the 65 and older population is expected to surpass the under-18 population at the national level around 2029, under the main projection series.
What will the US population by age group look like in 2050?
By 2050, the Census Bureau projects the population 65 and older will reach approximately 82 million, about 22.3 percent of the total population, while the under-18 share is expected to hold near 21.3 percent.
Which age group is growing the fastest?
The 65 and older group, and particularly the 85 and older population, is currently the fastest growing segment of the U.S. population, driven by the aging of the Baby Boom generation and continued gains in life expectancy.
Recommended Articles: US Population by Years





