
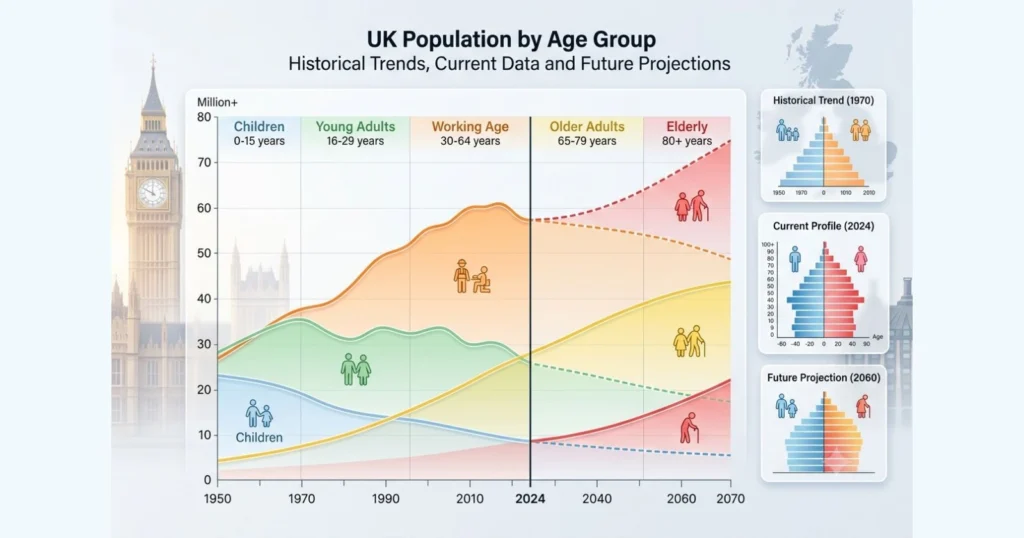
The United Kingdom is home to an estimated 69.3 million people as of mid-2024, and the shape of that population has changed dramatically over the past seventy years. Where the UK once had a relatively young, broad-based population structure, it now has one of the older age profiles in its history, with the number of people aged 65 and over rising faster than any other age group. At the same time, the number of children remains far below its postwar peak, and the working-age population is growing only slowly.
Understanding how the UK population is split by age group matters for planning schools, housing, pensions, the National Health Service, and the wider economy. This article walks through the historical record, the last ten years of change, the current 2024 age structure, and the official projections through to 2049, using data from the Office for National Statistics (ONS).
Why Age Structure Matters
The balance between children, working-age adults, and older residents shapes nearly every area of public policy and private planning.
- A growing number of children signals future demand for schools, childcare, and family housing.
- A shrinking or slow-growing working-age population affects tax revenue, labor supply, and economic growth.
- An aging population increases demand for healthcare, social care, and pension spending.
The UK has moved firmly into the third phase of this pattern. The country is ageing, and the pace of that ageing is one of the defining demographic stories of the twenty-first century.
Historical Trends in UK Population by Age Group
The UK population has grown steadily since the Second World War, but its age composition has shifted even more noticeably. In 1951, the population of England and Wales stood at roughly 43.8 million, with a comparatively young population structure and an old-age dependency ratio of around 16.5 percent, meaning there were far fewer older residents relative to the working population than there are today. By 1981, that ratio had climbed to 23.2 percent, and by 2011 it had reached 25.0 percent for England and Wales.
Postwar Britain experienced two major baby booms, the first following 1947 and the second in the mid 1960s, both of which left lasting bulges in the population pyramid that are still visible today as those cohorts move into their seventies and eighties. Birth rates fell sharply from the late 1960s onward, while life expectancy rose steadily, a combination that has pushed the median age of the population from roughly 34.9 years in 1950 toward over 40 years in the 2020s.
Past Trends Table (1951 to 2011)
| Year | UK or England and Wales Population | Share Aged 65 and Over | Old Age Dependency Ratio | Notable Context |
|---|---|---|---|---|
| 1951 | 43.8 million (England and Wales) | Around 11 percent | 16.5 percent | First postwar census, baby boom beginning |
| 1971 | Around 55.9 million (UK) | Around 13 percent | Rising steadily | UK-wide data begins |
| 1981 | Around 56.3 million (UK) | Around 15 percent | 23.2 percent | The second baby boom generation is reaching adulthood |
| 1991 | Around 57.4 million (UK) | Around 15.8 percent | Continued rise | The working age share is around 63.8 percent by decade’s end |
| 2001 | Around 59.1 million (UK) | Around 15.9 percent | Gradual increase | Fertility near historic low of 1.6 children per woman |
| 2011 | 56.1 million (England and Wales); around 63.3 million (UK) | Around 16.4 percent | 25.0 percent | Life expectancy reached 79 years for men, 83 for women |
| 2021 | Around 67.0 million (UK, Census year) | Around 18.6 percent | Continued rise | Median age around 40.7 years |
Figures for years before 2011 are drawn from a combination of census records and ONS historical series, and are rounded to reflect the level of precision available for older estimates.
The Last 10 Years: UK Population by Age Group (2015 to 2024)
The last decade has been marked by slower overall population growth than the 2000s, a temporary dip in growth around the coronavirus pandemic years, and a steady rise in the share of the population aged 65 and over.
Net international migration has remained the single largest driver of population change throughout this period, more than offsetting a natural change that has been close to flat or even negative in several years because births have fallen while deaths have risen with an ageing population.
Some key patterns from the past ten years include the following.
- The population aged 65 and over rose from 17.9 percent of the UK total in mid-2015 to close to 19 percent by mid-2024.
- The number of people aged 85 and over reached around 1.6 million by 2019, making up 2.5 percent of the population, and has continued climbing since.
- Median age rose from 40.0 years in 2015 to over 40.7 years by the early 2020s before easing slightly by mid-2024.
- Growth in the year to mid-2019 was the slowest since mid-2004, reflecting a temporary slowdown in net migration.
- The year to mid-2024 saw the second-largest annual numerical population increase in more than 75 years, driven by international migration.
Last 10 Years Table (2015 to 2024)
| Year | Total UK Population | Aged 0 to 15 (Share) | Aged 16 to 64 (Share) | Aged 65 and Over (Share) | Median Age |
|---|---|---|---|---|---|
| 2015 | 65.1 million | 18.9 percent | 63.2 percent | 17.9 percent | 40.0 years |
| 2016 | 65.6 million | 18.9 percent | 63.1 percent | 18.0 percent | 40.0 years |
| 2017 | 66.0 million | 18.8 percent | 63.0 percent | 18.2 percent | 40.0 years |
| 2018 | 66.4 million | 18.7 percent | 62.9 percent | 18.4 percent | 40.1 years |
| 2019 | 66.8 million | 18.6 percent | 62.9 percent | 18.5 percent | 40.3 years |
| 2020 | 67.1 million | 18.5 percent | 62.8 percent | 18.7 percent | 40.4 years |
| 2021 | 67.0 million | 18.4 percent | 62.6 percent | 19.0 percent | 40.7 years |
| 2022 | 67.6 million | 18.3 percent | 62.6 percent | 19.1 percent | 40.7 years |
| 2023 | 68.3 million | 18.2 percent | 62.7 percent | 19.1 percent | 40.7 years |
| 2024 | 69.3 million | 18.2 percent | 63.9 percent | 17.9 percent (65+ pensionable age basis) | 40.6 years |
Note that the mid-2024 figures reflect the ONS shift toward reporting the older population using the “pensionable age” measure, which now stands at 66 years rather than a flat 65, so the pensionable age share reads slightly lower than the strict 65 and over share used in earlier years. On a strict 65 and over basis, the 2024 figure remains close to 19.5 percent of the population.
Current Snapshot: The UK Population by Age Group in 2024
The most recent official mid-year estimate, covering mid-2024, put the UK population at 69,281,400 people, an increase of 755,300 (1.1 percent) on the previous year. This was the second-largest annual numerical increase in over 75 years, driven overwhelmingly by net international migration rather than natural change.
Breaking the 2024 population down by broad life stage:
- Children (aged 0 to 15): approximately 12.6 million people, or 18.2 percent of the population.
- Working age (16 years to State Pension age): approximately 44.3 million people, or 63.9 percent of the population.
- Pensionable age and over: approximately 12.4 million people, or 17.9 percent of the population.
The most populous individual age band in 2024 was 30 to 34 years, at close to 4.8 million people, followed closely by 35 to 39 years at 4.78 million. There is also a distinctive spike around age 77, a direct echo of the high birth numbers recorded in 1947, just after the Second World War.
Generational breakdowns for 2024 show Millennials as the largest generational group at around 15 million people, ahead of Generation X at 14 million, Baby Boomers at 13.4 million, Generation Z at 13.6 million, and the youngest cohort, Generation Alpha, at 9.2 million. Notably, 2024 was the first year in which Generation Z outnumbered Baby Boomers in the UK.
Regional variation remains significant. London has the youngest median age in the country at 35.7 years, while South West England has the oldest at 43.7 years, reflecting long-running patterns of younger people moving to major cities for work and older residents retiring to coastal and rural areas.
Future Projections: UK Population by Age Group to 2049
The ONS 2024-based national population projections show continued but slower overall growth, alongside an accelerating shift toward an older population. The UK population is projected to grow from 69.3 million in mid-2024 to 71.0 million in mid-2034, an increase of 1.7 million, or 2.5 percent. This is a slower rate of growth than earlier projection rounds anticipated, largely because net migration assumptions have been revised down.
Under these projections, all future population growth arises from net international migration. Natural change, meaning births minus deaths, is expected to turn negative, with an estimated 6.40 million births against 6.85 million deaths over the ten years to mid-2034, a natural change of negative 450,000.
The age structure is projected to shift as follows.
- By mid-2034, the number of children (0 to 15 years) is projected to fall by 1.6 million, a decline of 12.7 percent, from 12.6 million to 11.0 million.
- Over the same period, the working age population is projected to grow by 1.5 million, or 3.4 percent, from 44.3 million to 45.8 million.
- The number of people of pensionable age is projected to increase by 1.8 million, or 14.6 percent, from 12.4 million to 14.2 million, representing one in five people in the UK by 2034.
- By mid-2049, the number of children is projected to be 16.3 percent below 2024 levels, while the working age population grows by 5.1 percent and the pensionable age population rises by 23.7 percent to reach 15.3 million.
- The UK population is projected to peak at 72.5 million around mid-2054, before beginning a gradual decline.
The old age dependency ratio, which measures the number of people of pensionable age for every 1,000 people of working age, is projected to rise from 280 in mid-2024 to 310 in mid-2034 and 329 by mid-2049. This ratio is a key measure used by the government for long-term financial and pension planning, and its steady rise underlines the growing fiscal pressure associated with an ageing population.
Looking further ahead, some long-range ONS analysis has suggested that by 2066 there could be an additional 8.6 million people aged 65 and over compared with current levels, taking the total 65 and over population to around 20.4 million people, or roughly 26.5 percent of the projected population at that time. By 2050, the ONS and independent researchers broadly agree that around one in four people in the UK will be aged 65 or over, up from roughly one in five in the late 2010s.
Future Projected (2024 to 2054)
| Year | Total UK Population | Children Aged 0 to 15 | Working Age Population | Pensionable Age Population | Old Age Dependency Ratio |
|---|---|---|---|---|---|
| 2024 (baseline) | 69.3 million | 12.6 million (18.2 percent) | 44.3 million (63.9 percent) | 12.4 million (17.9 percent) | 280 per 1,000 |
| 2034 (projected) | 71.0 million | 11.0 million (15.5 percent) | 45.8 million (64.5 percent) | 14.2 million (20.0 percent) | 310 per 1,000 |
| 2049 (projected) | Around 72.3 million | Around 10.5 million (14.6 percent) | Around 46.6 million (64.4 percent) | 15.3 million (21.1 percent) | 329 per 1,000 |
| 2054 (peak, projected) | 72.5 million (population peak) | Continued decline | Broadly stable | Continued increase | Above 329 per 1,000 |
UK Population by Age Group, Past, Present, and Future
The table below draws together the historical, current, and projected figures into a single view spanning more than a century of change.
| Year | Total UK Population | Share Aged 0 to 15 (or Children) | Share Aged 16 to 64 (or Working Age) | Share Aged 65 and Over (or Pensionable Age) | Median Age |
|---|---|---|---|---|---|
| 1951 | 43.8 million (England and Wales) | Around 22 percent | Around 67 percent | Around 11 percent | Not directly comparable |
| 1981 | 56.3 million | Around 21 percent | Around 64 percent | Around 15 percent | Not directly comparable |
| 2001 | 59.1 million | Around 20 percent | Around 64 percent | Around 15.9 percent | 37.7 years |
| 2011 | 63.3 million | Around 18.9 percent | Around 64.6 percent | Around 16.4 percent | 39.7 years |
| 2015 | 65.1 million | 18.9 percent | 63.2 percent | 17.9 percent | 40.0 years |
| 2019 | 66.8 million | 18.6 percent | 62.9 percent | 18.5 percent | 40.3 years |
| 2021 | 67.0 million | 18.4 percent | 62.6 percent | 19.0 percent | 40.7 years |
| 2024 (current) | 69.3 million | 18.2 percent | 63.9 percent | 17.9 percent (pensionable age basis) | 40.6 years |
| 2034 (projected) | 71.0 million | 15.5 percent | 64.5 percent | 20.0 percent | Rising further |
| 2049 (projected) | Around 72.3 million | 14.6 percent | 64.4 percent | 21.1 percent | Rising further |
| 2054 (peak, projected) | 72.5 million | Continued decline | Broadly stable | Continued rise | Rising further |
What Is Driving the Shift in UK Age Structure
Three forces are shaping the long-term reshaping of the UK population by age group.
- Falling fertility. The UK’s total fertility rate has declined from around 1.9 children per woman in 2010 to a level closer to the early 2000s low of 1.6, reducing the flow of children into the population and shrinking the base of the age pyramid over time.
- Rising life expectancy. Life expectancy at birth reached 79.4 years for men and 83.1 years for women in the period 2017 to 2019, though the pace of improvement has slowed compared with earlier decades. Longer lives mean more people surviving into their seventies, eighties, and beyond.
- Net international migration. Migration has been the dominant driver of UK population growth since the 1990s and is projected to remain the only source of growth going forward, since natural change (births minus deaths) is expected to turn negative within the next decade.
Together, these forces explain why the UK, like most of Europe, is moving steadily up what demographers call the ageing curve, with a shrinking base of children, a slowly growing working age middle, and a rapidly expanding top of older residents.
Regional and Local Variation
Age structure is far from uniform across the UK. Coastal and rural areas in the South West of England, parts of Wales, and the east coast of England and Scotland tend to have some of the oldest populations, with more than 30 percent of residents aged 65 and over in some local authorities such as North Norfolk.
By contrast, major cities, particularly London, have some of the youngest populations in the country, with London recording the highest share of residents aged 16 to 64 of any UK region alongside the lowest share aged 65 and over, at around 12 percent.
This pattern reflects long-running migration behavior. Younger adults move toward cities for education and employment, while a mix of family formation and retirement draws people toward suburban, coastal, and rural locations later in life.
Conclusion
The story of the UK population by age group is one of a country steadily ageing, with the working age population growing only modestly, the child population shrinking, and the number of older residents rising quickly enough to reshape healthcare, pension, and housing policy for decades to come. From an old age dependency ratio of around 16.5 percent in the early 1950s to a projected 329 per 1,000 by 2049, the UK’s demographic center of gravity has shifted decisively upward.
Net international migration remains the single force keeping the overall population growing at all, and as natural change turns negative over the coming decade, migration policy and its interaction with an ageing population will likely remain one of the defining demographic and economic questions facing the UK.
Frequently Asked Questions
What percentage of the UK population is over 65?
As of mid-2024, around 17.9 percent of the UK population was of pensionable age and over, while the strict 65 and over measure sits closer to 19.5 percent. This share is projected to rise to around one in five people by the mid-2030s and roughly one in four by 2050.
What percentage of the UK population is under 16?
Children aged 0 to 15 made up approximately 18.2 percent of the UK population in mid-2024, down from closer to 19 percent a decade earlier, and this share is projected to keep falling toward 14 to 15 percent by the late 2040s.
What is the median age in the UK?
The median age of the UK population was around 40.6 years in mid-2024, up from roughly 40.0 years in 2015 and 34.9 years in 1950. It is projected to keep rising in the coming decades.
Is the UK population getting older?
Yes. The UK has been ageing steadily since the postwar period, driven by falling fertility and rising life expectancy. The number of people of pensionable age is projected to grow far faster than the number of children or working-age adults over the next 25 years.
When will the UK population stop growing?
Based on the latest ONS 2024-based projections, the UK population is expected to peak at around 72.5 million people in mid-2054, before beginning a slow decline, as net migration becomes insufficient to offset a negative natural change.





