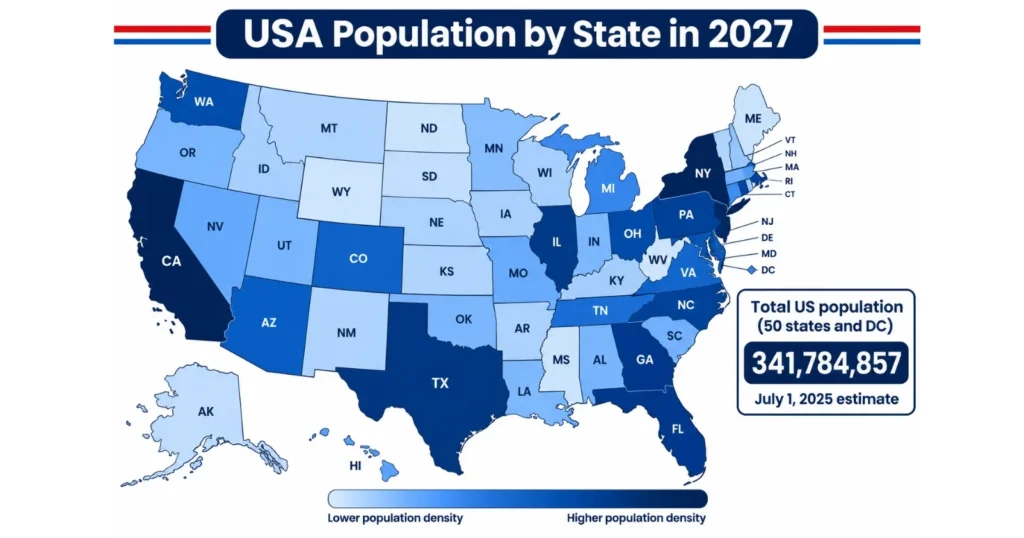
The United States has 50 states with sharply different demographic profiles. California is projected to hold about 39.3 million residents in 2027, while Wyoming is projected to have roughly 593,000. Taken together, the 50 states are projected to reach about 344.7 million people by July 1, 2027, up from 341.1 million on July 1, 2025.
Size and growth tell different stories. California, Texas, Florida and New York remain the four largest states, yet California and New York recorded almost no growth in the latest estimate year, while Texas and Florida added hundreds of thousands of residents. Idaho, Utah, South Carolina, Texas and Florida lead the growth rankings since 2020. Seven states, including California, New York and Illinois, had fewer residents in mid-2025 than in the April 2020 Census base.
US Population in 2027, National Overview
Estimated Total Population of the United States in 2027
The Census Bureau estimated the resident population of the 50 states and the District of Columbia at 341,784,857 on July 1, 2025. That is 10,268,744 more people than the April 2020 estimate base of 331,516,113, a gain of 3.1%. Growth between July 2024 and July 2025 was only 0.5%, or about 1.8 million people, as net international migration fell sharply.
The 50 states alone held 341,091,212 people in July 2025. Under the projection method described above, they reach about 344,697,000 in July 2027. That implies growth of +1.1% over two years, or roughly 0.53% a year. The District of Columbia, with 693,645 residents in 2025, is treated separately and is not included in any state ranking, as are the U.S. territories.
Key US Population Statistics for 2027
| Demographic indicator | Figure | Reference |
|---|---|---|
| Total US population (50 states and DC) | 341,784,857 | July 1, 2025 estimate |
| Total population, 50 states | 344,697,000 | July 1, 2027 projection |
| Number of states | 50 | Fixed |
| Male population share | About 49.1% | July 1, 2025 estimate |
| Female population share | About 50.9% | July 1, 2025 estimate |
| Women outnumber men by | About 6.3 million | July 1, 2025 estimate |
| Population density (50 states) | 98 people per square mile | 2027 projection over land area |
| Median age | 39.4 years | July 1, 2025 estimate |
| Under 18 population | 21.1% (72.0 million) | July 1, 2025 estimate |
| Population aged 65 and older | 18.9% (64.6 million) | July 1, 2025 estimate |
| Annual population growth | 0.5% | July 2024 to July 2025 |
| Urban population | 80.0% | 2020 Census |
| Rural population | 20.0% | 2020 Census |
These are national indicators. A state can differ widely from them, which is why the sections below break each measure down by state. Utah, for example, has a median age of 32.6 against a national figure of 39.4, while Maine sits at 44.9.
USA Population by State in 2027, Complete Ranking of All 50 States
Population Ranking of All 50 US States
USA Population by State in 2027
| Rank | State | July 2025 estimate | 2027 projection | Population share | Change from 2020 base | Annual growth 2024 to 2025 |
|---|---|---|---|---|---|---|
| 1 | California | 39,355,309 | 39,336,000 | 11.41% | -219,703 (-0.6%) | -0.02% |
| 2 | Texas | 31,709,821 | 32,507,000 | 9.43% | +3,357,502 (+11.5%) | +1.25% |
| 3 | Florida | 23,462,518 | 23,861,000 | 6.92% | +2,322,793 (+10.8%) | +0.85% |
| 4 | New York | 20,002,427 | 20,004,000 | 5.80% | -199,696 (-1.0%) | +0.01% |
| 5 | Pennsylvania | 13,059,432 | 13,087,000 | 3.80% | +84,247 (+0.6%) | +0.10% |
| 6 | Illinois | 12,719,141 | 12,751,000 | 3.70% | -70,741 (-0.6%) | +0.13% |
| 7 | Ohio | 11,900,510 | 11,981,000 | 3.48% | +181,555 (+1.5%) | +0.34% |
| 8 | Georgia | 11,302,748 | 11,502,000 | 3.34% | +788,139 (+7.4%) | +0.88% |
| 9 | North Carolina | 11,197,968 | 11,496,000 | 3.34% | +1,054,608 (+10.1%) | +1.32% |
| 10 | Michigan | 10,127,884 | 10,184,000 | 2.95% | +104,638 (+1.0%) | +0.28% |
| 11 | New Jersey | 9,548,215 | 9,632,000 | 2.79% | +342,976 (+3.7%) | +0.44% |
| 12 | Virginia | 8,880,107 | 9,002,000 | 2.61% | +370,581 (+4.3%) | +0.69% |
| 13 | Washington | 8,001,020 | 8,149,000 | 2.36% | +441,481 (+5.7%) | +0.92% |
| 14 | Arizona | 7,623,818 | 7,760,000 | 2.25% | +601,896 (+8.4%) | +0.89% |
| 15 | Tennessee | 7,315,076 | 7,444,000 | 2.16% | +531,681 (+7.7%) | +0.88% |
| 16 | Massachusetts | 7,154,084 | 7,185,000 | 2.08% | +151,888 (+2.2%) | +0.22% |
| 17 | Indiana | 6,973,333 | 7,051,000 | 2.05% | +264,395 (+3.9%) | +0.56% |
| 18 | Missouri | 6,270,541 | 6,325,000 | 1.83% | +170,087 (+2.8%) | +0.43% |
| 19 | Maryland | 6,265,347 | 6,306,000 | 1.83% | +124,360 (+2.0%) | +0.32% |
| 20 | Colorado | 6,012,561 | 6,061,000 | 1.76% | +285,674 (+4.9%) | +0.40% |
| 21 | Wisconsin | 5,972,787 | 6,004,000 | 1.74% | +109,677 (+1.9%) | +0.26% |
| 22 | Minnesota | 5,830,405 | 5,897,000 | 1.71% | +190,267 (+3.3%) | +0.57% |
| 23 | South Carolina | 5,570,274 | 5,734,000 | 1.66% | +615,750 (+12.0%) | +1.46% |
| 24 | Alabama | 5,193,088 | 5,254,000 | 1.52% | +228,563 (+4.5%) | +0.58% |
| 25 | Kentucky | 4,606,864 | 4,653,000 | 1.35% | +146,713 (+3.3%) | +0.50% |
| 26 | Louisiana | 4,618,189 | 4,625,000 | 1.34% | -32,894 (-0.7%) | +0.07% |
| 27 | Oregon | 4,273,586 | 4,290,000 | 1.24% | +52,718 (+1.2%) | +0.19% |
| 28 | Oklahoma | 4,123,288 | 4,175,000 | 1.21% | +215,646 (+5.4%) | +0.62% |
| 29 | Connecticut | 3,688,496 | 3,717,000 | 1.08% | +109,250 (+3.0%) | +0.38% |
| 30 | Utah | 3,538,904 | 3,612,000 | 1.05% | +340,399 (+10.4%) | +1.03% |
| 31 | Nevada | 3,282,188 | 3,340,000 | 0.97% | +234,407 (+7.5%) | +0.88% |
| 32 | Iowa | 3,238,387 | 3,254,000 | 0.94% | +63,418 (+2.0%) | +0.25% |
| 33 | Arkansas | 3,114,791 | 3,153,000 | 0.91% | +141,470 (+4.7%) | +0.60% |
| 34 | Kansas | 2,977,220 | 3,001,000 | 0.87% | +63,014 (+2.1%) | +0.40% |
| 35 | Mississippi | 2,954,160 | 2,962,000 | 0.86% | +736 (+0.0%) | +0.14% |
| 36 | New Mexico | 2,125,498 | 2,123,000 | 0.62% | +5,508 (+0.3%) | -0.06% |
| 37 | Idaho | 2,029,733 | 2,089,000 | 0.61% | +249,877 (+13.6%) | +1.44% |
| 38 | Nebraska | 2,018,006 | 2,043,000 | 0.59% | +81,020 (+4.1%) | +0.62% |
| 39 | West Virginia | 1,766,147 | 1,764,000 | 0.51% | -29,759 (-1.7%) | -0.07% |
| 40 | Hawaii | 1,432,820 | 1,429,000 | 0.41% | -26,267 (-1.8%) | -0.15% |
| 41 | New Hampshire | 1,415,342 | 1,429,000 | 0.41% | +51,427 (+3.7%) | +0.48% |
| 42 | Maine | 1,414,874 | 1,428,000 | 0.41% | +64,782 (+4.8%) | +0.46% |
| 43 | Montana | 1,144,694 | 1,159,000 | 0.34% | +74,779 (+6.9%) | +0.63% |
| 44 | Rhode Island | 1,114,521 | 1,123,000 | 0.33% | +25,643 (+2.3%) | +0.37% |
| 45 | Delaware | 1,059,952 | 1,080,000 | 0.31% | +90,050 (+9.1%) | +0.94% |
| 46 | South Dakota | 935,094 | 951,000 | 0.28% | +64,344 (+7.3%) | +0.86% |
| 47 | North Dakota | 799,358 | 811,000 | 0.24% | +31,864 (+4.1%) | +0.75% |
| 48 | Alaska | 737,270 | 739,000 | 0.21% | +5,617 (+0.8%) | +0.10% |
| 49 | Vermont | 644,663 | 641,000 | 0.19% | -2,077 (-0.3%) | -0.29% |
| 50 | Wyoming | 588,753 | 593,000 | 0.17% | +16,128 (+2.8%) | +0.35% |
Sources: U.S. Census Bureau, Vintage 2025 Population Estimates (NST-EST2025-POP); 2027 projection and shares calculated by this article. Shares are percentages of the 50-state total.
States With the Largest Populations in 2027
The ten most populated states are projected to hold 186.7 million people in 2027, or 54.2% of the 50-state total. In order, they are California, Texas, Florida, New York, Pennsylvania, Illinois, Ohio, Georgia, North Carolina, and Michigan.
California leads with about 39.3 million (11.4% of the total). Its population stood 200,394 below the April 2020 base in mid-2025, yet it remains 1.21 times the size of Texas, the clear number two at about 32.5 million. Texas has added 2,560,323 residents since 2020, the largest numeric gain of any state, and Florida ranks third at about 23.9 million after adding 1,924,311.
New York is fourth at 20.0 million, essentially flat in the latest year. Pennsylvania, Illinois and Ohio follow, and none has moved far from its 2020 size.
States With the Smallest Populations in 2027
The ten least populated states, from smallest, are Wyoming, Vermont, Alaska, North Dakota, South Dakota, Delaware, Rhode Island, Montana, Maine and New Hampshire. Together they are projected at 10.0 million people, about 2.9% of the national total. Wyoming is the smallest at about 593,000, and 5 states are projected to stay under one million residents.
Low population does not always mean low density. Rhode Island and Delaware are among the ten smallest states but are densely settled, at about 1,086 and 554 people per square mile, while Alaska’s population is spread over 571,409 square miles.
Which States Account for the Largest Share of the US Population?
Population is concentrated. The five largest states, California, Texas, Florida, New York, and Pennsylvania, are projected to hold 37.4% of the 50-state total in 2027, and the top ten hold 54.2%. California, Texas, and Florida alone account for about 95.7 million people, or 27.8%.
The gap between the biggest and smallest states is large. California is projected at roughly 66 times the population of Wyoming. In mid-2025, California alone had more residents than the 21 least populated states combined.
Male and Female Population by State in 2027
A state total says nothing about who lives there. Sex composition varies with age structure, migration, military and university populations, and the type of local economy. The tables use sex as the Census Bureau reports it, as male and female, and do not measure gender identity.
Male Population by State
Nationally, women outnumbered men by about 6.3 million in 2025 and made up 50.9% of the population. By count, the largest male populations in 2027 belong to California, Texas, and Florida, simply because these are the largest states. By share, men are the highest proportion in Alaska (52.2%), North Dakota (51.2%), and Wyoming (51.0%). The smallest male shares are in Alabama (48.3%), Delaware (48.3%), and Mississippi (48.4%).
Female Population by State
Women make up the highest share in Alabama (51.7%), Delaware (51.7%), and Mississippi (51.6%). In absolute terms, California and Texas have the most women, at about 19.8 million and 16.4 million in 2027. Only 11 states, Alaska, North Dakota, Wyoming, South Dakota, Colorado, Utah, Montana, Nevada, Idaho, Hawaii, and Washington, show more men than women, and Washington sits barely above parity.
Male to Female Ratio Across the United States
The ratio ranges from 109.2 males per 100 females in Alaska down to 93.6 in Alabama. Alaska, North Dakota and Wyoming are the three highest, at 109.2, 104.9 and 103.9. Western states show the male tilt most often, while Southern and Northeastern states, with older populations and long female life expectancy, lean female.
Several factors can shape these patterns. Age matters most, because women live longer, so the oldest age groups are heavily female. Employment in energy extraction, fishing and construction, large military installations, universities, retirement migration and international migration also affect the balance, though the data in this article do not isolate the weight of each.
Male and Female Population by State in 2027
| State | 2027 projected population | Male population | Male % | Female population | Female % | Males per 100 females |
|---|---|---|---|---|---|---|
| Alabama | 5,254,000 | 2,540,000 | 48.3% | 2,714,000 | 51.7% | 93.6 |
| Alaska | 739,000 | 386,000 | 52.2% | 353,000 | 47.8% | 109.2 |
| Arizona | 7,760,000 | 3,857,000 | 49.7% | 3,903,000 | 50.3% | 98.8 |
| Arkansas | 3,153,000 | 1,548,000 | 49.1% | 1,605,000 | 50.9% | 96.4 |
| California | 39,336,000 | 19,559,000 | 49.7% | 19,777,000 | 50.3% | 98.9 |
| Colorado | 6,061,000 | 3,052,000 | 50.3% | 3,009,000 | 49.7% | 101.4 |
| Connecticut | 3,717,000 | 1,813,000 | 48.8% | 1,904,000 | 51.2% | 95.2 |
| Delaware | 1,080,000 | 522,000 | 48.3% | 558,000 | 51.7% | 93.6 |
| Florida | 23,861,000 | 11,668,000 | 48.9% | 12,193,000 | 51.1% | 95.7 |
| Georgia | 11,502,000 | 5,594,000 | 48.6% | 5,908,000 | 51.4% | 94.7 |
| Hawaii | 1,429,000 | 717,000 | 50.1% | 712,000 | 49.9% | 100.6 |
| Idaho | 2,089,000 | 1,048,000 | 50.1% | 1,041,000 | 49.9% | 100.6 |
| Illinois | 12,751,000 | 6,265,000 | 49.1% | 6,486,000 | 50.9% | 96.6 |
| Indiana | 7,051,000 | 3,475,000 | 49.3% | 3,576,000 | 50.7% | 97.2 |
| Iowa | 3,254,000 | 1,616,000 | 49.7% | 1,638,000 | 50.3% | 98.7 |
| Kansas | 3,001,000 | 1,496,000 | 49.8% | 1,505,000 | 50.2% | 99.4 |
| Kentucky | 4,653,000 | 2,291,000 | 49.2% | 2,362,000 | 50.8% | 97.0 |
| Louisiana | 4,625,000 | 2,258,000 | 48.8% | 2,367,000 | 51.2% | 95.4 |
| Maine | 1,428,000 | 699,000 | 49.0% | 729,000 | 51.0% | 96.0 |
| Maryland | 6,306,000 | 3,055,000 | 48.5% | 3,251,000 | 51.5% | 94.0 |
| Massachusetts | 7,185,000 | 3,487,000 | 48.5% | 3,698,000 | 51.5% | 94.3 |
| Michigan | 10,184,000 | 5,014,000 | 49.2% | 5,170,000 | 50.8% | 97.0 |
| Minnesota | 5,897,000 | 2,937,000 | 49.8% | 2,960,000 | 50.2% | 99.2 |
| Mississippi | 2,962,000 | 1,434,000 | 48.4% | 1,528,000 | 51.6% | 93.9 |
| Missouri | 6,325,000 | 3,103,000 | 49.1% | 3,222,000 | 50.9% | 96.3 |
| Montana | 1,159,000 | 583,000 | 50.3% | 576,000 | 49.7% | 101.2 |
| Nebraska | 2,043,000 | 1,019,000 | 49.9% | 1,024,000 | 50.1% | 99.5 |
| Nevada | 3,340,000 | 1,676,000 | 50.2% | 1,664,000 | 49.8% | 100.7 |
| New Hampshire | 1,429,000 | 708,000 | 49.6% | 721,000 | 50.4% | 98.3 |
| New Jersey | 9,632,000 | 4,705,000 | 48.8% | 4,927,000 | 51.2% | 95.5 |
| New Mexico | 2,123,000 | 1,051,000 | 49.5% | 1,072,000 | 50.5% | 98.0 |
| New York | 20,004,000 | 9,714,000 | 48.6% | 10,290,000 | 51.4% | 94.4 |
| North Carolina | 11,496,000 | 5,592,000 | 48.6% | 5,904,000 | 51.4% | 94.7 |
| North Dakota | 811,000 | 415,000 | 51.2% | 396,000 | 48.8% | 104.9 |
| Ohio | 11,981,000 | 5,871,000 | 49.0% | 6,110,000 | 51.0% | 96.1 |
| Oklahoma | 4,175,000 | 2,069,000 | 49.5% | 2,106,000 | 50.5% | 98.2 |
| Oregon | 4,290,000 | 2,127,000 | 49.6% | 2,163,000 | 50.4% | 98.3 |
| Pennsylvania | 13,087,000 | 6,413,000 | 49.0% | 6,674,000 | 51.0% | 96.1 |
| Rhode Island | 1,123,000 | 546,000 | 48.6% | 577,000 | 51.4% | 94.7 |
| South Carolina | 5,734,000 | 2,780,000 | 48.5% | 2,954,000 | 51.5% | 94.1 |
| South Dakota | 951,000 | 479,000 | 50.4% | 472,000 | 49.6% | 101.5 |
| Tennessee | 7,444,000 | 3,632,000 | 48.8% | 3,812,000 | 51.2% | 95.3 |
| Texas | 32,507,000 | 16,147,000 | 49.7% | 16,360,000 | 50.3% | 98.7 |
| Utah | 3,612,000 | 1,819,000 | 50.3% | 1,793,000 | 49.7% | 101.4 |
| Vermont | 641,000 | 317,000 | 49.4% | 324,000 | 50.6% | 97.6 |
| Virginia | 9,002,000 | 4,428,000 | 49.2% | 4,574,000 | 50.8% | 96.8 |
| Washington | 8,149,000 | 4,077,000 | 50.0% | 4,072,000 | 50.0% | 100.1 |
| West Virginia | 1,764,000 | 872,000 | 49.4% | 892,000 | 50.6% | 97.8 |
| Wisconsin | 6,004,000 | 2,988,000 | 49.8% | 3,016,000 | 50.2% | 99.1 |
| Wyoming | 593,000 | 302,000 | 51.0% | 291,000 | 49.0% | 103.9 |
Population Density by State in 2027
What Is Population Density?
Population density is the number of residents divided by land area, which is why it separates crowded states from sparsely settled ones in a way raw totals cannot.
Population density = total population / land area (square miles)
This article uses people per square mile as the main unit, with people per square kilometer as a second column. Land area excludes water, and the same Census land area definition is used for all 50 states.
Most Densely Populated States
New Jersey is the densest state, at about 1,310 people per square mile in 2027, followed by Rhode Island (1,086), Massachusetts (921), Connecticut (767), Maryland (649) and Delaware (554). These are small states with large metropolitan areas, or, in New Jersey’s case, a state with large parts inside the New York and Philadelphia urban areas.
Least Densely Populated States
Alaska has about 1.3 people per square mile, then Wyoming (6.1), Montana (8.0), North Dakota (12), South Dakota (13) and New Mexico (18). Large land area, mountainous terrain and cold climates keep these numbers low. Alaska’s 571,409 square miles of land exceed Texas and California combined.
Population Density Versus Total Population
California has about 39.3 million residents but a density of 252 per square mile, because its 155,860 square miles of land are nearly three times the size of Florida’s. Alaska has the opposite profile, with the 48th largest population and the lowest density. New Jersey packs 9.6 million people into 7,355 square miles. Density and total population are separate measures and should not be treated as interchangeable.
Population Density by State in 2027
| State | 2027 projected population | Land area (sq. miles) | Population per sq. mile | Population per sq. km | Density rank |
|---|---|---|---|---|---|
| Alabama | 5,254,000 | 50,652 | 104 | 40 | 27 |
| Alaska | 739,000 | 571,409 | 1.3 | 0.5 | 50 |
| Arizona | 7,760,000 | 113,656 | 68 | 26 | 32 |
| Arkansas | 3,153,000 | 51,992 | 61 | 23 | 35 |
| California | 39,336,000 | 155,860 | 252 | 97 | 11 |
| Colorado | 6,061,000 | 103,637 | 58 | 23 | 36 |
| Connecticut | 3,717,000 | 4,843 | 767 | 296 | 4 |
| Delaware | 1,080,000 | 1,949 | 554 | 214 | 6 |
| Florida | 23,861,000 | 53,658 | 445 | 172 | 7 |
| Georgia | 11,502,000 | 57,718 | 199 | 77 | 16 |
| Hawaii | 1,429,000 | 6,423 | 222 | 86 | 15 |
| Idaho | 2,089,000 | 82,645 | 25 | 9.8 | 44 |
| Illinois | 12,751,000 | 55,514 | 230 | 89 | 13 |
| Indiana | 7,051,000 | 35,825 | 197 | 76 | 17 |
| Iowa | 3,254,000 | 55,854 | 58 | 22 | 37 |
| Kansas | 3,001,000 | 81,759 | 37 | 14 | 41 |
| Kentucky | 4,653,000 | 39,486 | 118 | 45 | 24 |
| Louisiana | 4,625,000 | 43,221 | 107 | 41 | 26 |
| Maine | 1,428,000 | 30,845 | 46 | 18 | 38 |
| Maryland | 6,306,000 | 9,711 | 649 | 251 | 5 |
| Massachusetts | 7,185,000 | 7,801 | 921 | 356 | 3 |
| Michigan | 10,184,000 | 56,613 | 180 | 69 | 20 |
| Minnesota | 5,897,000 | 79,632 | 74 | 29 | 29 |
| Mississippi | 2,962,000 | 46,925 | 63 | 24 | 33 |
| Missouri | 6,325,000 | 68,747 | 92 | 36 | 28 |
| Montana | 1,159,000 | 145,550 | 8.0 | 3.1 | 48 |
| Nebraska | 2,043,000 | 76,815 | 27 | 10 | 43 |
| Nevada | 3,340,000 | 109,860 | 30 | 12 | 42 |
| New Hampshire | 1,429,000 | 8,954 | 160 | 62 | 21 |
| New Jersey | 9,632,000 | 7,355 | 1,310 | 506 | 1 |
| New Mexico | 2,123,000 | 121,313 | 18 | 6.8 | 45 |
| New York | 20,004,000 | 47,123 | 425 | 164 | 8 |
| North Carolina | 11,496,000 | 48,624 | 236 | 91 | 12 |
| North Dakota | 811,000 | 68,994 | 12 | 4.5 | 47 |
| Ohio | 11,981,000 | 40,859 | 293 | 113 | 9 |
| Oklahoma | 4,175,000 | 68,597 | 61 | 23 | 34 |
| Oregon | 4,290,000 | 95,997 | 45 | 17 | 39 |
| Pennsylvania | 13,087,000 | 44,742 | 292 | 113 | 10 |
| Rhode Island | 1,123,000 | 1,034 | 1,086 | 419 | 2 |
| South Carolina | 5,734,000 | 30,064 | 191 | 74 | 18 |
| South Dakota | 951,000 | 75,809 | 13 | 4.8 | 46 |
| Tennessee | 7,444,000 | 41,225 | 181 | 70 | 19 |
| Texas | 32,507,000 | 261,260 | 124 | 48 | 22 |
| Utah | 3,612,000 | 82,596 | 44 | 17 | 40 |
| Vermont | 641,000 | 9,217 | 70 | 27 | 31 |
| Virginia | 9,002,000 | 39,481 | 228 | 88 | 14 |
| Washington | 8,149,000 | 66,457 | 123 | 47 | 23 |
| West Virginia | 1,764,000 | 24,041 | 73 | 28 | 30 |
| Wisconsin | 6,004,000 | 54,168 | 111 | 43 | 25 |
| Wyoming | 593,000 | 97,089 | 6.1 | 2.4 | 49 |
Population by Age Group Across US States
Population Under 18 Years
The national under 18 share was 21.1% in July 2025, and the number of children fell by about 1.8 million between 2020 and 2025. The highest child shares are in Utah (26.1%), Texas (24.0%) and Nebraska (23.7%). The lowest are in Vermont (17.0%), New Hampshire (17.3%) and Maine (17.3%). The South was the only Census region where the under 18 population grew between 2020 and 2025, at 1.1%, while the Northeast, Midwest and West declined by 4.1%, 3.9% and 5.7%. These shares shape school enrollment, child care demand and pediatric services.
Working Age Population, 18 to 64 Years
The working age share, calculated here as 100% minus the under 18 and 65 and older shares, ranges from 57.1% in South Dakota to 62.6% in Colorado. South Dakota’s low figure comes from relatively large shares of both children (23.5%) and residents aged 65 and older (19.4%). Nationally, the Census Bureau’s June 2026 release showed the 45 to 64 group shrinking by 3.2% since 2020 as baby boomers aged out of it.
Population Aged 65 and Above
The 65 and older population reached 64.6 million in 2025, or 18.9%, after growing 16.2% since 2020. Maine (24.6%), Vermont (24.1%), New Hampshire (23.0%) and Florida (22.8%) have the highest shares, and Utah (13.0%), Texas (14.9%) and Alaska (15.8%) have the lowest. Florida’s share of 22.8% is among the highest, and the Census Bureau notes that county level shares are also high in parts of Arizona, Idaho and Nevada and along the Pacific Northwest coast.
States With the Youngest and Oldest Populations
Utah has the lowest median age at 32.6, followed by Texas (36.0), North Dakota (36.5), Alaska (36.7) and Nebraska (37.5). The oldest are Maine (44.9), Vermont (44.4), New Hampshire (44.1), West Virginia (43.2) and Florida (43.1). The spread between Utah and Maine is 12.3 years.
Population by Age Group Across All 50 States, July 1, 2025
| State | Under 18 | 18 to 64 | 65 and above | Median age |
|---|---|---|---|---|
| Alabama | 21.5% | 59.1% | 19.4% | 39.8 |
| Alaska | 23.3% | 60.9% | 15.8% | 36.7 |
| Arizona | 21.0% | 58.4% | 20.6% | 39.4 |
| Arkansas | 22.4% | 58.6% | 19.0% | 39.0 |
| California | 20.8% | 61.7% | 17.5% | 38.7 |
| Colorado | 20.3% | 62.6% | 17.1% | 38.0 |
| Connecticut | 19.5% | 60.1% | 20.4% | 41.4 |
| Delaware | 19.8% | 57.4% | 22.8% | 42.3 |
| Florida | 18.9% | 58.3% | 22.8% | 43.1 |
| Georgia | 22.2% | 61.1% | 16.7% | 38.2 |
| Hawaii | 19.7% | 57.7% | 22.6% | 42.1 |
| Idaho | 23.3% | 58.0% | 18.7% | 37.9 |
| Illinois | 20.6% | 60.7% | 18.7% | 39.7 |
| Indiana | 22.6% | 59.0% | 18.4% | 38.6 |
| Iowa | 22.2% | 57.7% | 20.1% | 39.3 |
| Kansas | 22.9% | 58.2% | 18.9% | 38.1 |
| Kentucky | 22.1% | 59.1% | 18.8% | 39.5 |
| Louisiana | 22.7% | 58.5% | 18.8% | 39.0 |
| Maine | 17.3% | 58.1% | 24.6% | 44.9 |
| Maryland | 21.3% | 60.3% | 18.4% | 39.8 |
| Massachusetts | 18.6% | 61.5% | 19.9% | 40.4 |
| Michigan | 20.4% | 59.1% | 20.5% | 40.7 |
| Minnesota | 22.0% | 58.9% | 19.1% | 39.4 |
| Mississippi | 22.3% | 58.4% | 19.3% | 39.6 |
| Missouri | 21.7% | 58.7% | 19.6% | 39.6 |
| Montana | 20.2% | 57.6% | 22.2% | 41.2 |
| Nebraska | 23.7% | 58.0% | 18.3% | 37.5 |
| Nevada | 20.7% | 61.0% | 18.3% | 39.6 |
| New Hampshire | 17.3% | 59.7% | 23.0% | 44.1 |
| New Jersey | 20.9% | 60.6% | 18.5% | 40.1 |
| New Mexico | 20.7% | 58.2% | 21.1% | 40.1 |
| New York | 19.5% | 61.2% | 19.3% | 39.8 |
| North Carolina | 21.1% | 60.0% | 18.9% | 39.5 |
| North Dakota | 22.9% | 59.2% | 17.9% | 36.5 |
| Ohio | 21.3% | 58.5% | 20.2% | 40.1 |
| Oklahoma | 23.2% | 58.8% | 18.0% | 37.7 |
| Oregon | 19.0% | 60.0% | 21.0% | 41.1 |
| Pennsylvania | 19.7% | 58.9% | 21.4% | 41.4 |
| Rhode Island | 17.7% | 61.4% | 20.9% | 41.2 |
| South Carolina | 20.6% | 58.3% | 21.1% | 41.1 |
| South Dakota | 23.5% | 57.1% | 19.4% | 38.4 |
| Tennessee | 21.5% | 59.9% | 18.6% | 39.2 |
| Texas | 24.0% | 61.1% | 14.9% | 36.0 |
| Utah | 26.1% | 60.9% | 13.0% | 32.6 |
| Vermont | 17.0% | 58.9% | 24.1% | 44.4 |
| Virginia | 20.9% | 60.7% | 18.4% | 39.4 |
| Washington | 20.4% | 61.3% | 18.3% | 38.8 |
| West Virginia | 19.5% | 58.0% | 22.5% | 43.2 |
| Wisconsin | 20.5% | 58.7% | 20.8% | 41.0 |
| Wyoming | 21.6% | 57.7% | 20.7% | 40.2 |
Population Growth by State, Which States Are Growing the Fastest?
Fastest Growing States by Percentage
Between July 2024 and July 2025, the fastest percentage gains were in South Carolina (+1.46%), Idaho (+1.44%), North Carolina (+1.32%), Texas (+1.25%), Utah (+1.03%) and Delaware (+0.94%). Since the April 2020 base, the leaders are Idaho (+10.4%), Florida (+8.9%), South Carolina (+8.8%), Texas (+8.8%) and Utah (+8.2%). Idaho’s +190,610 residents since 2020 equal a gain of 10.4%, the highest rate of any state.
States Adding the Largest Number of Residents
Texas added 391,243 people in the latest year, nearly double the 196,680 added by Florida. North Carolina (145,907), Georgia (98,540) and Washington (73,062) followed. Since 2020, Texas has added 2,560,323, Florida 1,924,311 and North Carolina 756,576. A large state can add more people than a small state while growing more slowly in percentage terms, which is why both measures are shown.
States Experiencing Population Decline
Five states lost population in the latest year: California (-9,465), Hawaii (-2,132), Vermont (-1,858), New Mexico (-1,276) and West Virginia (-1,255). Measured against the 2020 base, seven states are smaller: Hawaii (-1.5%), West Virginia (-1.5%), New York (-1.0%), Louisiana (-0.9%), Illinois (-0.8%), California (-0.5%) and Mississippi (-0.2%). Under the constant rate projection, these states stay roughly flat or shrink further by 2027, but a change in migration could alter that quickly.
Historical Population Changes From 2020 to 2027
Population Growth and Change by State
| State | April 2020 base | July 2025 estimate | 2027 projection | Total change 2020 to 2027 | Growth % | Average annual growth |
|---|---|---|---|---|---|---|
| Idaho | 1,839,123 | 2,029,733 | 2,089,000 | +249,877 | +13.6% | +1.77% |
| South Carolina | 5,118,250 | 5,570,274 | 5,734,000 | +615,750 | +12.0% | +1.58% |
| Texas | 29,149,498 | 31,709,821 | 32,507,000 | +3,357,502 | +11.5% | +1.52% |
| Florida | 21,538,207 | 23,462,518 | 23,861,000 | +2,322,793 | +10.8% | +1.42% |
| Utah | 3,271,601 | 3,538,904 | 3,612,000 | +340,399 | +10.4% | +1.37% |
| North Carolina | 10,441,392 | 11,197,968 | 11,496,000 | +1,054,608 | +10.1% | +1.34% |
| Delaware | 989,950 | 1,059,952 | 1,080,000 | +90,050 | +9.1% | +1.21% |
| Arizona | 7,158,104 | 7,623,818 | 7,760,000 | +601,896 | +8.4% | +1.12% |
| Tennessee | 6,912,319 | 7,315,076 | 7,444,000 | +531,681 | +7.7% | +1.03% |
| Nevada | 3,105,593 | 3,282,188 | 3,340,000 | +234,407 | +7.5% | +1.01% |
| Georgia | 10,713,861 | 11,302,748 | 11,502,000 | +788,139 | +7.4% | +0.98% |
| South Dakota | 886,656 | 935,094 | 951,000 | +64,344 | +7.3% | +0.97% |
| Montana | 1,084,221 | 1,144,694 | 1,159,000 | +74,779 | +6.9% | +0.92% |
| Washington | 7,707,519 | 8,001,020 | 8,149,000 | +441,481 | +5.7% | +0.77% |
| Oklahoma | 3,959,354 | 4,123,288 | 4,175,000 | +215,646 | +5.4% | +0.73% |
| Colorado | 5,775,326 | 6,012,561 | 6,061,000 | +285,674 | +4.9% | +0.67% |
| Maine | 1,363,218 | 1,414,874 | 1,428,000 | +64,782 | +4.8% | +0.64% |
| Arkansas | 3,011,530 | 3,114,791 | 3,153,000 | +141,470 | +4.7% | +0.64% |
| Alabama | 5,025,437 | 5,193,088 | 5,254,000 | +228,563 | +4.5% | +0.62% |
| Virginia | 8,631,419 | 8,880,107 | 9,002,000 | +370,581 | +4.3% | +0.58% |
| Nebraska | 1,961,980 | 2,018,006 | 2,043,000 | +81,020 | +4.1% | +0.56% |
| North Dakota | 779,136 | 799,358 | 811,000 | +31,864 | +4.1% | +0.55% |
| Indiana | 6,786,605 | 6,973,333 | 7,051,000 | +264,395 | +3.9% | +0.53% |
| New Hampshire | 1,377,573 | 1,415,342 | 1,429,000 | +51,427 | +3.7% | +0.51% |
| New Jersey | 9,289,024 | 9,548,215 | 9,632,000 | +342,976 | +3.7% | +0.50% |
| Minnesota | 5,706,733 | 5,830,405 | 5,897,000 | +190,267 | +3.3% | +0.45% |
| Kentucky | 4,506,287 | 4,606,864 | 4,653,000 | +146,713 | +3.3% | +0.44% |
| Connecticut | 3,607,750 | 3,688,496 | 3,717,000 | +109,250 | +3.0% | +0.41% |
| Wyoming | 576,872 | 588,753 | 593,000 | +16,128 | +2.8% | +0.38% |
| Missouri | 6,154,913 | 6,270,541 | 6,325,000 | +170,087 | +2.8% | +0.38% |
| Rhode Island | 1,097,357 | 1,114,521 | 1,123,000 | +25,643 | +2.3% | +0.32% |
| Massachusetts | 7,033,112 | 7,154,084 | 7,185,000 | +151,888 | +2.2% | +0.30% |
| Kansas | 2,937,986 | 2,977,220 | 3,001,000 | +63,014 | +2.1% | +0.29% |
| Maryland | 6,181,640 | 6,265,347 | 6,306,000 | +124,360 | +2.0% | +0.28% |
| Iowa | 3,190,582 | 3,238,387 | 3,254,000 | +63,418 | +2.0% | +0.27% |
| Wisconsin | 5,894,323 | 5,972,787 | 6,004,000 | +109,677 | +1.9% | +0.25% |
| Ohio | 11,799,445 | 11,900,510 | 11,981,000 | +181,555 | +1.5% | +0.21% |
| Oregon | 4,237,282 | 4,273,586 | 4,290,000 | +52,718 | +1.2% | +0.17% |
| Michigan | 10,079,362 | 10,127,884 | 10,184,000 | +104,638 | +1.0% | +0.14% |
| Alaska | 733,383 | 737,270 | 739,000 | +5,617 | +0.8% | +0.11% |
| Pennsylvania | 13,002,753 | 13,059,432 | 13,087,000 | +84,247 | +0.6% | +0.09% |
| New Mexico | 2,117,492 | 2,125,498 | 2,123,000 | +5,508 | +0.3% | +0.04% |
| Mississippi | 2,961,264 | 2,954,160 | 2,962,000 | +736 | +0.0% | +0.00% |
| Vermont | 643,077 | 644,663 | 641,000 | -2,077 | -0.3% | -0.04% |
| Illinois | 12,821,741 | 12,719,141 | 12,751,000 | -70,741 | -0.6% | -0.08% |
| California | 39,555,703 | 39,355,309 | 39,336,000 | -219,703 | -0.6% | -0.08% |
| Louisiana | 4,657,894 | 4,618,189 | 4,625,000 | -32,894 | -0.7% | -0.10% |
| New York | 20,203,696 | 20,002,427 | 20,004,000 | -199,696 | -1.0% | -0.14% |
| West Virginia | 1,793,759 | 1,766,147 | 1,764,000 | -29,759 | -1.7% | -0.23% |
| Hawaii | 1,455,267 | 1,432,820 | 1,429,000 | -26,267 | -1.8% | -0.25% |
Sources: Census Bureau Vintage 2025 estimates; 2027 projection and growth rates calculated by this article.
Population by Race and Ethnicity Across the 50 States
Race and Hispanic origin are separate Census concepts, and Hispanic residents can be of any race. The “Racial and Ethnic Composition by State, 2020 Census” table therefore uses mutually exclusive groups, with non-Hispanic residents by single race and Hispanic or Latino residents of any race. Figures are 2020 Census percentages, the latest complete count with this detail, and are not 2027 projections.
White Population by State
Non-Hispanic White residents are the largest group in 47 of the 50 states. They make up more than 89% of residents in Maine (90.2%), West Virginia (89.1%) and Vermont (89.1%). The shares are lowest in Hawaii (21.6%), California (34.7%), New Mexico (36.5%) and Texas (39.8%), where White residents are not the majority.
Black or African American Population by State
The highest Black shares are in Mississippi (36.4%), Louisiana (31.2%), Georgia (30.6%), Maryland (29.1%) and Alabama (25.6%), a pattern centered on the Southeast and Mid-Atlantic.
Hispanic and Latino Population by State
New Mexico has the highest Hispanic share at 47.7%, followed by California (39.4%), Texas (39.3%), Arizona (30.6%) and Nevada (28.7%). The lowest shares are in West Virginia (1.9%), Maine (1.9%) and Vermont (2.4%).
Asian Population by State
Hawaii has by far the highest non-Hispanic Asian share at 36.5%, followed by California (15.1%), New Jersey (10.2%), New York (9.5%) and Washington (9.4%).
Multiracial and Other Racial Groups
The remaining column combines non-Hispanic Native Hawaiian and Pacific Islander, some other race, and two or more races. Hawaii stands out because 20.1% of residents report two or more races and 10.2% identify as Native Hawaiian or Pacific Islander. Alaska has the highest American Indian and Alaska Native share at 14.8%, followed by New Mexico (8.9%), South Dakota (8.4%) and Oklahoma (7.9%).
Racial and Ethnic Composition by State, 2020 Census (percent of state population)
| State | White (non-Hispanic) | Black (non-Hispanic) | Hispanic or Latino | Asian (non-Hispanic) | American Indian or Alaska Native (non-Hispanic) | All other (NHPI, other race, two or more) |
|---|---|---|---|---|---|---|
| Alabama | 63.1% | 25.6% | 5.3% | 1.5% | 0.5% | 4.0% |
| Alaska | 57.5% | 2.8% | 6.8% | 5.9% | 14.8% | 12.1% |
| Arizona | 53.4% | 4.4% | 30.6% | 3.5% | 3.7% | 4.4% |
| Arkansas | 68.5% | 14.9% | 8.5% | 1.7% | 0.7% | 5.6% |
| California | 34.7% | 5.4% | 39.4% | 15.1% | 0.4% | 5.0% |
| Colorado | 65.1% | 3.8% | 21.9% | 3.4% | 0.6% | 5.2% |
| Connecticut | 63.2% | 10.0% | 17.3% | 4.7% | 0.2% | 4.6% |
| Delaware | 58.6% | 21.5% | 10.5% | 4.3% | 0.2% | 4.8% |
| Florida | 51.5% | 14.5% | 26.4% | 2.9% | 0.2% | 4.4% |
| Georgia | 50.1% | 30.6% | 10.5% | 4.4% | 0.2% | 4.2% |
| Hawaii | 21.6% | 1.5% | 9.6% | 36.5% | 0.2% | 30.7% |
| Idaho | 78.9% | 0.8% | 13.0% | 1.4% | 1.0% | 4.9% |
| Illinois | 58.3% | 13.9% | 18.2% | 5.8% | 0.1% | 3.6% |
| Indiana | 75.5% | 9.4% | 8.2% | 2.5% | 0.2% | 4.3% |
| Iowa | 82.7% | 4.0% | 6.8% | 2.4% | 0.3% | 3.9% |
| Kansas | 72.2% | 5.6% | 13.0% | 2.9% | 0.8% | 5.5% |
| Kentucky | 81.3% | 7.9% | 4.6% | 1.6% | 0.2% | 4.3% |
| Louisiana | 55.8% | 31.2% | 6.9% | 1.8% | 0.6% | 3.8% |
| Maine | 90.2% | 1.8% | 1.9% | 1.2% | 0.5% | 4.3% |
| Maryland | 47.2% | 29.1% | 11.8% | 6.8% | 0.2% | 5.0% |
| Massachusetts | 67.5% | 6.5% | 12.6% | 7.2% | 0.1% | 6.0% |
| Michigan | 72.4% | 13.5% | 5.6% | 3.3% | 0.5% | 4.8% |
| Minnesota | 76.3% | 6.9% | 6.1% | 5.2% | 1.0% | 4.6% |
| Mississippi | 55.4% | 36.4% | 3.5% | 1.1% | 0.5% | 3.1% |
| Missouri | 75.8% | 11.3% | 4.9% | 2.1% | 0.4% | 5.5% |
| Montana | 83.1% | 0.5% | 4.2% | 0.7% | 6.0% | 5.5% |
| Nebraska | 75.7% | 4.8% | 12.0% | 2.7% | 0.8% | 4.1% |
| Nevada | 45.9% | 9.4% | 28.7% | 8.6% | 0.8% | 6.7% |
| New Hampshire | 87.2% | 1.4% | 4.3% | 2.6% | 0.2% | 4.4% |
| New Jersey | 51.9% | 12.4% | 21.6% | 10.2% | 0.1% | 3.9% |
| New Mexico | 36.5% | 1.8% | 47.7% | 1.7% | 8.9% | 3.4% |
| New York | 52.5% | 13.7% | 19.5% | 9.5% | 0.3% | 4.6% |
| North Carolina | 60.5% | 20.2% | 10.7% | 3.3% | 1.0% | 4.4% |
| North Dakota | 81.7% | 3.4% | 4.3% | 1.7% | 4.8% | 4.2% |
| Ohio | 75.9% | 12.3% | 4.4% | 2.5% | 0.2% | 4.7% |
| Oklahoma | 60.8% | 7.2% | 11.9% | 2.3% | 7.9% | 10.0% |
| Oregon | 71.7% | 1.9% | 13.9% | 4.5% | 1.0% | 7.1% |
| Pennsylvania | 73.5% | 10.5% | 8.1% | 3.9% | 0.1% | 3.9% |
| Rhode Island | 68.7% | 5.0% | 16.6% | 3.5% | 0.3% | 5.8% |
| South Carolina | 62.1% | 24.8% | 6.9% | 1.8% | 0.3% | 4.1% |
| South Dakota | 79.6% | 2.0% | 4.4% | 1.5% | 8.4% | 4.2% |
| Tennessee | 70.9% | 15.7% | 6.9% | 1.9% | 0.2% | 4.3% |
| Texas | 39.8% | 11.8% | 39.3% | 5.4% | 0.3% | 3.5% |
| Utah | 75.4% | 1.1% | 15.1% | 2.4% | 0.9% | 5.2% |
| Vermont | 89.1% | 1.3% | 2.4% | 1.8% | 0.3% | 5.0% |
| Virginia | 58.6% | 18.3% | 10.5% | 7.1% | 0.2% | 5.3% |
| Washington | 63.8% | 3.8% | 13.8% | 9.4% | 1.2% | 8.0% |
| West Virginia | 89.1% | 3.6% | 1.9% | 0.8% | 0.2% | 4.3% |
| Wisconsin | 78.6% | 6.2% | 7.6% | 3.0% | 0.8% | 3.8% |
| Wyoming | 81.4% | 0.8% | 10.2% | 0.9% | 2.0% | 4.6% |
Urban and Rural Population by State
States With the Highest Urban Population Shares
Nationally, 80.0% of residents lived in Census-defined urban areas in 2020. The most urban states are California (94.2%), Nevada (94.1%), New Jersey (93.8%), Florida (91.5%), and Massachusetts (91.3%). California and Nevada exceed 94%, and both are dominated by large metropolitan areas such as Los Angeles and Las Vegas.
States With the Highest Rural Population Shares
Four states had rural majorities in 2020: Vermont (64.9% rural), Maine (61.4% rural), West Virginia (55.4% rural) and Mississippi (53.7% rural). Vermont was the least urban state at 35.1% urban, and Maine was close behind at 38.6%. Alaska, Montana, South Dakota and Arkansas are among the other states below 65% urban.
Urbanization and Changing Settlement Patterns
The Census Bureau’s June 2026 release found that growth in the South between 2020 and 2025 was concentrated in the outlying counties of metropolitan areas, which grew 10.7% compared with 6.1% for central metro counties. Metro counties in the South grew 6.7%, against 0.8% in Northeast metro areas. Micro and non-metro counties in the Northeast and Midwest were close to flat. The pattern points to suburban and exurban expansion at the edges of metro areas. Housing and infrastructure pressures follow where the growth is fastest.
Urban and Rural Population by State, 2020 Census
| State | Urban share | Rural share |
|---|---|---|
| Alabama | 57.7% | 42.3% |
| Alaska | 64.9% | 35.1% |
| Arizona | 89.3% | 10.7% |
| Arkansas | 55.5% | 44.5% |
| California | 94.2% | 5.8% |
| Colorado | 86.0% | 14.0% |
| Connecticut | 86.3% | 13.7% |
| Delaware | 82.6% | 17.4% |
| Florida | 91.5% | 8.5% |
| Georgia | 74.1% | 25.9% |
| Hawaii | 86.1% | 13.9% |
| Idaho | 69.2% | 30.8% |
| Illinois | 86.9% | 13.1% |
| Indiana | 71.2% | 28.8% |
| Iowa | 63.2% | 36.8% |
| Kansas | 72.3% | 27.7% |
| Kentucky | 58.7% | 41.3% |
| Louisiana | 71.5% | 28.5% |
| Maine | 38.6% | 61.4% |
| Maryland | 85.6% | 14.4% |
| Massachusetts | 91.3% | 8.7% |
| Michigan | 73.5% | 26.5% |
| Minnesota | 71.9% | 28.1% |
| Mississippi | 46.3% | 53.7% |
| Missouri | 69.5% | 30.5% |
| Montana | 53.4% | 46.6% |
| Nebraska | 73.0% | 27.0% |
| Nevada | 94.1% | 5.9% |
| New Hampshire | 58.3% | 41.7% |
| New Jersey | 93.8% | 6.2% |
| New Mexico | 74.5% | 25.5% |
| New York | 87.4% | 12.6% |
| North Carolina | 66.7% | 33.3% |
| North Dakota | 61.0% | 39.0% |
| Ohio | 76.3% | 23.7% |
| Oklahoma | 64.6% | 35.4% |
| Oregon | 80.5% | 19.5% |
| Pennsylvania | 76.5% | 23.5% |
| Rhode Island | 91.1% | 8.9% |
| South Carolina | 67.9% | 32.1% |
| South Dakota | 57.2% | 42.8% |
| Tennessee | 66.2% | 33.8% |
| Texas | 83.7% | 16.3% |
| Utah | 89.8% | 10.2% |
| Vermont | 35.1% | 64.9% |
| Virginia | 75.6% | 24.4% |
| Washington | 83.4% | 16.6% |
| West Virginia | 44.6% | 55.4% |
| Wisconsin | 67.1% | 32.9% |
| Wyoming | 62.0% | 38.0% |
Population Changes Due to Births, Deaths and Migration
Natural Population Increase
Deaths exceeded births in 17 states in the year to July 2025. The largest natural decreases were in Pennsylvania (-10,708), West Virginia (-7,887), Maine (-5,019) and Michigan (-4,998). The largest natural gains were in Texas (+157,711), California (+109,715) and New York (+42,815). Age structure drives these figures, because states with many older residents record more deaths.
Domestic Migration Between States
The largest domestic gains were in North Carolina (+84,064), Texas (+67,299), South Carolina (+66,622), Tennessee (+42,389) and Arizona (+31,107). The largest domestic losses were in California (-229,077), New York (-137,586), Illinois (-40,017), New Jersey (-37,428) and Massachusetts (-33,340). The Census Bureau noted that the Midwest recorded positive net domestic migration for the first time in at least 15 years, helping all 12 Midwestern states grow in 2025, and the Northeast lost 205,552 residents to domestic migration. The data measure how many people moved, not why, and this article does not attribute motives.
International Migration
International migration was the main source of growth in many large states, led by Florida (+178,674), Texas (+167,475), California (+109,278), New York (+95,634), and New Jersey (+53,064). Every state recorded a lower level in 2025 than in 2024. Nationally, net international migration fell from about 2.7 million to about 1.3 million.
States Gaining and Losing Residents Through Migration
Migration and total growth are not the same. Hawaii’s total change was -2,132 despite a natural gain of +2,024, because domestic outflow of -8,876 outweighed international arrivals. New York’s total change was only +1,008, as a natural gain of +42,815 and international arrivals of +95,634 nearly cancelled domestic losses of -137,586. Maine grew by 6,436 despite a natural decrease of -5,019, because net migration added 11,446.
Components of Population Change by State, July 1, 2024 to July 1, 2025
| State | Births | Deaths | Natural increase or decrease | Domestic migration | International migration | Total population change |
|---|---|---|---|---|---|---|
| Alabama | 57,680 | 59,868 | -2,188 | +23,358 | +8,946 | +30,033 |
| Alaska | 8,867 | 5,559 | +3,308 | -4,525 | +1,959 | +733 |
| Arizona | 78,926 | 71,277 | +7,649 | +31,107 | +28,219 | +67,394 |
| Arkansas | 35,414 | 36,638 | -1,224 | +14,475 | +5,470 | +18,711 |
| California | 398,632 | 288,917 | +109,715 | -229,077 | +109,278 | -9,465 |
| Colorado | 65,380 | 44,772 | +20,608 | -12,100 | +15,356 | +24,059 |
| Connecticut | 34,700 | 32,417 | +2,283 | -5,945 | +17,534 | +14,047 |
| Delaware | 10,328 | 10,882 | -554 | +6,855 | +3,473 | +9,829 |
| Florida | 225,971 | 227,304 | -1,333 | +22,517 | +178,674 | +196,680 |
| Georgia | 126,446 | 97,815 | +28,631 | +27,333 | +42,579 | +98,540 |
| Hawaii | 14,631 | 12,607 | +2,024 | -8,876 | +4,768 | -2,132 |
| Idaho | 23,695 | 16,795 | +6,900 | +19,915 | +2,148 | +28,861 |
| Illinois | 125,129 | 114,226 | +10,903 | -40,017 | +44,752 | +16,108 |
| Indiana | 79,648 | 71,087 | +8,561 | +12,197 | +17,852 | +38,579 |
| Iowa | 36,470 | 33,521 | +2,949 | -970 | +5,903 | +7,933 |
| Kansas | 34,416 | 29,465 | +4,951 | -519 | +7,440 | +11,968 |
| Kentucky | 52,982 | 53,065 | -83 | +7,269 | +15,709 | +22,818 |
| Louisiana | 51,886 | 49,112 | +2,774 | -14,387 | +14,900 | +3,311 |
| Maine | 11,783 | 16,802 | -5,019 | +7,406 | +4,040 | +6,436 |
| Maryland | 65,090 | 53,646 | +11,444 | -12,127 | +20,503 | +20,033 |
| Massachusetts | 68,055 | 59,636 | +8,419 | -33,340 | +40,240 | +15,524 |
| Michigan | 99,680 | 104,678 | -4,998 | +1,796 | +30,706 | +27,922 |
| Minnesota | 62,576 | 50,505 | +12,071 | +8,300 | +12,486 | +33,000 |
| Mississippi | 33,168 | 35,775 | -2,607 | -917 | +7,451 | +3,988 |
| Missouri | 68,377 | 68,200 | +177 | +14,028 | +12,665 | +26,997 |
| Montana | 11,348 | 11,438 | -90 | +6,348 | +899 | +7,137 |
| Nebraska | 24,396 | 18,260 | +6,136 | -366 | +6,599 | +12,415 |
| Nevada | 32,511 | 29,460 | +3,051 | +14,914 | +10,551 | +28,645 |
| New Hampshire | 11,911 | 14,078 | -2,167 | +6,554 | +2,403 | +6,824 |
| New Jersey | 100,999 | 74,976 | +26,023 | -37,428 | +53,064 | +41,861 |
| New Mexico | 20,235 | 22,120 | -1,885 | -2,267 | +2,879 | -1,276 |
| New York | 203,078 | 160,263 | +42,815 | -137,586 | +95,634 | +1,008 |
| North Carolina | 123,046 | 107,917 | +15,129 | +84,064 | +46,890 | +145,907 |
| North Dakota | 9,760 | 7,130 | +2,630 | +512 | +2,810 | +5,971 |
| Ohio | 126,825 | 127,554 | -729 | +11,926 | +28,505 | +39,889 |
| Oklahoma | 48,603 | 46,044 | +2,559 | +14,492 | +8,420 | +25,530 |
| Oregon | 38,334 | 42,098 | -3,764 | +2,228 | +9,636 | +8,262 |
| Pennsylvania | 126,981 | 137,689 | -10,708 | -2,936 | +26,921 | +13,584 |
| Rhode Island | 10,021 | 10,325 | -304 | -1,551 | +5,923 | +4,106 |
| South Carolina | 59,681 | 59,117 | +564 | +66,622 | +12,930 | +79,958 |
| South Dakota | 11,299 | 8,694 | +2,605 | +2,169 | +3,183 | +7,984 |
| Tennessee | 84,408 | 80,811 | +3,597 | +42,389 | +17,990 | +63,785 |
| Texas | 390,203 | 232,492 | +157,711 | +67,299 | +167,475 | +391,243 |
| Utah | 46,948 | 21,987 | +24,961 | +3,343 | +7,501 | +35,921 |
| Vermont | 4,979 | 6,748 | -1,769 | -726 | +623 | -1,858 |
| Virginia | 92,070 | 78,253 | +13,817 | +6,268 | +40,436 | +60,465 |
| Washington | 83,368 | 66,138 | +17,230 | +9,238 | +46,202 | +73,062 |
| West Virginia | 16,954 | 24,841 | -7,887 | +6,408 | +244 | -1,255 |
| Wisconsin | 59,167 | 58,006 | +1,161 | +6,984 | +7,260 | +15,619 |
| Wyoming | 6,070 | 5,775 | +295 | +1,474 | +258 | +2,031 |
Household and Family Demographic Trends Across US States
Average Household Size by State
The national average household size was 2.54 persons in 2024. Utah (2.97), Hawaii (2.85), and California (2.84) have the largest households; Utah also has the youngest median age, and California and Hawaii have large Hispanic and Asian populations. Maine (2.26), North Dakota (2.28), and Vermont (2.28) have the smallest. Maine and Vermont are also the two oldest states, while North Dakota is among the youngest, so age alone does not explain household size.
Family Households and Nonfamily Households
The data retrieved for this article cover total households and average household size only. A breakdown by married couple, single parent and nonfamily households, and by people living alone, requires ACS Tables S1101 and DP02 and should be added before publication if the editorial team wants that depth.
Changing Household Structures
Household size has long trended down, from 5.79 people in 1790 to 2.58 in 2010, though the rate slowed this decade. Aging, delayed marriage, smaller families and shared housing under cost pressure all influence the trend. Household counts matter for housing demand because a state can need many more homes even when population grows slowly.
Household Statistics by State, 2024
| State | Total households | Average household size | Size rank |
|---|---|---|---|
| Alabama | 1,997,250 | 2.48 | 19 |
| Alaska | 270,533 | 2.61 | 9 |
| Arizona | 2,856,080 | 2.53 | 11 |
| Arkansas | 1,205,990 | 2.46 | 25 |
| California | 13,548,100 | 2.84 | 3 |
| Colorado | 2,374,220 | 2.42 | 35 |
| Connecticut | 1,434,010 | 2.46 | 24 |
| Delaware | 402,038 | 2.48 | 21 |
| Florida | 8,752,810 | 2.51 | 13 |
| Georgia | 4,074,370 | 2.62 | 6 |
| Hawaii | 492,453 | 2.85 | 2 |
| Idaho | 713,005 | 2.64 | 5 |
| Illinois | 5,036,450 | 2.46 | 22 |
| Indiana | 2,716,010 | 2.46 | 23 |
| Iowa | 1,315,710 | 2.36 | 45 |
| Kansas | 1,174,060 | 2.44 | 30 |
| Kentucky | 1,814,470 | 2.43 | 33 |
| Louisiana | 1,804,780 | 2.49 | 17 |
| Maine | 597,159 | 2.26 | 50 |
| Maryland | 2,362,930 | 2.57 | 10 |
| Massachusetts | 2,785,040 | 2.44 | 28 |
| Michigan | 4,076,370 | 2.42 | 34 |
| Minnesota | 2,307,960 | 2.43 | 32 |
| Mississippi | 1,145,430 | 2.49 | 18 |
| Missouri | 2,508,230 | 2.40 | 38 |
| Montana | 458,859 | 2.37 | 44 |
| Nebraska | 797,847 | 2.42 | 37 |
| Nevada | 1,202,590 | 2.62 | 8 |
| New Hampshire | 555,822 | 2.44 | 31 |
| New Jersey | 3,507,700 | 2.62 | 7 |
| New Mexico | 837,414 | 2.48 | 20 |
| New York | 7,722,650 | 2.49 | 16 |
| North Carolina | 4,282,340 | 2.44 | 27 |
| North Dakota | 331,063 | 2.28 | 48 |
| Ohio | 4,863,190 | 2.37 | 42 |
| Oklahoma | 1,562,390 | 2.50 | 15 |
| Oregon | 1,718,420 | 2.42 | 36 |
| Pennsylvania | 5,274,850 | 2.39 | 39 |
| Rhode Island | 441,570 | 2.39 | 40 |
| South Carolina | 2,117,990 | 2.44 | 29 |
| South Dakota | 365,544 | 2.39 | 41 |
| Tennessee | 2,824,280 | 2.45 | 26 |
| Texas | 10,992,800 | 2.69 | 4 |
| Utah | 1,124,820 | 2.97 | 1 |
| Vermont | 273,416 | 2.28 | 49 |
| Virginia | 3,365,730 | 2.52 | 12 |
| Washington | 3,064,820 | 2.50 | 14 |
| West Virginia | 728,655 | 2.37 | 43 |
| Wisconsin | 2,479,480 | 2.33 | 47 |
| Wyoming | 243,318 | 2.34 | 46 |
Population Distribution by US Census Region
The four Census regions together include all 50 states. Washington, DC, which the Census Bureau places in the South, is excluded from the totals below. The South is projected at 135.5 million in 2027, or 39.3% of the 50 state total, the West at 23.4%, the Midwest at 20.4% and the Northeast at 16.9%.
Northeast
The Northeast’s nine states had 58.0 million residents in 2025 and grew only 0.7% since 2020. The region has the oldest cluster of states, with Maine, Vermont and New Hampshire the three oldest in the country, and it lost 205,552 people to domestic migration in the latest year.
Midwest
The Midwest’s twelve states grew 1.1% since 2020 to 69.8 million. Every Midwestern state gained population in the latest year, and the region recorded positive net domestic migration of 16,040.
South
The South’s sixteen states grew 6.0% since 2020, nearly double the national rate, and hold 133.1 million residents. It was the only region where every age group grew between 2020 and 2025, and its 16 states gained 361,918 people through domestic migration in the latest year.
West
The West’s thirteen states hold 80.1 million and grew 1.9% since 2020, with California’s small decline offset by gains elsewhere in the region. Coastal metropolitan areas sit alongside very low density interior states, and the region lost 168,278 residents to domestic migration while gaining internationally.
Population by Census Region
| Census region | Number of states | July 2025 population | 2027 projection | Share of 50 state total | Density 2027 (per sq. mile) | Growth 2020 to 2025 | Growth 2024 to 2025 |
|---|---|---|---|---|---|---|---|
| Northeast | 9 | 58,042,054 | 58,246,000 | 16.9% | 360 | +0.7% | +0.18% |
| Midwest | 12 | 69,762,666 | 70,253,000 | 20.4% | 94 | +1.1% | +0.35% |
| South | 16 | 133,140,338 | 135,518,000 | 39.3% | 156 | +6.0% | +0.89% |
| West | 13 | 80,146,154 | 80,680,000 | 23.4% | 46 | +1.9% | +0.33% |
Sources: Census Bureau Vintage 2025 estimates aggregated from state data by this article; 2027 projection by this article. Washington, DC is excluded.
Population Outlook, What Will Shape State Populations Beyond 2027?
The projection in this article extends a single year of data, so it is a scenario and not a forecast. Several forces will decide whether it holds. Aging is the most certain, since the 65 and older population grew 16.2% from 2020 to 2025 while the number of children fell. Fertility trends affect natural increase, and 17 states already record more deaths than births.
Migration is the most volatile. Net international migration roughly halved in a year, and analysts expect further slowing in 2026. Domestic movement toward the South and, more recently, the Midwest has changed state fortunes quickly. Housing availability and affordability, employment growth, climate-related risks, and infrastructure capacity can all redirect these flows, but their effect on specific states is not yet measurable in published data.
Any 2050 or 2100 figure should come from published Census Bureau or state demographer projections and be labeled as a scenario. The table below summarizes where each state stands going into 2027, with the main source of 2025 growth identified from the components data.
Selected Population Indicators and Demographic Outlook by State
| Rank | State | 2027 projection | Median age | Population aged 65+ | Growth trend 2024 to 2025 | Largest growth component 2025 |
|---|---|---|---|---|---|---|
| 1 | California | 39,336,000 | 38.7 | 17.5% | Flat (-0.02%) | Decline, domestic outflow |
| 2 | Texas | 32,507,000 | 36.0 | 14.9% | Fast growth (+1.25%) | International migration |
| 3 | Florida | 23,861,000 | 43.1 | 22.8% | Moderate growth (+0.85%) | International migration |
| 4 | New York | 20,004,000 | 39.8 | 19.3% | Flat (+0.01%) | International migration |
| 5 | Pennsylvania | 13,087,000 | 41.4 | 21.4% | Slow growth (+0.10%) | International migration |
| 6 | Illinois | 12,751,000 | 39.7 | 18.7% | Slow growth (+0.13%) | International migration |
| 7 | Ohio | 11,981,000 | 40.1 | 20.2% | Slow growth (+0.34%) | International migration |
| 8 | Georgia | 11,502,000 | 38.2 | 16.7% | Moderate growth (+0.88%) | International migration |
| 9 | North Carolina | 11,496,000 | 39.5 | 18.9% | Fast growth (+1.32%) | Domestic migration |
| 10 | Michigan | 10,184,000 | 40.7 | 20.5% | Slow growth (+0.28%) | International migration |
| 11 | New Jersey | 9,632,000 | 40.1 | 18.5% | Slow growth (+0.44%) | International migration |
| 12 | Virginia | 9,002,000 | 39.4 | 18.4% | Moderate growth (+0.69%) | International migration |
| 13 | Washington | 8,149,000 | 38.8 | 18.3% | Moderate growth (+0.92%) | International migration |
| 14 | Arizona | 7,760,000 | 39.4 | 20.6% | Moderate growth (+0.89%) | Domestic migration |
| 15 | Tennessee | 7,444,000 | 39.2 | 18.6% | Moderate growth (+0.88%) | Domestic migration |
| 16 | Massachusetts | 7,185,000 | 40.4 | 19.9% | Slow growth (+0.22%) | International migration |
| 17 | Indiana | 7,051,000 | 38.6 | 18.4% | Moderate growth (+0.56%) | International migration |
| 18 | Missouri | 6,325,000 | 39.6 | 19.6% | Slow growth (+0.43%) | Domestic migration |
| 19 | Maryland | 6,306,000 | 39.8 | 18.4% | Slow growth (+0.32%) | International migration |
| 20 | Colorado | 6,061,000 | 38.0 | 17.1% | Slow growth (+0.40%) | Natural increase |
| 21 | Wisconsin | 6,004,000 | 41.0 | 20.8% | Slow growth (+0.26%) | International migration |
| 22 | Minnesota | 5,897,000 | 39.4 | 19.1% | Moderate growth (+0.57%) | International migration |
| 23 | South Carolina | 5,734,000 | 41.1 | 21.1% | Fast growth (+1.46%) | Domestic migration |
| 24 | Alabama | 5,254,000 | 39.8 | 19.4% | Moderate growth (+0.58%) | Domestic migration |
| 25 | Kentucky | 4,653,000 | 39.5 | 18.8% | Slow growth (+0.50%) | International migration |
| 26 | Louisiana | 4,625,000 | 39.0 | 18.8% | Flat (+0.07%) | International migration |
| 27 | Oregon | 4,290,000 | 41.1 | 21.0% | Slow growth (+0.19%) | International migration |
| 28 | Oklahoma | 4,175,000 | 37.7 | 18.0% | Moderate growth (+0.62%) | Domestic migration |
| 29 | Connecticut | 3,717,000 | 41.4 | 20.4% | Slow growth (+0.38%) | International migration |
| 30 | Utah | 3,612,000 | 32.6 | 13.0% | Fast growth (+1.03%) | Natural increase |
| 31 | Nevada | 3,340,000 | 39.6 | 18.3% | Moderate growth (+0.88%) | Domestic migration |
| 32 | Iowa | 3,254,000 | 39.3 | 20.1% | Slow growth (+0.25%) | International migration |
| 33 | Arkansas | 3,153,000 | 39.0 | 19.0% | Moderate growth (+0.60%) | Domestic migration |
| 34 | Kansas | 3,001,000 | 38.1 | 18.9% | Slow growth (+0.40%) | International migration |
| 35 | Mississippi | 2,962,000 | 39.6 | 19.3% | Slow growth (+0.14%) | International migration |
| 36 | New Mexico | 2,123,000 | 40.1 | 21.1% | Flat (-0.06%) | Decline, domestic outflow |
| 37 | Idaho | 2,089,000 | 37.9 | 18.7% | Fast growth (+1.44%) | Domestic migration |
| 38 | Nebraska | 2,043,000 | 37.5 | 18.3% | Moderate growth (+0.62%) | International migration |
| 39 | West Virginia | 1,764,000 | 43.2 | 22.5% | Flat (-0.07%) | Decline, natural decrease |
| 40 | Hawaii | 1,429,000 | 42.1 | 22.6% | Decline (-0.15%) | Decline, domestic outflow |
| 41 | New Hampshire | 1,429,000 | 44.1 | 23.0% | Slow growth (+0.48%) | Domestic migration |
| 42 | Maine | 1,428,000 | 44.9 | 24.6% | Slow growth (+0.46%) | Domestic migration |
| 43 | Montana | 1,159,000 | 41.2 | 22.2% | Moderate growth (+0.63%) | Domestic migration |
| 44 | Rhode Island | 1,123,000 | 41.2 | 20.9% | Slow growth (+0.37%) | International migration |
| 45 | Delaware | 1,080,000 | 42.3 | 22.8% | Moderate growth (+0.94%) | Domestic migration |
| 46 | South Dakota | 951,000 | 38.4 | 19.4% | Moderate growth (+0.86%) | International migration |
| 47 | North Dakota | 811,000 | 36.5 | 17.9% | Moderate growth (+0.75%) | International migration |
| 48 | Alaska | 739,000 | 36.7 | 15.8% | Flat (+0.10%) | Natural increase |
| 49 | Vermont | 641,000 | 44.4 | 24.1% | Decline (-0.29%) | Decline, natural decrease |
| 50 | Wyoming | 593,000 | 40.2 | 20.7% | Slow growth (+0.35%) | Domestic migration |
Individual State Population Analysis, All 50 States
Each summary below uses the 2027 projection and ranking, change since the 2020 base, and the latest published indicators. Migration and natural change figures cover July 2024 to July 2025.
Population by State in the Northeast Region
1. Connecticut Population in 2027
Connecticut is projected to have 3.72 million residents in 2027, ranking 29th among the 50 states. This represents an estimated 3.0% increase from its 2020 population. The state’s median age is 41.4 years, with approximately 95.2 males for every 100 females. International migration has been an important contributor to population growth, adding 17,534 residents in the reported period. Unlike states with extensive rural territories, Connecticut has a highly concentrated settlement pattern, with much of its population distributed across the Hartford, New Haven and Stamford metropolitan areas.
Connecticut’s population distribution reflects its position within the densely populated Northeast corridor. Hartford is an important center for insurance, finance and government employment, while New Haven benefits from healthcare, higher education and research institutions. Stamford has strong connections to the New York metropolitan economy, attracting professionals in finance, technology and corporate services. Smaller communities in the eastern and northwestern parts of the state have considerably lower population densities. Its relatively mature age structure, established urban infrastructure and proximity to major employment markets will continue to influence housing demand and future population growth.
2. Maine Population in 2027
Maine is projected to have 1.43 million residents in 2027, placing it 42nd nationally. Its population is estimated to have increased by 4.8% since 2020. The state’s median age of 44.9 years makes it one of the oldest populations in the country, while its sex ratio stands at approximately 96 males per 100 females. Natural population change remains a challenge, with deaths exceeding births by 5,019 in the reported period. However, net migration contributed another 11,446 residents, demonstrating the importance of people moving into Maine to sustain population growth.
Population is concentrated around Portland, Lewiston, Bangor and several coastal communities, while much of northern and western Maine remains sparsely populated. Portland serves as the state’s principal economic and commercial center, supported by healthcare, education, tourism, shipping and professional services. Coastal communities attract seasonal visitors and new residents, while inland areas have stronger connections to forestry, agriculture and outdoor recreation. Maine’s comparatively high median age reflects its long standing demographic challenge of an ageing population. Continued migration could help offset natural population decline, although workforce availability, housing affordability and access to healthcare remain important considerations.
3. Massachusetts Population in 2027
Massachusetts is projected to reach 7.18 million residents in 2027, making it the 16th most populous state. Its population is estimated to have grown by 2.2% since 2020. The median age is 40.4 years, and the state has approximately 94.3 males per 100 females. International migration is a significant source of population growth, contributing 40,240 additional residents during the reported period. Its established universities, research institutions, healthcare facilities and professional employment markets continue to attract students, skilled workers and international residents.
Greater Boston contains the largest concentration of Massachusetts residents and serves as the state’s principal economic engine. Boston, Cambridge and surrounding communities have major concentrations of employment in biotechnology, higher education, financial services, healthcare and technology. Other important population centers include Worcester, Springfield and the South Coast communities. The western part of Massachusetts is generally less densely populated, with smaller cities and rural communities. The state’s strong educational and employment infrastructure supports international migration, although high housing costs and competition for residential space can influence where households choose to settle.
4. New Hampshire Population in 2027
New Hampshire is projected to have 1.43 million residents in 2027, ranking 41st among US states. The population represents an estimated 3.7% increase from 2020. Its median age is 44.1 years, and there are approximately 98.3 males for every 100 females. Natural change is negative, with deaths exceeding births by 2,167 in the reported period. Net migration added 8,957 residents, indicating that population gains are being supported primarily by people relocating to the state rather than by births exceeding deaths.
Manchester and Nashua are the largest population centers, benefiting from their connections to the Boston metropolitan economy. Concord, Portsmouth and surrounding communities also contribute to the state’s population distribution. New Hampshire has a combination of suburban settlements, smaller industrial towns and extensive rural areas, particularly in the northern part of the state. Its economy includes healthcare, manufacturing, professional services, tourism and technology related employment. The relatively high median age reflects an ageing population, while migration from neighboring states provides an important source of demographic renewal and workforce growth.
5. Rhode Island Population in 2027
Rhode Island is projected to have 1.12 million residents in 2027, making it the 44th most populous state. Its population is estimated to have increased by 2.3% since 2020. The median age stands at 41.2 years, with approximately 94.7 males per 100 females. The state recorded a natural population decrease of 304 people in the reported period, as deaths exceeded births. Net migration added 4,372 residents, helping offset the negative contribution from natural population change.
Providence is the central population and employment hub, with surrounding communities forming a closely connected metropolitan area. Other important settlements include Warwick, Cranston, Pawtucket and Newport. Rhode Island’s compact geographical area creates a relatively concentrated settlement pattern, with a substantial share of residents living in urban and suburban communities. Healthcare, education, tourism, marine industries and professional services are important parts of its economy. The state’s location between Boston and New York also creates employment and commuting connections beyond its borders. Limited land availability and housing costs are relevant factors influencing future residential development.
6. Vermont Population in 2027
Vermont is projected to have approximately 641,000 residents in 2027, ranking 49th nationally. This represents a slight decline of 0.3% compared with 2020. The median age is 44.4 years, and the state has approximately 97.6 males per 100 females. Its latest reported population change was a loss of 1,858 residents, including a natural decrease of 1,769 and negative net migration of 103. These figures illustrate the combined influence of an ageing population, relatively low birth numbers and limited migration driven growth.
Burlington is Vermont’s largest city and an important center for education, healthcare, commerce and employment. Other population centers include South Burlington, Rutland, Barre and Montpelier. Outside these communities, the state is characterized by small towns, mountainous landscapes and extensive rural settlements. Tourism, agriculture, dairy production, forestry, education and outdoor recreation contribute to the economy. Vermont’s high median age is particularly important because a growing proportion of older residents can increase demand for healthcare and retirement services while reducing the relative size of the working age population. Attracting younger households and maintaining access to affordable housing are important demographic considerations.
7. New Jersey Population in 2027
New Jersey is projected to have 9.63 million residents in 2027, ranking 11th nationally. Its population is estimated to have grown by 3.7% since 2020. The median age is 40.1 years, and there are approximately 95.5 males per 100 females. International migration contributed 53,064 residents during the reported period, highlighting the state’s continuing role as a destination for overseas migrants. Its location between New York City and Philadelphia also supports substantial commuting, business and residential connections across state boundaries.
Newark, Jersey City, Paterson and Elizabeth are among the major urban population centers, while the suburban counties contain numerous densely settled communities. Northern New Jersey is strongly connected to the New York metropolitan economy, whereas the southern part of the state has closer economic and transport links with Philadelphia. Major employment sectors include finance, pharmaceuticals, logistics, healthcare, education and professional services. New Jersey has one of the country’s most concentrated settlement patterns, with relatively little undeveloped land in many urban and suburban counties. International migration and established metropolitan employment opportunities remain important influences on its demographic structure.
8. New York Population in 2027
New York is projected to have 20.00 million residents in 2027, making it the fourth most populous state. Its population is estimated to have declined by 1.0% compared with 2020. The median age is 39.8 years, and there are approximately 94.4 males per 100 females. International migration added 95,634 residents during the reported period, providing an important source of population growth. However, migration patterns, domestic relocation and differences between metropolitan and upstate population trends create a more complex demographic picture.
New York City and its surrounding suburbs account for a substantial share of the state’s residents. The five boroughs form the country’s largest urban population concentration, supported by finance, media, technology, tourism, healthcare and international trade. Outside the metropolitan region, Buffalo, Rochester, Syracuse, Albany and other upstate cities serve as important regional centers. Upstate New York generally has lower population density and includes agricultural communities, smaller industrial cities and rural areas. The state’s large international population contributes to cultural diversity and workforce supply, while domestic migration losses and housing affordability remain important factors influencing its overall population trajectory.
9. Pennsylvania Population in 2027
Pennsylvania is projected to have 13.09 million residents in 2027, ranking fifth nationally. Its population is estimated to have increased by 0.6% since 2020. The median age is 41.4 years, and the state has approximately 96.1 males per 100 females. Natural population change is negative, with deaths exceeding births by 10,708 in the reported period. Net migration added 23,985 residents, more than offsetting the natural decrease and supporting a modest overall population increase.
Philadelphia and Pittsburgh anchor two major metropolitan regions, with additional population concentrations around Allentown, Harrisburg, Lancaster, Reading and Scranton. Eastern Pennsylvania has strong economic and commuting connections with New Jersey and the wider New York metropolitan region. Western Pennsylvania has a different settlement and industrial history, with Pittsburgh serving as a major center for healthcare, education, technology and advanced manufacturing. Agriculture, logistics, energy, financial services and healthcare are important across the state. Pennsylvania’s ageing population and relatively low natural growth make migration increasingly important for maintaining its workforce and supporting long term population stability.
Population by State in the Midwest Region
10. Illinois Population in 2027
Illinois is projected to have 12.75 million residents in 2027, ranking sixth among the 50 states. This represents an estimated population decline of 0.6% compared with 2020. Its median age is 39.7 years, and there are approximately 96.6 males per 100 females. International migration contributed 44,752 residents during the reported period, helping counterbalance other demographic pressures. The state’s population pattern is heavily influenced by the Chicago metropolitan region, which contains a large proportion of Illinois residents and provides extensive employment opportunities.
Chicago is the state’s largest city and an important national center for finance, transportation, manufacturing, healthcare, education and commerce. Its extensive rail, highway and airport networks support business activity across the Midwest. Other important population centers include Aurora, Rockford, Springfield, Peoria and Champaign. Downstate Illinois has a more dispersed settlement pattern, with many communities connected to agriculture, food processing, manufacturing and government employment. The contrast between metropolitan Chicago and smaller regional communities is an important feature of the state’s demographics. International migration remains a significant source of population growth, particularly in the Chicago area.
11. Indiana Population in 2027
Indiana is projected to have 7.05 million residents in 2027, making it the 17th most populous state. Its population is estimated to have increased by 3.9% since 2020. The median age is 38.6 years, and the sex ratio is approximately 97.2 males per 100 females. International migration contributed 17,852 additional residents during the reported period. Indiana’s relatively young population compared with several northeastern and Midwestern states provides a demographic foundation for its manufacturing workforce, expanding suburban communities and regional employment markets.
Indianapolis is the largest metropolitan area and the state’s primary center for government, healthcare, logistics, education and business services. Other important population centers include Fort Wayne, Evansville, South Bend, Bloomington and Lafayette. The northern part of Indiana benefits from manufacturing and transportation connections with the Chicago region, while central Indiana has experienced suburban development around Indianapolis. Manufacturing, automotive production, agriculture, life sciences and distribution are important economic activities. Population growth is distributed across metropolitan and smaller industrial communities, although rural counties generally have lower population densities and more limited access to large employment centers.
12. Michigan Population in 2027
Michigan is projected to have 10.18 million residents in 2027, ranking 10th nationally. Its population is estimated to have increased by 1.0% since 2020. The median age is 40.7 years, with approximately 97 males per 100 females. Natural population change is negative, with deaths exceeding births by 4,998 in the reported period. However, net migration contributed 32,502 residents, supporting an overall population increase and demonstrating the importance of migration in Michigan’s recent demographic performance.
Detroit remains the state’s largest urban center and a historic hub for automotive manufacturing and related industries. Grand Rapids is another major metropolitan area, supported by manufacturing, healthcare, education and business services. Other population centers include Lansing, Ann Arbor, Flint, Kalamazoo and Traverse City. Michigan’s two peninsulas have different settlement patterns, with the Lower Peninsula containing most residents and economic activity, while the Upper Peninsula is considerably less populated. The automotive industry continues to influence employment and regional development, alongside advanced manufacturing, battery production, healthcare, tourism and higher education. Ageing communities and the transition toward new manufacturing technologies are important long term demographic and economic considerations.
13. Ohio Population in 2027
Ohio is projected to have 11.98 million residents in 2027, making it the seventh most populous state. Its population is estimated to have grown by 1.5% since 2020. The median age is 40.1 years, and there are approximately 96.1 males per 100 females. Deaths exceeded births by 729 in the reported period, while net migration contributed 40,431 residents. This combination indicates that migration has become an important contributor to Ohio’s population stability and modest growth.
Columbus, Cleveland and Cincinnati form three major metropolitan centers, each with distinct economic and demographic characteristics. Columbus benefits from state government, education, healthcare, finance and technology employment. Cleveland has established strengths in healthcare, manufacturing and professional services, while Cincinnati is an important center for corporate headquarters, logistics and consumer industries. Other significant population centers include Toledo, Akron, Dayton and Youngstown. Ohio’s central location provides strong transportation connections to other Midwestern and northeastern markets. Although older industrial communities face population and economic restructuring challenges, expanding healthcare, logistics, advanced manufacturing and technology sectors support development in several metropolitan areas.
14. Wisconsin Population in 2027
Wisconsin is projected to have 6.00 million residents in 2027, ranking 21st nationally. The state is estimated to have grown by 1.9% since 2020. Its median age is 41.0 years, and there are approximately 99.1 males per 100 females. International migration added 7,260 residents during the reported period, contributing to population growth. Wisconsin combines established industrial cities, university communities, agricultural regions and smaller rural settlements, producing a population distribution that extends beyond its largest metropolitan areas.
Milwaukee is the state’s largest metropolitan center and an important hub for manufacturing, healthcare, finance and professional services. Madison, the state capital, benefits from government employment, the University of Wisconsin and a growing technology and research sector. Green Bay, Kenosha, Racine, Appleton and Eau Claire are other important population centers. Dairy production, food processing, machinery manufacturing, healthcare and tourism support employment throughout the state. Southern Wisconsin has strong economic connections with northern Illinois and the Chicago region, while northern counties are more rural and tourism oriented. The state’s relatively balanced sex ratio and established manufacturing base influence its workforce and household structure.
15. Iowa Population in 2027
Iowa is projected to have 3.25 million residents in 2027, making it the 32nd most populous state. Its population is estimated to have increased by 2.0% since 2020. The median age is 39.3 years, and the state has approximately 98.7 males per 100 females. International migration contributed 5,903 additional residents during the reported period. Iowa’s demographic profile reflects a combination of agricultural communities, expanding metropolitan areas, university towns and smaller industrial centers.
Des Moines is the largest metropolitan area and serves as a major center for insurance, finance, government, education and healthcare. Cedar Rapids and Iowa City form another important economic corridor, supported by manufacturing, research and higher education. Other population centers include Davenport, Sioux City, Waterloo and Ames. Agriculture remains central to Iowa’s economy, particularly corn, soybean and livestock production, alongside food processing and agricultural machinery manufacturing. Population is relatively dispersed across the state, although metropolitan areas have experienced stronger residential development. International migration and employment opportunities in food processing, manufacturing and healthcare contribute to demographic stability, while ageing rural communities remain an important challenge.
16. Kansas Population in 2027
Kansas is projected to have 3.00 million residents in 2027, ranking 34th among US states. Its population is estimated to have increased by 2.1% since 2020. The median age is 38.1 years, and there are approximately 99.4 males per 100 females. International migration contributed 7,440 residents during the reported period, providing an important source of demographic growth. The state’s population is concentrated in metropolitan areas in the east and around Wichita, while much of western Kansas consists of smaller agricultural communities.
Wichita is the largest city and a major center for aerospace manufacturing, aviation engineering, healthcare and business services. The Kansas City metropolitan area extends across the Kansas and Missouri border, supporting substantial population and economic activity in northeastern Kansas. Overland Park, Olathe, Topeka and Lawrence are other significant population centers. Agriculture, particularly wheat, corn, cattle and food processing, remains important throughout the state. Kansas also has a strong aviation and advanced manufacturing sector. Population distribution reflects the contrast between growing suburban communities in the east and more sparsely populated agricultural counties in the west. Employment opportunities and migration will remain important influences on future growth.
17. Minnesota Population in 2027
Minnesota is projected to have 5.90 million residents in 2027, placing it 22nd nationally. Its population is estimated to have increased by 3.3% since 2020. The median age is 39.4 years, and there are approximately 99.2 males per 100 females. International migration contributed 12,486 residents during the reported period. The state’s population growth is supported by its employment opportunities, educational institutions, healthcare infrastructure and established metropolitan economy.
Minneapolis and Saint Paul form the Twin Cities metropolitan region, which contains a substantial share of Minnesota’s population. The region is an important center for healthcare, retail, finance, manufacturing, technology and corporate headquarters. Rochester is another major population and employment center, particularly because of its internationally recognized medical sector. Duluth, St. Cloud, Mankato and Bloomington also contribute to the state’s urban and suburban population. Northern Minnesota has considerably lower population density, with communities connected to forestry, mining, tourism and outdoor recreation. Minnesota’s relatively balanced age and sex composition supports a broad workforce, while migration and metropolitan development remain important drivers of population change.
18. Missouri Population in 2027
Missouri is projected to have 6.33 million residents in 2027, ranking 18th among the 50 states. Its population is estimated to have increased by 2.8% since 2020. The median age is 39.6 years, and there are approximately 96.3 males per 100 females. Domestic migration contributed 14,028 residents during the reported period, making relocation from other parts of the United States an important source of growth. Missouri’s population is distributed across two major metropolitan regions and several smaller cities.
Kansas City and St. Louis are the state’s principal metropolitan centers, although both extend into neighboring states. Kansas City is an important center for transportation, logistics, agriculture related commerce, technology and professional services. St. Louis has established strengths in healthcare, biotechnology, manufacturing and financial services. Other population centers include Springfield, Columbia, Independence and Jefferson City. The central and northern parts of Missouri contain extensive agricultural communities, while the southern Ozarks have a more rural settlement pattern and a strong tourism economy. Domestic migration, metropolitan employment and the availability of relatively affordable housing contribute to Missouri’s demographic development.
19. Nebraska Population in 2027
Nebraska is projected to have 2.04 million residents in 2027, placing it 38th nationally. Its population is estimated to have increased by 4.1% since 2020. The median age is 37.5 years, and there are approximately 99.5 males per 100 females. International migration added 6,599 residents during the reported period, contributing to growth in a state where agricultural and industrial employment supports several regional communities. Nebraska’s relatively young median age compared with many northeastern states reflects its different demographic and economic structure.
Omaha is the largest metropolitan center and an important hub for finance, insurance, transportation, healthcare and corporate services. Lincoln, the state capital, benefits from government employment, higher education and technology related activities. Other population centers include Grand Island, Kearney and Bellevue. Agriculture is a major part of Nebraska’s economy, particularly cattle production, corn, soybeans and food processing. The eastern part of the state contains most of its population, while western Nebraska is more sparsely populated and dominated by agricultural land and smaller communities. International migration supports the workforce in agriculture, food processing, manufacturing and service industries.
20. North Dakota Population in 2027
North Dakota is projected to have 811,000 residents in 2027, ranking 47th among US states. Its population is estimated to have increased by 4.1% since 2020. The median age is 36.5 years, making it one of the younger state populations, and there are approximately 104.9 males per 100 females. International migration contributed 2,810 residents during the reported period. Its relatively small population, resource based economy and extensive rural territory produce a distinctive demographic pattern compared with more urbanized states.
Fargo is the largest city and a major center for healthcare, education, technology, manufacturing and regional commerce. Bismarck, the state capital, is another important population and employment center, while Grand Forks and Minot support additional regional activity. North Dakota’s energy sector, particularly oil and natural gas production in the western part of the state, has influenced employment and migration patterns. Agriculture, including wheat, corn, soybeans and livestock, remains a major economic activity. Population density is low across much of the state, with residents concentrated around a limited number of cities. Energy investment, workforce demand and migration will continue to influence future population development.
21. South Dakota Population in 2027
South Dakota is projected to have 951,000 residents in 2027, ranking 46th nationally. Its population is estimated to have grown by 7.3% since 2020, representing one of the stronger increases among the Midwestern states. The median age is 38.4 years, and there are approximately 101.5 males per 100 females. International migration contributed 3,183 residents during the reported period. Population growth is concentrated around expanding metropolitan areas, while much of the state continues to have a rural settlement pattern.
Sioux Falls is the largest city and the state’s principal center for finance, healthcare, retail, education and business services. Rapid City is another important population center, serving western South Dakota and communities connected to tourism and regional commerce. Other communities include Aberdeen, Brookings and Watertown. Agriculture remains central to the state’s economy, particularly cattle, corn, soybeans and related food processing. The Black Hills region attracts visitors and supports tourism, hospitality and outdoor recreation employment. South Dakota’s relatively low population density and growing metropolitan communities create a contrast between urban expansion and rural demographic stability. Migration and employment opportunities are important factors supporting its population growth.
Population by State in the South Region
22. Delaware Population in 2027
Delaware is projected to have 1.08 million residents in 2027, making it the 45th most populous state. Its population is estimated to have increased by 9.1% since 2020, indicating relatively strong growth for a small state. The median age is 42.3 years, and there are approximately 93.6 males per 100 females. Natural population change was negative, with deaths exceeding births by 554 in the reported period. However, net migration added 10,328 residents, providing the main contribution to population growth.
Wilmington is Delaware’s largest city and an important center for financial services, banking, corporate administration and professional employment. Dover, the state capital, is another major population center, while Newark benefits from the presence of the University of Delaware. Sussex County has attracted residential development, particularly around coastal communities such as Rehoboth Beach and its surrounding areas. Delaware’s location between major northeastern metropolitan markets makes it attractive to households seeking access to employment in Philadelphia, Baltimore and Washington. Financial services, healthcare, logistics, education and tourism are important economic sectors. Migration and suburban expansion will remain central influences on the state’s population distribution.
23. Florida Population in 2027
Florida is projected to have 23.86 million residents in 2027, ranking third among the 50 states. Its population is estimated to have grown by 10.8% since 2020. The median age is 43.1 years, and there are approximately 95.7 males per 100 females. Natural population change was negative, with deaths exceeding births by 1,333 in the reported period. Net migration added 201,191 residents, demonstrating the major role of relocation in Florida’s population expansion.
Miami, Orlando, Tampa and Jacksonville are among the state’s largest metropolitan centers. South Florida is an important international business and cultural region, while Orlando has a strong tourism, entertainment and hospitality economy. Tampa Bay combines healthcare, finance, technology and port related employment, and Jacksonville is a major transportation and logistics center. Florida’s warm climate, retirement communities, expanding employment markets and domestic migration appeal contribute to its population growth. Its ageing population creates substantial demand for healthcare, housing and retirement services. At the same time, rapid metropolitan expansion places pressure on transport infrastructure, water resources, housing supply and coastal development.
24. Georgia Population in 2027
Georgia is projected to have 11.50 million residents in 2027, making it the eighth most populous state. Its population is estimated to have increased by 7.4% since 2020. The median age is 38.2 years, and there are approximately 94.7 males per 100 females. International migration contributed 42,579 additional residents during the reported period. Georgia’s population growth reflects the combined influence of metropolitan expansion, employment opportunities, migration and its position as an important economic center in the southeastern United States.
Metropolitan Atlanta contains a large proportion of Georgia’s residents and is the state’s principal economic and transportation hub. The region has major employment concentrations in logistics, finance, technology, film production, healthcare and professional services. Savannah is another important center, supported by its seaport, tourism and manufacturing industries. Augusta, Columbus, Macon and Athens contribute to the state’s regional population distribution. Georgia’s agricultural economy remains important outside the major cities, with poultry, timber, cotton and food processing among its established activities. Suburban development around Atlanta has expanded the state’s residential footprint, while international migration continues to support workforce growth and cultural diversity.
25. Maryland Population in 2027
Maryland is projected to have 6.31 million residents in 2027, ranking 19th nationally. Its population is estimated to have increased by 2.0% since 2020. The median age is 39.8 years, and there are approximately 94 males per 100 females. International migration contributed 20,503 residents during the reported period, supporting population growth despite relatively modest overall expansion. Maryland’s demographic structure is strongly influenced by its proximity to Washington, D.C., the Baltimore metropolitan area and major federal employment centers.
Baltimore is the state’s largest city and a major center for healthcare, education, shipping, biotechnology and professional services. The counties surrounding Washington, particularly Montgomery and Prince George’s, contain substantial residential populations and employment connected to federal agencies, technology and defense contracting. Annapolis, Frederick, Rockville and Columbia are other important population centers. Maryland’s relatively compact territory contains densely populated urban and suburban communities as well as agricultural areas on the Eastern Shore and in western counties. Its strong concentration of government, healthcare and research employment supports international migration and skilled worker settlement, while housing affordability and commuting patterns influence regional population distribution.
26. North Carolina Population in 2027
North Carolina is projected to have 11.50 million residents in 2027, ranking ninth among the 50 states. Its population is estimated to have increased by 10.1% since 2020, reflecting strong demographic expansion. The median age is 39.5 years, and there are approximately 94.7 males per 100 females. Domestic migration contributed 84,064 residents during the reported period, making relocation from other states a major source of growth. The state’s expanding employment markets and relatively diverse metropolitan economy have supported its attractiveness to new residents.
Charlotte and Raleigh are the principal metropolitan growth centers. Charlotte is a major financial services and banking hub, while Raleigh benefits from technology, higher education, government and research employment. Durham and Chapel Hill form part of the Research Triangle, an important center for biotechnology, medicine and scientific research. Greensboro, Winston Salem, Asheville and Wilmington are additional population centers. North Carolina also has a significant agricultural economy, with poultry, tobacco, pork and crop production supporting rural communities. The combination of domestic migration, metropolitan expansion and university based employment has strengthened population growth, although housing availability, transport infrastructure and regional development differences remain important challenges.
27. South Carolina Population in 2027
South Carolina is projected to have 5.73 million residents in 2027, placing it 23rd nationally. Its population is estimated to have increased by 12.0% since 2020, making it one of the fastest growing states by percentage. The median age is 41.1 years, and there are approximately 94.1 males per 100 females. Domestic migration added 66,622 residents during the reported period, demonstrating the importance of people relocating from other states. Coastal communities and expanding metropolitan areas have been major destinations for new residents.
Charleston, Columbia and Greenville are the state’s principal metropolitan centers. Charleston benefits from tourism, shipping, healthcare and aerospace manufacturing, while Columbia is the state capital and a major center for government and education. Greenville has developed a strong manufacturing and advanced industrial economy, including automotive related production. Myrtle Beach and surrounding coastal communities have also experienced residential and tourism development. Manufacturing, logistics, agriculture, hospitality and healthcare are important economic sectors. South Carolina’s relatively attractive housing markets and expanding employment opportunities have supported domestic migration. However, rapid population growth also increases pressure on roads, public services, housing supply and coastal infrastructure.
28. Virginia Population in 2027
Virginia is projected to have 9.00 million residents in 2027, making it the 12th most populous state. Its population is estimated to have increased by 4.3% since 2020. The median age is 39.4 years, and there are approximately 96.8 males per 100 females. International migration contributed 40,436 residents during the reported period. Population growth is influenced by federal employment, defense related industries, technology businesses, university communities and the state’s connections to the Washington metropolitan region.
Northern Virginia contains a substantial share of the state’s population and benefits from proximity to Washington, D.C. It has major employment concentrations in information technology, cybersecurity, government contracting, finance and professional services. Richmond serves as the state capital and a center for finance, healthcare and education. Virginia Beach, Norfolk and Chesapeake form a major coastal metropolitan area with important military, port and tourism activities. Roanoke, Lynchburg and Charlottesville are other significant population centers. The western part of Virginia has a more rural and mountainous settlement pattern. Employment diversity and international migration support population growth, while differences between northern metropolitan counties and rural regions shape the state’s demographic outlook.
29. West Virginia Population in 2027
West Virginia is projected to have 1.76 million residents in 2027, ranking 39th nationally. Its population is estimated to have declined by 1.7% since 2020. The median age is 43.2 years, and there are approximately 97.8 males per 100 females. The state lost 1,255 residents in the latest reported period, with natural population change contributing a decline of 7,887 people. Net migration added 6,652 residents, partially offsetting the natural decrease but not fully reversing the overall loss.
Charleston is the state capital and a major center for government, healthcare and regional commerce. Morgantown benefits from West Virginia University, healthcare, research and education related employment. Huntington, Parkersburg and Wheeling are other important population centers. Much of West Virginia consists of mountainous terrain and small communities, producing a relatively dispersed population pattern. Historically important industries include coal mining, natural gas, chemicals, manufacturing and forestry. The state’s high median age and persistent natural decrease indicate a long term demographic challenge. Retaining younger residents, attracting new workers and diversifying employment opportunities are important factors for improving population stability.
30. Alabama Population in 2027
Alabama is projected to have 5.25 million residents in 2027, ranking 24th among US states. Its population is estimated to have increased by 4.5% since 2020. The median age is 39.8 years, and there are approximately 93.6 males per 100 females. Natural population change was negative, with deaths exceeding births by 2,188 in the reported period. Net migration added 32,304 residents, offsetting the natural decrease and supporting an overall increase in the state’s population.
Birmingham is Alabama’s largest metropolitan center and a major hub for healthcare, finance, education and professional services. Huntsville has experienced substantial economic development through aerospace, defense, engineering and advanced technology industries. Montgomery, the state capital, is another important center for government, manufacturing and education. Mobile contributes through shipping, port operations, aerospace and industrial employment. Manufacturing, automotive production, agriculture, steel and food processing remain important economic activities. The state’s metropolitan growth is supported by employment opportunities and migration, while rural communities face different demographic pressures, including ageing populations and limited access to major employment centers.
31. Kentucky Population in 2027
Kentucky is projected to have 4.65 million residents in 2027, making it the 25th most populous state. Its population is estimated to have increased by 3.3% since 2020. The median age is 39.5 years, and there are approximately 97 males per 100 females. Deaths exceeded births by 83 in the reported period, indicating an almost balanced natural population change. Net migration added 22,978 residents, providing the main contribution to population growth and helping offset the state’s demographic ageing pressures.
Louisville is the largest metropolitan area and an important center for logistics, healthcare, manufacturing, finance and transportation. Lexington is another major population center, supported by higher education, healthcare, horse breeding and agricultural industries. Bowling Green, Owensboro, Covington and Richmond contribute to the state’s regional population distribution. Kentucky’s economy includes automotive manufacturing, bourbon production, agriculture, food processing and logistics. The Bluegrass region has a relatively concentrated settlement pattern, while eastern Kentucky contains mountainous communities with lower population density. Migration into metropolitan areas and employment centers has become increasingly important as natural population growth slows.
32. Mississippi Population in 2027
Mississippi is projected to have 2.96 million residents in 2027, ranking 35th nationally. Its population is estimated to have remained almost unchanged since 2020, with a reported increase of approximately 0.0%. The median age is 39.6 years, and there are approximately 93.9 males per 100 females. Natural population change was negative, with deaths exceeding births by 2,607 in the reported period. Net migration contributed 6,534 residents, helping offset the natural decrease and maintain overall population stability.
Jackson is the state’s largest urban center and an important location for government, healthcare, education and business services. The Gulf Coast, including Gulfport and Biloxi, is another major population and economic region, supported by tourism, shipping, hospitality and military related activity. Hattiesburg, Southaven and Tupelo are additional population centers. Agriculture, forestry, manufacturing, food processing and energy contribute to the state’s economy. Northern Mississippi has economic connections with the Memphis metropolitan area, while central and southern communities have different industrial and settlement patterns. The combination of natural population decline and migration gains makes future population stability an important demographic issue.
33. Tennessee Population in 2027
Tennessee is projected to have 7.44 million residents in 2027, ranking 15th among the 50 states. Its population is estimated to have increased by 7.7% since 2020. The median age is 39.2 years, and there are approximately 95.3 males per 100 females. Domestic migration contributed 42,389 residents during the reported period, reflecting the state’s ability to attract households from other parts of the country. Employment opportunities, metropolitan development and relatively diverse regional economies support its population growth.
Nashville is a major center for healthcare, music, entertainment, finance and professional services. Memphis is an important logistics and distribution hub because of its transport networks and major cargo operations. Knoxville and Chattanooga provide additional employment centers, supported by education, manufacturing, energy and technology. The state also has strong automotive manufacturing and industrial activity, particularly in its eastern and central regions. Tourism and outdoor recreation support communities across the Appalachian and Great Smoky Mountains areas. Domestic migration has strengthened metropolitan growth, although rising housing demand, transport congestion and differences between urban and rural communities remain significant planning considerations.
34. Arkansas Population in 2027
Arkansas is projected to have 3.15 million residents in 2027, ranking 33rd nationally. Its population is estimated to have increased by 4.7% since 2020. The median age is 39.0 years, and there are approximately 96.4 males per 100 females. Natural population change was negative, with deaths exceeding births by 1,224 in the reported period. Net migration added 19,945 residents, more than offsetting the natural decrease and contributing to the state’s overall population expansion.
Little Rock is the largest metropolitan center and serves as the principal location for government, healthcare, finance and education. Northwest Arkansas, including Bentonville, Fayetteville, Springdale and Rogers, has become an important economic and population growth region. Major corporate operations, retail, logistics, education and manufacturing have contributed to development in this area. Agriculture remains important across the state, particularly poultry, rice, soybeans and livestock production. Fort Smith, Jonesboro and Conway are other regional population centers. The contrast between the rapidly developing northwest and smaller rural communities is an important feature of Arkansas’s demographic pattern. Migration and employment growth are likely to remain major influences on population change.
35. Louisiana Population in 2027
Louisiana is projected to have 4.62 million residents in 2027, ranking 26th among US states. Its population is estimated to have declined by 0.7% since 2020. The median age is 39.0 years, and there are approximately 95.4 males per 100 females. International migration contributed 14,900 residents during the reported period, helping support the population despite broader demographic challenges. Its population distribution is shaped by the Mississippi River corridor, coastal settlements and several major metropolitan areas.
New Orleans is an internationally recognized cultural and tourism center, with important employment in hospitality, shipping, healthcare and education. Baton Rouge serves as the state capital and a major industrial and petrochemical center. Shreveport is an important regional hub in northwestern Louisiana. Other population centers include Lafayette, Lake Charles and Monroe. The state’s economy is closely connected to energy production, refining, chemicals, maritime transportation, agriculture and tourism. Coastal erosion, hurricane exposure and flooding are important factors affecting settlement patterns and residential decisions. International migration contributes to demographic stability, while domestic migration and natural population change remain significant influences on future growth.
36. Oklahoma Population in 2027
Oklahoma is projected to have 4.17 million residents in 2027, making it the 28th most populous state. Its population is estimated to have increased by 5.4% since 2020. The median age is 37.7 years, and there are approximately 98.2 males per 100 females. Domestic migration contributed 14,492 residents during the reported period, supporting the state’s overall population expansion. Its relatively young median age and employment opportunities in metropolitan areas contribute to its demographic profile.
Oklahoma City is the largest metropolitan area and an important center for government, energy, healthcare, aerospace and professional services. Tulsa is another major economic center, with established strengths in energy, aviation, manufacturing and technology. Norman, Edmond, Broken Arrow and Lawton are other important population centers. Oil and natural gas production have historically influenced Oklahoma’s economic and settlement patterns, while agriculture, livestock, food processing and aerospace manufacturing remain important industries. The eastern part of the state includes more forested and rural communities, whereas central and western areas have extensive agricultural and urban settlements. Domestic migration and metropolitan employment growth are important contributors to population change.
37. Texas Population in 2027
Texas is projected to have 32.51 million residents in 2027, making it the second most populous state after California. Its population is estimated to have increased by 11.5% since 2020. The median age is 36.0 years, making it one of the younger state populations, and there are approximately 98.7 males per 100 females. International migration contributed 167,475 residents during the reported period, while the state also benefits from domestic migration and natural population growth.
Houston, Dallas Fort Worth, Austin and San Antonio form four major metropolitan centers, each with a large and diverse employment base. Houston is an international center for energy, healthcare, shipping and engineering. Dallas Fort Worth has extensive finance, logistics, technology, aviation and corporate employment. Austin benefits from technology, government, education and research, while San Antonio has major healthcare, tourism and military related industries. Other important population centers include El Paso, Fort Worth, Arlington and Corpus Christi. Texas’s large land area supports a wide range of settlement patterns, from dense metropolitan corridors to rural agricultural and energy producing regions. Strong migration, employment expansion and natural increase continue to influence its population trajectory.
Population by State in the West Region
38. Arizona Population in 2027
Arizona is projected to have 7.76 million residents in 2027, ranking 14th nationally. Its population is estimated to have increased by 8.4% since 2020. The median age is 39.4 years, and there are approximately 98.8 males per 100 females. Domestic migration contributed 31,107 residents during the reported period, making relocation from other states an important source of population growth. The state’s climate, employment markets and expanding metropolitan communities have influenced its residential development.
Phoenix is the largest metropolitan area and contains a substantial share of Arizona’s population. Its economy includes technology, semiconductor manufacturing, finance, healthcare, construction and professional services. Tucson is another important population center, supported by education, aerospace, defense, healthcare and research. Mesa, Chandler, Scottsdale, Glendale and Gilbert are major suburban communities within the Phoenix region. Arizona’s population is heavily concentrated in the central and southern parts of the state, while northern areas are much less densely populated. Water availability, extreme heat, housing construction and infrastructure capacity are important long term considerations as metropolitan growth continues.
39. Colorado Population in 2027
Colorado is projected to have 6.06 million residents in 2027, making it the 20th most populous state. Its population is estimated to have increased by 4.9% since 2020. The median age is 38.0 years, and there are approximately 101.4 males per 100 females. Natural population increase contributed 20,608 residents during the reported period, making births exceeding deaths an important source of demographic growth. Colorado’s population is concentrated primarily along the eastern side of the Rocky Mountains.
Denver is the largest metropolitan center and a major hub for finance, technology, healthcare, education, transportation and professional services. Colorado Springs has significant military, defense and aerospace employment, while Fort Collins benefits from higher education, research and technology. Boulder, Aurora, Lakewood and Greeley are other important population centers. The Front Range urban corridor contains most of the state’s residents, whereas the mountainous western areas have smaller communities and tourism oriented economies. Colorado’s relatively young median age and natural population increase support workforce development. However, housing affordability, water availability, transport infrastructure and the geographic limitations of mountain development are important factors influencing future settlement patterns.
40. Idaho Population in 2027
Idaho is projected to have 2.09 million residents in 2027, ranking 37th among US states. Its population is estimated to have increased by 13.6% since 2020, representing one of the strongest growth rates nationally. The median age is 37.9 years, and there are approximately 100.6 males per 100 females. Domestic migration contributed 19,915 residents during the reported period, highlighting the state’s attractiveness to people relocating from other parts of the country.
Boise is the principal metropolitan center and a major location for technology, government, healthcare, education and business services. Meridian, Nampa and Caldwell have experienced residential and suburban development as the Boise metropolitan area has expanded. Other important population centers include Idaho Falls, Coeur d’Alene, Pocatello and Twin Falls. Agriculture, food processing, semiconductor manufacturing, tourism and outdoor recreation contribute to the state’s economy. Southern Idaho contains much of the population and agricultural activity, while northern Idaho has smaller urban communities and a greater dependence on tourism and natural resources. Strong domestic migration has increased demand for housing, roads, utilities and public services.
41. Montana Population in 2027
Montana is projected to have 1.16 million residents in 2027, placing it 43rd nationally. Its population is estimated to have increased by 6.9% since 2020. The median age is 41.2 years, and there are approximately 101.2 males per 100 females. Natural population change was slightly negative, with deaths exceeding births by 90 in the reported period. Net migration added 7,247 residents, more than offsetting the natural decrease and supporting overall population growth.
Billings is the state’s largest city and a major center for healthcare, retail, transportation, energy and regional commerce. Missoula benefits from higher education, healthcare, research and tourism, while Bozeman has experienced growth associated with technology, education and outdoor recreation. Great Falls, Helena and Kalispell are other important population centers. Montana’s economy includes agriculture, cattle ranching, mining, energy production, forestry and tourism. Its mountainous western counties attract new residents and visitors, while eastern communities are more closely connected to agriculture and resource industries. Migration has become particularly important to population growth, although housing costs in popular communities and limited infrastructure create development pressures.
42. Nevada Population in 2027
Nevada is projected to have 3.34 million residents in 2027, ranking 31st among the 50 states. Its population is estimated to have increased by 7.5% since 2020. The median age is 39.6 years, and there are approximately 100.7 males per 100 females. Domestic migration contributed 14,914 residents during the reported period, supporting the state’s overall population growth. Its demographic development is strongly influenced by metropolitan expansion in the southern and western parts of the state.
Las Vegas is the largest metropolitan area and a major international center for tourism, hospitality, entertainment, conventions and gaming related employment. Henderson and North Las Vegas are important parts of the wider metropolitan population. Reno is another major population center, supported by technology, logistics, manufacturing, education and tourism. Carson City, the state capital, also contributes to regional population activity. Nevada has extensive desert territory, meaning that most residents are concentrated in a small number of urban areas. Tourism and service industries remain important, while advanced manufacturing and distribution have diversified the economy. Water availability, housing development and extreme temperatures are major considerations for future population growth.
43. New Mexico Population in 2027
New Mexico is projected to have 2.12 million residents in 2027, making it the 36th most populous state. Its population is estimated to have increased by 0.3% since 2020, indicating relatively limited growth. The median age is 40.1 years, and there are approximately 98 males per 100 females. The state lost 1,276 residents in the latest reported period, with natural population change contributing a decrease of 1,885 people. Net migration added 612 residents, partially offsetting the natural decline.
Albuquerque is the largest city and the principal metropolitan center, supported by healthcare, education, technology, research and government employment. Santa Fe is the state capital and an important center for government, tourism, arts and cultural industries. Las Cruces, Rio Rancho and Farmington are other important population centers. New Mexico’s economy includes energy production, federal research facilities, agriculture, tourism, military activity and public sector employment. Its population is concentrated mainly along the Rio Grande corridor, while extensive desert and mountainous areas have relatively low population density. Natural population decrease and limited migration gains present challenges for long term demographic expansion.
44. Utah Population in 2027
Utah is projected to have 3.61 million residents in 2027, ranking 30th nationally. Its population is estimated to have increased by 10.4% since 2020. The median age is 32.6 years, making it one of the youngest state populations, and there are approximately 101.4 males per 100 females. Natural population increase contributed 24,961 residents during the reported period. A comparatively young age structure and relatively high birth contribution are important characteristics of Utah’s demographic profile.
Salt Lake City is the state’s largest metropolitan center and an important hub for finance, technology, healthcare, education and transportation. Provo and Orem form another significant urban region, supported by higher education, technology and business services. Ogden, West Jordan, St. George and Lehi are additional population centers. Most residents live along the Wasatch Front, a narrow urban corridor between the Great Salt Lake and the Wasatch Mountains. Utah’s young population supports natural increase and workforce development, while employment growth attracts additional residents. Housing affordability, water availability and limited developable land along the Wasatch Front are increasingly important considerations for future population distribution.
45. Wyoming Population in 2027
Wyoming is projected to have approximately 593,000 residents in 2027, making it the least populous state in the country. Its population is estimated to have increased by 2.8% since 2020. The median age is 40.2 years, and there are approximately 103.9 males per 100 females. Domestic migration contributed 1,474 residents during the reported period, supporting modest population growth. Wyoming’s relatively small population is distributed across a large geographical area, resulting in one of the lowest population densities in the United States.
Cheyenne is the state capital and an important center for government, transportation and regional commerce. Casper is another major population center, with employment connected to energy, healthcare and business services. Other communities include Gillette, Laramie, Rock Springs and Sheridan. Energy production, particularly coal, natural gas and oil, plays a significant role in the state’s economy. Agriculture, cattle ranching, tourism and outdoor recreation also support employment. Yellowstone National Park and Grand Teton National Park attract visitors and contribute to the tourism economy. Population concentration remains limited to a relatively small number of towns, making migration and resource related employment important influences on demographic change.
46. Alaska Population in 2027
Alaska is projected to have approximately 739,000 residents in 2027, ranking 48th nationally. Its population is estimated to have increased by 0.8% since 2020. The median age is 36.7 years, and there are approximately 109.2 males per 100 females, the highest male to female ratio among the states in the supplied estimates. Natural population increase contributed 3,308 residents during the reported period. Its relatively young population and distinctive settlement geography influence the state’s demographic structure.
Anchorage contains the largest concentration of Alaska’s population and serves as the state’s main commercial, transportation, healthcare and employment center. Fairbanks is another important regional hub, supported by education, military activity, research and resource industries. Juneau, the state capital, is an important government and tourism center. Much of Alaska’s territory has very low population density, with numerous remote communities that depend on air, sea and limited road transportation. Oil and gas, fishing, mining, military employment, tourism and public services are important economic sectors. Harsh climate conditions, geographical isolation and the cost of infrastructure influence residential patterns and future population growth.
47. California Population in 2027
California is projected to have 39.34 million residents in 2027, retaining its position as the most populous state in the United States. Its population is estimated to have declined by 0.6% since 2020. The median age is 38.7 years, and there are approximately 98.9 males per 100 females. The state lost 9,465 residents in the latest reported period, despite natural population increase of 109,715. Net migration was negative by 119,799, demonstrating how population movement can offset growth from births exceeding deaths.
Los Angeles, San Francisco, San Diego and Sacramento anchor the state’s major metropolitan regions. Los Angeles has extensive entertainment, international trade, manufacturing and professional services industries. The San Francisco Bay Area is a major global center for technology, finance and research, while San Diego has important biotechnology, defense and healthcare sectors. Sacramento serves as the state capital and a major center for government and healthcare. California’s Central Valley contains important agricultural communities, while coastal metropolitan areas have much higher population densities. Housing affordability, domestic migration losses, international migration and regional employment differences are central factors shaping the state’s population trajectory.
48. Hawaii Population in 2027
Hawaii is projected to have approximately 1.43 million residents in 2027, ranking 40th among the 50 states. Its population is estimated to have declined by 1.8% since 2020. The median age is 42.1 years, and there are approximately 100.6 males per 100 females. The state lost 2,132 residents in the latest reported period, despite natural population increase of 2,024. Net migration was negative by 4,108, making population outflows the principal contributor to the decline.
Honolulu and the island of Oahu contain the largest concentration of residents, employment and public services. The state capital is an important center for government, tourism, education, healthcare and military activity. Other population centers include Hilo and Kailua Kona on the Big Island, Kahului on Maui and Lihue on Kauai. Hawaii’s island geography limits the amount of land available for urban expansion and creates distinct settlement patterns across the islands. Tourism is a major economic sector, alongside military employment, education, agriculture and services. High housing costs, geographic isolation and limited employment alternatives can influence domestic migration, while natural increase continues to support the resident population.
49. Oregon Population in 2027
Oregon is projected to have 4.29 million residents in 2027, making it the 27th most populous state. Its population is estimated to have increased by 1.2% since 2020. The median age is 41.1 years, and there are approximately 98.3 males per 100 females. Natural population change was negative, with deaths exceeding births by 3,764 in the reported period. Net migration added 11,864 residents, more than offsetting the natural decrease and supporting modest population growth.
Portland is the state’s largest metropolitan area and a major center for technology, manufacturing, transportation, healthcare and professional services. Salem is the state capital, while Eugene has significant education, research and healthcare employment. Bend has also become an important regional center, supported by tourism, outdoor recreation and service industries. Oregon’s population is concentrated mainly in the Willamette Valley, where Portland, Salem and Eugene form a connected urban corridor. Eastern and southern Oregon have much lower population densities and greater dependence on agriculture, forestry, energy and resource related industries. Migration remains essential to population growth as the state experiences an ageing population and negative natural change.
50. Washington Population in 2027
Washington is projected to have 8.15 million residents in 2027, ranking 13th nationally. Its population is estimated to have increased by 5.7% since 2020. The median age is 38.8 years, and there are approximately 100.1 males per 100 females. International migration contributed 46,202 residents during the reported period, supporting population growth. The state’s demographic development is influenced by technology employment, international trade, higher education, manufacturing and its position along the Pacific coast.
Seattle is the largest metropolitan center and a major global hub for technology, aerospace, finance, retail and professional services. Spokane is an important regional center in eastern Washington, supported by healthcare, education, manufacturing and trade. Tacoma contributes through its port, logistics, military and industrial activities. Other important population centers include Bellevue, Everett, Vancouver and Olympia. The Puget Sound region contains a substantial share of Washington’s population, while eastern counties have more agricultural and rural settlement patterns. Technology and aerospace employment, international migration and metropolitan development support population growth. Housing affordability, transport congestion and differences between western and eastern Washington remain important demographic and infrastructure considerations.
Recommended Articles: USA Population & Governance Policies
- USA’s Changing Religious Landscape: Christians, Atheists and Other Faiths
- USA Population Growth Rate: The Demographic Shift Reshaping America’s Future
- USA Population by Race: Historical Trends, Current Data, and Future Projections
- USA vs China Population: The Demographic Battle Shaping the 21st Century
- US Population by Ethnicity: 1980 to 2060 Trends and Projections
- US Population by Age Group: When Will Seniors Outnumber Children?
- US Population Density by State: The Most and Least Crowded Areas
- US Life Expectancy by Year: A Century of Change and What the Future Holds
- US Male and Female Population by Year: Historical Data and 2060 Forecast
Data Sources and Methodology for 2027 State Population Figures
No agency has published official 2027 state population counts, and none could exist yet. Every 2027 figure in this article is a projection calculated by the editorial team from official estimates, and it should not be read as a Census count or an official Census Bureau projection.
The base is the U.S. Census Bureau’s Vintage 2025 Population Estimates, released on January 27, 2026, which cover July 1, 2025. The projection holds each state’s most recent annual growth rate, measured from July 1, 2024 to July 1, 2025, constant for two more years. The formula is P2027 = P2025 x (1 + r)^2, where r equals the 2024 to 2025 change divided by the July 2024 population. Results are rounded to the nearest 1,000.
This approach has limits. The 2024 to 2025 period saw a historic drop in net international migration, from about 2.7 million to about 1.3 million nationally, according to the Census Bureau, and the pace could change. The Census Bureau’s schedule places the next state estimates, covering July 1, 2026, in December 2026, so the figures should be refreshed when they appear.
Other indicators use the latest published data and carry their own reference periods, shown below. The male and female counts in the “Male and Female Population by State in 2027” table apply each state’s published sex ratio to its 2027 projected total.
| Indicator | Reference period | Source |
|---|---|---|
| Total population | July 1, 2025 estimate and July 1, 2027 projection | Census Bureau Vintage 2025, projection by this article |
| 2020 baseline | April 1, 2020 estimates base | Census Bureau Vintage 2025 |
| Sex ratio | Latest published Census-based state ratios (2026 compilation) | Census Bureau data compiled by DataPandas |
| Median age and age groups | July 1, 2025 | Census Bureau Vintage 2025 characteristics, released June 25, 2026 |
| Population density | 2027 projection divided by Census land area | Census Gazetteer land area (2026) |
| Race and Hispanic origin | April 1, 2020 | 2020 Census redistricting data |
| Urban and rural | April 1, 2020 | 2020 Census urban area definitions |
| Births, deaths, migration | July 1, 2024 to July 1, 2025 | Census Bureau Vintage 2025 components of change |
| Households and household size | 2024 | American Community Survey, compiled by World Population Review |
Population figures for 2027 represent estimates or projections rather than completed Census counts. Where 2027 demographic breakdowns are unavailable, the latest published official demographic data are identified separately. Figures may differ from subsequently released Census estimates and projections.
Additional Findings and Comparisons
Most and Least Populated States in America in 2027
10 states are projected to exceed 10 million residents in 2027, and 4 exceed 20 million: California, Texas, Florida and New York. 5 states are projected under one million: South Dakota, North Dakota, Alaska, Vermont and Wyoming. California, Texas and Florida combine for 95.7 million.
States With the Highest and Lowest Population Density
New Jersey (1,310), Rhode Island (1,086) and Massachusetts (921) lead the density ranking, and Alaska (1.3), Wyoming (6.1) and Montana (8.0) trail. Land area drives the ranking.
States With the Youngest and Oldest Populations
Utah (32.6), Texas (36.0) and North Dakota (36.5) have the lowest median ages, and Maine (44.9), Vermont (44.4) and New Hampshire (44.1) the highest. Utah has 26.1% of residents under 18 and 13.0% aged 65 and older, while Maine has 17.3% and 24.6%.
States With the Highest and Lowest Male to Female Ratios
Alaska (109.2), North Dakota (104.9) and Wyoming (103.9) have the most males per 100 females. Alabama and Delaware (both 93.6), Mississippi (93.9) and Maryland (94.0) have the fewest.
Biggest Population Gains and Losses Since 2020
Texas (+2,560,323), Florida (+1,924,311) and North Carolina (+756,576) added the most residents. Idaho (+10.4%), Florida, South Carolina, Texas, and Utah grew fastest in percentage terms. California (-200,394), New York (-201,269) and Illinois (-102,600) lost the most people.
What Do the 2027 US Population Statistics Reveal?
- Population is concentrated: The ten largest states hold 54.2% of the 50 state total, and California alone outweighs the 21 smallest states combined.
- Growth is concentrated in the South and the Mountain West: The South grew 6.0% from 2020 to 2025 against 0.7% in the Northeast, and Idaho, Utah and Nevada sit among the fastest growers.
- Density and growth are separate: New Jersey is the densest state yet grew 2.8% since 2020, while Idaho, with 25 people per square mile, grew 10.4%.
- Migration decides the ranking: In 17 states deaths exceeded births in 2025, and in several, such as Maine and New Hampshire, migration produced all of the growth.
- Aging varies sharply: Maine’s median age is 44.9 and Utah’s is 32.6, a gap of 12.3 years.
- Metropolitan states look different from rural ones: California, Nevada and New Jersey are more than 93% urban, while Vermont, Maine and West Virginia are under 45% urban.
- Growth creates pressure. Fast growing states face housing and infrastructure demand, and declining states face a smaller labor base.
- Rankings can change: Shifts in fertility, mortality or migration can move state rankings within a few years.
Recommended Articles: US Population by Years
- USA Population 2026: Current Population, Growth Rate, and Key Facts
- USA Population 2028: A Region-by-Region Tour & Key Trends
- USA Population 2027: 346 Million People and the Sun Belt Shift
- USA Population 2029: The Year Older Americans Outnumber Children
- USA Population 2030: The Census Year Briefing
Frequently Asked Questions About USA Population by State in 2027
What is the population of the USA in 2027?
No official count exists for 2027. The Census Bureau estimated 341,784,857 residents for July 1, 2025. Holding each state’s latest growth rate for two more years gives about 344,697,000 for the 50 states in July 2027, a projection by this article.
Which US state has the largest population in 2027?
California, at a projected 39,336,000, or about 11.4% of the 50 state total. Texas follows at 32,507,000.
Which US state has the smallest population in 2027?
Wyoming, at a projected 593,000.
What are the 10 most populated states in America?
1.. California (39.3 million), 2. Texas (32.5 million), 3. Florida (23.9 million), 4. New York (20.0 million), 5. Pennsylvania (13.1 million), 6. Illinois (12.8 million), 7. Ohio (12.0 million), 8. Georgia (11.5 million), 9. North Carolina (11.5 million), 10. Michigan (10.2 million).
Which state has the highest population density in the USA?
New Jersey, at about 1,310 people per square mile in 2027, ahead of Rhode Island (1,086) and Massachusetts (921).
Which US state has the lowest population density?
Alaska, at about 1.3 people per square mile. Its 571,409 square miles of land are far more than any other state.
Which US states have more females than males?
All but 11 states show more women than men. Alabama and Delaware have the highest female shares at about 51.7%, and Mississippi, Maryland and South Carolina are close.
Which US states are growing the fastest?
By percentage in 2024 to 2025, South Carolina, Idaho, North Carolina and Texas grew fastest. By number, Texas (391,243) and Florida (196,680) added the most residents. Since 2020, Idaho leads at +10.4%.
Which US states are losing population?
In 2024 to 2025, California, Hawaii, Vermont, New Mexico and West Virginia lost residents. Compared with the 2020 base, Hawaii, West Virginia, New York, Louisiana, Illinois, California and Mississippi are smaller.
How is the US population distributed across the four Census regions?
In 2027, the South is projected to hold 39.3% of the 50-state population, the West 23.4%, the Midwest 20.4% and the Northeast 16.9%.
Sources
- U.S. Census Bureau, Vintage 2025 Population Estimates, state totals (NST-EST2025-POP) and components of change (NST-EST2025-COMP), released January 27, 2026
- U.S. Census Bureau, “Populations in All Age Groups Growing in the South, Driven by Outlying Counties in Metro Areas,” press release CB26-105, June 25, 2026
- U.S. Census Bureau, “U.S. Population Growth Slows Due to Historic Decline in Net International Migration,” 2026
- U.S. Census Bureau, 2020 Census Redistricting Data (P.L. 94-171), Table P2
- U.S. Census Bureau, 2020 Census urban and rural classification
- U.S. Census Bureau 2026 Gazetteer land area and state populations, as compiled by SimpleMapLab:
- Median age and age group shares, Vintage 2025, as compiled by PopulationPyramids:
- State sex ratios, Census-based, compiled by DataPandas (September 2026)
- US Census Bureau: Vintage 2025 Population Estimates
- State Population by Age and Sex, 2020 to 2025
- State Population Totals and Components of Change
- Census Bureau: State Land Area Data