
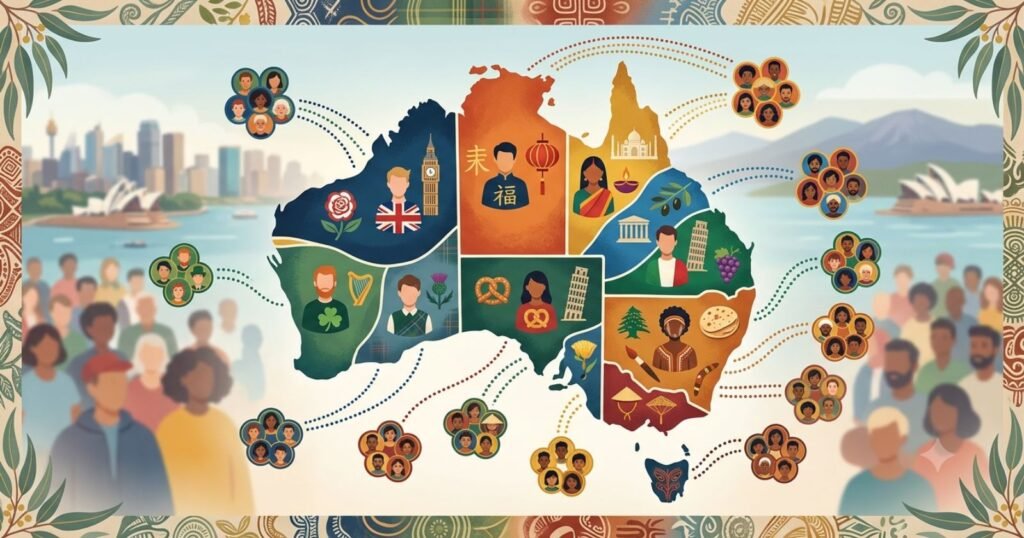
More than 270 ancestries were reported on the 2021 Census form, a number that says more about modern Australia than almost any other single statistic. English and Irish surnames still dominate the phone book, Australian identity itself now ranks as the second most common response, and Indian and Chinese ancestries are climbing the list faster than any group has in decades. This is the story of who Australians say their ancestors were, told through the numbers the Australian Bureau of Statistics collects every five years.
Australia’s Ancestry Map
At the 2021 Census, Australia’s usual resident population stood at 25,422,788. Because the Census allows each person to report up to two ancestries, the total number of ancestry responses runs well above that figure, closer to 27.6 million individual responses spread across the population.
The headline numbers:
- English ancestry: 8,385,928 people (33.0%)
- Australian ancestry: roughly 7.6 million people (29.9%)
- Irish ancestry: 2,410,833 people (9.5%)
- Scottish ancestry: 2,176,777 people (8.6%)
- Chinese ancestry: 1,390,637 people (5.5%)
- Italian ancestry: 1,108,364 people (4.4%)
- German ancestry: 1,026,138 people (approximately 4.0%)
- Indian-related ancestries combined: about 970,000 people (3.8%)
- Aboriginal and/or Torres Strait Islander peoples: 812,728 people (3.2%), measured through the Indigenous status question rather than ancestry alone
European ancestries together account for 57.2% of all responses, Oceanian ancestries (including Australian and Aboriginal) for 33.8%, and Asian ancestries for 17.4%. Those three broad groups overlap heavily since millions of people record one European and one Australian ancestry on the same form.
What Does Ancestry Actually Mean
Ancestry is frequently confused with ethnicity, nationality, citizenship, country of birth and Indigenous status, but the Census treats each as a separate concept with its own question.
| Concept | What it measures | Census question style |
|---|---|---|
| Ancestry | Cultural or ethnic origin, often traced through parents or grandparents | Self-reported, up to two responses |
| Ethnicity | A person’s own sense of cultural identity and belonging | Not directly collected in the Australian Census |
| Nationality/citizenship | Legal status and formal ties to a country | Separate citizenship question |
| Country of birth | Where a person was physically born | Separate country of birth question |
| Indigenous status | Whether a person identifies as Aboriginal and/or Torres Strait Islander | Separate mark-box question |
| Language used at home | The language spoken in a person’s household | Separate language question |
The Australian Bureau of Statistics deliberately kept ethnicity off the 2026 Census form. Immigration minister Andrew Giles had proposed adding a direct ethnicity question, but the ABS concluded in 2024 that the public does not share a consistent definition of ethnicity, and that collecting both ethnicity and ancestry on the same form risked confusing respondents rather than clarifying the data.
How the Australian Census Measures Ancestry
The ancestry question asks: “What is the person’s ancestry?” and allows respondents to select up to two options from a set of mark boxes, plus free-text fields for anything not listed. The 2021 mark-box options were English, Irish, Scottish, Chinese, Italian, German, Aboriginal, Torres Strait Islander and Australian, with the order based on how frequently each was reported in the previous Census. In 2021, Italian moved from third to fifth position and Chinese moved from sixth to fourth, reflecting real shifts in the population.
Written responses go through automatic and manual coding using the Australian Standard Classification of Cultural and Ethnic Groups. Where a person reports more than two ancestries, only the first two are processed and recorded as ANC1P and ANC2P in the data. The item non-response rate for the ancestry question fell to 6.2% in 2021 from 7.0% in 2016.
Because responses are self-assessed and limited to two per person, ancestry totals will always exceed the total population, and the data cannot capture the full complexity of mixed heritage beyond two categories. For the 2026 Census, the ABS is expanding the mark boxes to allow up to four ancestries, with dedicated Aboriginal and Torres Strait Islander boxes added specifically to reduce reliance on the generic “Australian” category among Indigenous respondents.
Australia’s Largest Ancestry Groups
| Rank | Ancestry | Population (2021) | Share of population |
|---|---|---|---|
| 1 | English | 8,385,928 | 33.0% |
| 2 | Australian | ~7,601,000 | 29.9% |
| 3 | Irish | 2,410,833 | 9.5% |
| 4 | Scottish | 2,176,777 | 8.6% |
| 5 | Chinese | 1,390,637 | 5.5% |
| 6 | Italian | 1,108,364 | 4.4% |
| 7 | German | 1,026,138 | 4.0% |
| 8 | Indian (core category) | 783,958 | 3.1% |
| 9 | Greek | 424,744 | 1.7% |
| 10 | Filipino | 408,836 | 1.6% |
| 11 | Dutch | 381,948 | 1.5% |
| 12 | Vietnamese | 334,781 | 1.3% |
Combined, the top five ancestries account for around 21.9 million responses, or roughly 86% of all ancestry responses recorded. Chinese ancestry stands out as the only group in the top five to grow between 2016 and 2021, a reflection of sustained migration from mainland China, Hong Kong, Malaysia and Singapore over the past two decades.
European Ancestries in Australia
European ancestries remain the largest single bloc in the country, totaling 17,127,441 responses. English ancestry alone accounts for nearly a third of all Australians, a legacy of nineteenth and early twentieth-century settlement patterns that still shapes surnames, place names and cultural institutions today.
The next tier of European ancestries tells a later migration story. Italian ancestry rose from around one million in 2016 to 1,108,364 in 2021, largely through natural increase among descendants of the post-war migration wave rather than fresh arrivals, since Italy is now one of the countries with the largest decrease in Australia’s overseas-born population. German ancestry sits close behind at just over one million. Greek, Dutch, Polish (209,281), Maltese (198,989) and Croatian (164,362) ancestries round out a European mosaic built almost entirely on twentieth-century settlement rather than recent arrivals.
Scottish and Irish ancestries occupy a distinct position. Both trace back to colonial-era migration, both remain far more common than the current Scotland-born or Ireland-born populations would suggest, and both are frequently reported alongside English or Australian ancestry on the same form.
Asian Ancestries
Asian ancestries reached 17.4% of all responses in 2021, split across Southern and Central Asia (6.5%), North-East Asia (6.4%) and South-East Asia (4.5%). This is the fastest-changing segment of Australia’s ancestry profile.
| Ancestry | Population (2021) | Share |
|---|---|---|
| Chinese | 1,390,637 | 5.5% |
| Indian | 783,958 | 3.1% |
| Filipino | 408,836 | 1.6% |
| Vietnamese | 334,781 | 1.3% |
| Sri Lankan/Sinhalese | 153,267 | 0.6% |
| Nepalese | 138,463 | 0.5% |
| Korean | 136,896 | 0.5% |
| Pakistani | 97,593 | 0.4% |
| Thai | 91,942 | 0.4% |
| Indonesian | 87,705 | 0.3% |
When related categories such as Punjabi, Sikh, Anglo-Indian and Fijian Indian are grouped with core Indian ancestry, the combined India-related population reaches close to 970,000, or 3.8% of Australia’s population. Among second-generation Australians with at least one India-born parent, the reported ancestry mix already looks noticeably different from their parents’ generation: 64.5% still report Indian ancestry, but 14.0% report Australian ancestry and 11.2% report English ancestry, a pattern that shows how quickly ancestry identification shifts across generations.
Middle Eastern and Other Ancestry Groups
Lebanese, Turkish, Iraqi, Iranian and Afghan ancestries form a smaller but historically significant part of Australia’s cultural landscape, concentrated heavily in Sydney and Melbourne and linked to distinct migration waves stretching from the late nineteenth century through to recent humanitarian intakes. Afghan ancestry alone reached 54,534 people in 2021. South American, African and Pacific Islander ancestries remain comparatively small in absolute terms but are among the fastest-growing categories on a percentage basis, reflecting newer and more diverse migration streams than Australia saw in the twentieth century.
Australia’s First Peoples
Aboriginal and Torres Strait Islander identity is measured separately from ancestry through the Census Indigenous status question, and it deserves treatment on its own terms rather than as one line item among immigrant ancestry groups. At the 2021 Census, 812,728 people, or 3.2% of the population, identified as Aboriginal and/or Torres Strait Islander through this question. Of that group, 742,882 identified as Aboriginal only, 33,765 as Torres Strait Islander only, and 36,083 as both.
The ancestry question tells a related but separate story. The number of people reporting Aboriginal ancestry rose from 144,000 in 2016 to 741,000 in 2021, a jump largely explained by a methodology change rather than a sudden shift in population, since Aboriginal and Torres Strait Islander became dedicated mark boxes on the ancestry question for the first time in 2021 rather than requiring a free-text response. Among people who identified as Aboriginal and/or Torres Strait Islander through the Indigenous status question, 89.1% also reported an Aboriginal and/or Torres Strait Islander ancestry, confirming that the two measures now align closely.
The Aboriginal and Torres Strait Islander population is also demographically younger than the national average, with a median age of 24 compared with the low-to-mid 30s for the total population, and fertility rates that have remained above replacement level even as the national rate has fallen.
Ancestry by State and Territory
Ancestry composition varies noticeably across states, shaped by where different migration waves settled historically and where more recent arrivals have concentrated.
| State/Territory | Notable ancestry pattern |
|---|---|
| Victoria | Higher Italian ancestry (5.9% versus 4.4% nationally); lower English (29.2%) and Australian (27.2%) shares; Aboriginal and/or Torres Strait Islander population lower at 1.0% |
| New South Wales | Largest overall Chinese and Indian ancestry populations in absolute terms, centered on Sydney |
| Queensland | Strong New Zealand-linked and Pacific ancestries, plus a growing South Asian population |
| Western Australia | High overseas-born share relative to population, with English, Italian and more recently South African and Indian ancestries prominent |
| South Australia | One of the strongest concentrations of Italian and Greek ancestry outside Victoria |
| Tasmania | Among the lowest shares of overseas-born residents and the strongest English and Scottish ancestry concentration |
| Australian Capital Territory | Above-average share of Asian ancestries linked to public service and university migration |
| Northern Territory | By far the highest Aboriginal and Torres Strait Islander share of any state or territory |
Ancestry and Country of Birth: Why the Numbers Differ
Ancestry and country of birth measure related but distinct things, and the gap between them is often the most misunderstood part of Australia’s cultural data. An Australian-born grandchild of Italian migrants reports Italian ancestry but Australian birthplace. An England-born migrant who has lived in Australia for decades may report Australian ancestry instead of English. Multiple ancestry responses further complicate any direct comparison, since a person born in India might record Indian and English ancestry on the same form.
The 2021 Census recorded 927,490 England-born residents, 673,352 India-born residents, 549,618 China-born residents, 530,492 New Zealand-born residents and 293,892 Philippines-born residents, the five largest overseas birthplaces. None of those figures match the corresponding ancestry counts, because ancestry counts include Australian-born descendants while country-of-birth counts do not, and because a share of each overseas-born group reports a different or additional ancestry.
How Australia’s Ancestry Profile Has Changed
The top five ancestries reported in 2021 were the same five reported in 2016: English, Australian, Irish, Scottish and Chinese, in the same order. What changed beneath that surface stability was the pace of growth further down the list. Chinese ancestry was the only member of the top five to increase between Censuses. Indian-born residents rose by 47.9%, the largest percentage increase in any country of birth. Nepal-born residents more than doubled, up 123.7%, concentrated heavily in New South Wales, Victoria and Queensland.
The share of the population born overseas rose from 26% in 2016 to 27.6% in 2021, and almost half of all Australians, 48.2%, now have at least one parent born overseas. More than a million people arrived in Australia between 2016 and 2021, with India accounting for roughly 230,000 of that intake, China around 137,000 and Nepal around 71,000.
Australia’s Future Ancestry Landscape
Three forces will continue reshaping Australia’s ancestry profile over the coming decades. Immigration remains the dominant driver, and current migration patterns favor South and Southeast Asian source countries far more heavily than the European-dominated intakes of the twentieth century.
Intermarriage and multiple ancestry reporting will keep blending categories together, particularly among second and third-generation Australians who increasingly report Australian ancestry alongside or instead of their parents’ origin. Generational transmission of ancestry identity is not automatic. As the second-generation Indian data shows, a meaningful share of children of migrants already shift toward reporting Australian or English ancestry rather than their parents’ ancestry alone.
The expanded 2026 Census ancestry question, allowing up to four responses instead of two, is likely to reveal more complexity in mixed heritage than the 2021 data can show, particularly among Aboriginal and Torres Strait Islander respondents who will now have dedicated mark boxes rather than a shared “Australian” default.
Limitations of Ancestry Data
Ancestry data has real boundaries that any careful reading needs to respect. It is self-assessed, meaning two people with identical family backgrounds can report different ancestries based on personal identity rather than any objective standard. It is capped at two responses in 2021, understating mixed heritage beyond two categories. It does not measure ethnicity, citizenship or Indigenous status, each of which is asked separately. And because ancestry can be reported based on parents, grandparents or a felt sense of heritage rather than birthplace, it will never align neatly with country-of-birth or migration statistics.
Key Findings
- Australia recorded more than 270 distinct ancestries at the 2021 Census, with English (33.0%), Australian (29.9%) and Irish (9.5%) as the three largest
- Chinese ancestry was the only top-five group to grow between 2016 and 2021, reaching 1,390,637 people
- Aboriginal and/or Torres Strait Islander peoples numbered 812,728, or 3.2% of the population, through the Indigenous status question
- European ancestries account for 57.2% of all responses; Asian ancestries have climbed to 17.4%
- India-born residents grew 47.9% between Censuses, the fastest increase of any birthplace
- Nearly half of all Australians, 48.2%, have at least one parent born overseas
- The 2026 Census will allow up to four ancestry responses instead of two, likely revealing more mixed-heritage complexity
Frequently Asked Questions
1. What is the most common ancestry in Australia?
English ancestry is the most commonly reported, at 33.0% of the population according to the 2021 Census, followed closely by Australian ancestry at 29.9%.
2. Is Australian a real ancestry category?
Yes. It is a Census mark-box option, and 29.9% of the population selected it in 2021, often alongside a second ancestry such as English or Irish.
3. Why do ancestry totals add up to more than the population?
Because each person can report up to two ancestries, so the sum of all ancestry responses exceeds the total number of people counted.
4. How is ancestry different from ethnicity in the Australian Census?
The Census collects ancestry, a self-reported cultural or family origin, but does not ask a separate ethnicity question, since the ABS found no consistent public definition of ethnicity to measure.
5. What is the fastest-growing ancestry group in Australia?
Chinese ancestry grew the most among the top five groups between 2016 and 2021, while Indian-related and Nepalese-linked ancestries grew fastest in percentage terms overall.
6. How many Aboriginal and Torres Strait Islander people live in Australia?
812,728 people identified as Aboriginal and/or Torres Strait Islander at the 2021 Census, representing 3.2% of the population.
7. Does country of birth equal ancestry?
No. Country of birth measures where someone was physically born, while ancestry measures self-reported cultural origin, which can span multiple generations and differ from birthplace entirely.
8. Which state has the highest Italian ancestry?
Victoria, where Italian ancestry reaches 5.9% of the population compared with 4.4% nationally.
9. Will the 2026 Census change how ancestry is measured?
Yes. Respondents will be able to report up to four ancestries instead of two, and Aboriginal and Torres Strait Islander will have dedicated mark boxes separate from the generic Australian category.
10. How many ancestries were reported in the 2021 Census overall?
More than 270 distinct ancestries were recorded, reflecting the scale of Australia’s cultural diversity.
Sources
- Australian Bureau of Statistics, Census of Population and Housing 2021, Cultural Diversity: Census
- Australian Bureau of Statistics, 2021 Census highlights increasing cultural diversity (media release)
- Australian Bureau of Statistics, 2021 Census QuickStats, Australia and Victoria
- Australian Bureau of Statistics, Aboriginal and Torres Strait Islander people: Census, 2021
- Australian Bureau of Statistics, 2026 Census ancestry variable documentation (ANC1P to ANC4P)
- profile.id, Ancestry community profile, Australia and Victoria





