
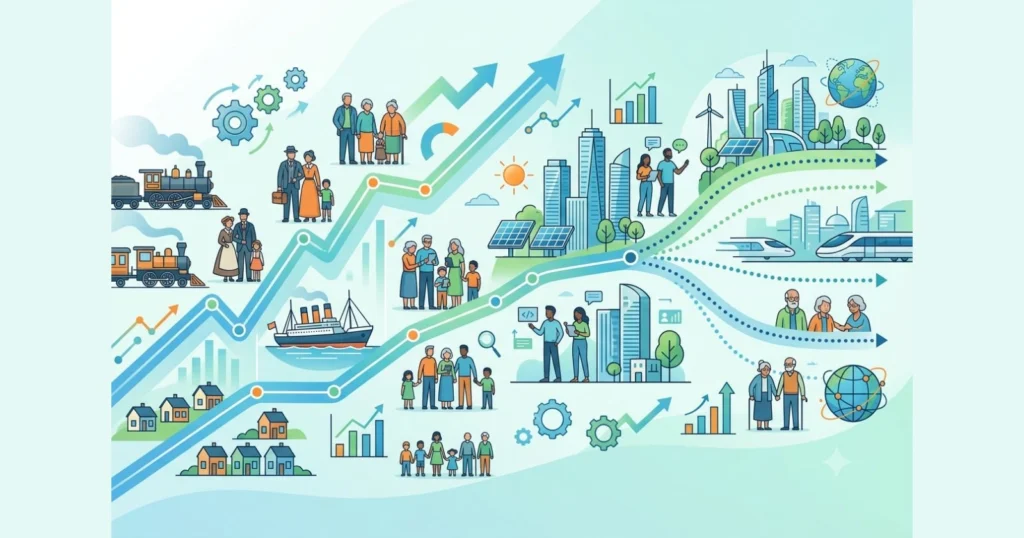
The United States has long been defined by growth. From roughly 152 million residents in 1950 to more than 341 million today, the nation has added people every single year for more than a century. Yet the pace of that growth has changed dramatically, and the story of the American population is no longer one of steady expansion. It is a story of slow births, aging generations, and a migration pattern that now decides whether the country grows at all.
This article walks through the full arc of the USA population growth rate, covering the historical decades, the most recent 10-year stretch, and the official projections that stretch out to the year 2100. Data is drawn primarily from the U.S. Census Bureau’s Population Estimates Program, the Census Bureau’s 2023 National Population Projections, and the Congressional Budget Office’s Demographic Outlook.
Understanding the Population Growth Rate
The population growth rate measures how much a country’s population changes over a set period, usually expressed as an annual percentage. It reflects three underlying components.
- Natural increase, which is the number of births minus the number of deaths
- Net international migration, meaning people moving into the country minus those leaving
- Net domestic migration, which reshuffles population between states but does not affect the national total
When natural increase and net international migration are both strong, the growth rate climbs. When either weakens, as has happened repeatedly since 2010, the national growth rate slows even if the population is still technically expanding.
A Century of Slowing Growth: The Past Trends
The United States grew explosively for most of the 20th century. The post-war baby boom pushed the growth rate above 1.7 percent a year in the early 1960s, a level the country has not come close to since. Growth cooled through the 1970s and 1980s as fertility rates fell, rebounded somewhat in the 1990s due to a wave of immigration and a “baby boom echo,” then began a long, mostly uninterrupted decline after 2000.
The table below tracks population totals and decade-over-decade growth rates going back to 1950.
Past Population Trends by Decade (1950 to 2020)
| Year | Population (millions) | Decade Growth Rate |
|---|---|---|
| 1950 | 152.3 | Base year |
| 1960 | 180.7 | 18.5% |
| 1970 | 205.1 | 13.3% |
| 1980 | 227.2 | 11.4% |
| 1990 | 249.6 | 9.8% |
| 2000 | 282.2 | 13.2% |
| 2010 | 309.3 | 9.7% |
| 2020 | 331.6 | 7.4% |
Source: U.S. Census Bureau decennial censuses, figures rounded to the nearest hundred thousand.
A few patterns stand out from this longer view.
- The 1950s remain the fastest-growing decade of the modern era, driven almost entirely by the baby boom.
- Growth slowed steadily from the 1960s through the 1980s as fertility rates dropped closer to replacement level.
- The 1990s saw a rebound, fueled by a large increase in both legal and undocumented immigration, alongside the children of baby boomers reaching parenting age.
- The 2010s recorded the second slowest decade of population growth in United States history, behind only the 1930s, which were shaped by the Great Depression.
The Last 10 Years, A Decade of Deceleration and Disruption
No 10-year window in recent memory captures the volatility of American population growth better than 2016 through 2025. This period includes a pre-pandemic slowdown, the sharpest single-year drop in modern history during 2021, a strong rebound driven by immigration in 2023 and 2024, and then a fresh slowdown in 2025 tied to a historic pullback in net international migration.
USA Population Growth Rate, Last 10 Years (2016 to 2025)
| Year | Estimated Population (millions) | Annual Growth Rate | Key Driver |
|---|---|---|---|
| 2016 | 322.9 | 0.7% | Steady natural increase and immigration |
| 2017 | 324.9 | 0.6% | Immigration policy tightening begins |
| 2018 | 326.7 | 0.6% | Declining net international migration |
| 2019 | 328.2 | 0.5% | Slowest peacetime growth since 1937 at the time |
| 2020 | 331.5 | 0.4% | Pandemic onset, 2020 Census count |
| 2021 | 332.0 | 0.2% | Historic low, COVID-19 deaths, and closed borders |
| 2022 | 334.0 | 0.6% | Immigration rebound begins |
| 2023 | 336.8 | 0.8% | Strong net international migration |
| 2024 | 340.1 | 1.0% | Fastest growth rate since 2001 |
| 2025 | 341.8 | 0.5% | Historic decline in net international migration |
Source: U.S. Census Bureau Population Estimates Program, Vintage 2025 and prior vintages, figures rounded.
Several details from this decade deserve a closer look.
- 2021 was the slowest year of population growth in modern U.S. history, with the population expanding by only about 0.16 percent as COVID-19 deaths spiked and both immigration and births fell.
- 2024 marked a sharp reversal, with the country adding roughly 3.2 million people, the fastest single-year gain since 2006, almost entirely because of a surge in net international migration that topped 2.7 million.
- 2025 brought an equally sharp slowdown. Net international migration fell from about 2.7 million to roughly 1.3 million, a drop of nearly 54 percent in a single year, cutting the overall growth rate back down to 0.5 percent.
- Natural increase, the surplus of births over deaths, has been shrinking for years. It stood at around 519,000 in the 2024 to 2025 period, far below the 1.6 to 1.9 million range typical of the 2000s.
Where the Growth Comes From, Natural Increase Versus Migration
One of the clearest shifts of the past decade is which component actually drives national growth. Through most of the 20th century, natural increase, meaning more births than deaths, was the dominant factor. That has changed.
- In the mid 2000s, natural increase alone added more than 1.6 million people a year to the population.
- By 2019, that figure had fallen below 1 million for the first time in decades.
- Since 2021, net international migration has accounted for the majority of the nation’s total population growth, a genuine departure from the pattern of the previous two decades.
- The total fertility rate has fallen to roughly 1.58 births per woman as of 2026, well below the replacement level of 2.1 needed to sustain a population without migration.
This shift matters because it makes the entire national growth rate far more sensitive to immigration policy and global migration flows than it was a generation ago. When migration drops, as it did in 2025, the growth rate falls almost immediately because there is so little natural increase left to cushion the decline.
The Road Ahead, Future Population Projections
Looking forward, both the Census Bureau and the Congressional Budget Office agree on the broad direction of travel. The population will keep growing for decades, but the rate of growth will continue to slow, and immigration will become the sole source of that growth sometime around the early 2040s. The Census Bureau’s 2023 National Population Projections, its main or “middle” series, currently serve as the authoritative long-range outlook, projecting the population out to the year 2100 for the first time since 2000.
Future Projected USA Population and Growth Rate
| Year | Projected Population (millions) | Approximate Annual Growth Rate |
|---|---|---|
| 2030 | 347.0 | 0.4% |
| 2035 | 351.5 | 0.3% |
| 2040 | 355.1 | 0.2% |
| 2050 | 360.0 | 0.15% |
| 2060 | 364.0 | 0.1% |
| 2080 | 370.0 | Approaching zero |
| 2100 | 366.0 | Negative, population declining |
Source: U.S. Census Bureau 2023 National Population Projections, main series, and Congressional Budget Office Demographic Outlook, figures rounded.
The projections point to several turning points worth flagging.
- 2030 is described by the Census Bureau as a genuine demographic turning point. This is the year the number of Americans age 65 and older is expected to surpass the number of Americans under 18 for the first time in the nation’s history.
- Deaths are projected to outnumber births nationally by around 2030, meaning natural increase turns negative and net international migration becomes the only source of population growth from that point forward.
- By 2100, the Census Bureau projects nearly all population growth since 2022 will trace back to immigrants and their descendants.
- The population is projected to peak at close to 370 million around 2080, then begin a slow decline, reaching roughly 366 million by 2100, an overall increase of just 9.7 percent from 2022 across nearly 80 years, a stark contrast with the 88 percent growth recorded between 1960 and 2024.
- The Congressional Budget Office’s own projection is somewhat higher, estimating the population could reach approximately 373 million by 2053, reflecting different assumptions about future immigration levels.
Alternative Census Bureau scenarios illustrate just how much immigration policy could reshape these numbers. Under a high immigration scenario, the foreign-born share of the population could reach 24.4 percent by 2100. Under a zero immigration scenario, the U.S. population would begin shrinking far sooner, and the foreign-born share would fall to just 0.3 percent.
The Full Picture, Combining Past, Present, and Future
To see the entire trajectory in one place, the table below combines historical population figures, the current estimate, and the long-range projections into a single continuous series stretching from 1950 to 2100.
USA Population Growth, 1950 to 2100
| Year | Population (millions) | Status |
|---|---|---|
| 1950 | 152.3 | Historical |
| 1970 | 205.1 | Historical |
| 1990 | 249.6 | Historical |
| 2000 | 282.2 | Historical |
| 2010 | 309.3 | Historical |
| 2020 | 331.6 | Historical |
| 2025 | 341.8 | Current estimate |
| 2030 | 347.0 | Projected |
| 2040 | 355.1 | Projected |
| 2060 | 364.0 | Projected |
| 2080 | 370.0 | Projected peak |
| 2100 | 366.0 | Projected decline |
Source: U.S. Census Bureau decennial censuses, Population Estimates Program, and 2023 National Population Projections.
Viewed across these 150 years, the American population story breaks into three distinct phases.
- The expansion era (1950 to 2000): The population more than doubled from roughly 152 million to 282 million, powered first by the baby boom and later by rising immigration.
- The deceleration era (2000 to 2040): Growth rates fall by more than half, from close to 1 percent a year down toward 0.2 percent a year, as fertility declines and the population ages.
- The plateau and decline era (2040 to 2100): Natural increase turns negative, immigration becomes the sole growth engine, and the total population is projected to plateau near 370 million before beginning a gradual decline.
What Is Driving the Slowdown
A handful of structural forces explain why the USA population growth rate has fallen so consistently over the past two decades, and why demographers expect that trend to continue.
- Falling fertility: The total fertility rate has dropped from 2.12 births per woman in the 1990s to around 1.58 in 2026, and the Congressional Budget Office projects it will settle near 1.53 by the mid 2030s.
- An aging population: The median age climbed from 37.3 in 2012 to roughly 38.7 to 39.5 today, and it is projected to reach 47.9 by 2100. As more of the population moves into older age brackets, the number of annual deaths keeps rising even as birth totals stay flat or fall.
- Volatile immigration policy: Net international migration swung from 2.7 million in the 2023 to 2024 period down to roughly 1.3 million the following year, and it is projected to fall further, to around 321,000, by mid 2026. Because immigration is now the primary growth driver, policy shifts translate almost directly into growth rate swings.
- Regional divergence: Growth is increasingly uneven across the country. States such as South Carolina, Idaho, and North Carolina posted growth rates above 1.3 percent in the 2024 to 2025 period, largely from domestic migration, while several states in the Northeast and Midwest recorded outright population losses.
Final Takeaway
The USA population growth rate has moved through nearly every phase a modern nation can experience, from the explosive expansion of the baby boom years to the sluggish, migration-dependent growth of today. The next several decades will test how the country adapts to an aging population, a fertility rate well below replacement level, and a demographic future in which immigration is not just one factor among several but the primary reason the population keeps growing at all.
Whether the population ultimately peaks near 370 million in the 2080s or follows a different path will depend heavily on immigration policy choices that have not yet been made, making this one of the more consequential and closely watched demographic questions facing the United States in the years ahead.
Frequently Asked Questions
What is the current USA population growth rate?
The population grew by about 0.5 percent between July 2024 and July 2025, according to the Census Bureau’s Vintage 2025 estimates, down sharply from the 1.0 percent growth rate recorded the previous year.
Why did population growth slow so much in 2025?
The primary cause was a historic drop in net international migration, which fell from roughly 2.7 million to about 1.3 million in a single year, a decline of nearly 54 percent.
When will deaths outnumber births in the United States?
The Census Bureau projects that natural increase will turn negative around 2030, after which net international migration becomes the sole source of national population growth.
Will the U.S. population ever start shrinking?
Under the Census Bureau’s main projection series, the population is expected to keep growing slowly until around 2080, then begin a gradual decline toward 366 million by the year 2100.
How does U.S. population growth compare to the rest of the world?
In 2024, U.S. population growth of 0.98 percent ran close to the global average of about 1.03 percent, though the long-term U.S. trajectory is decelerating faster than many developing regions.





