
Track a single Australian birth cohort from the delivery room to a hundredth birthday and you watch a slow reversal play out. At birth, boys outnumber girls by about 106 to 100. By age 28, women have already pulled ahead. By 80, there are just 83 men left for every 100 women. By 100, only 32. Australia’s population by sex is not one static ratio; it is a demographic pendulum that swings from a male surplus in the cradle to a female majority by the nursing home.
Australia’s Male-Female Population Balance
As of the most recent estimates, Australia’s population splits to roughly 13.51 million males (49.6%) and 13.72 million females (50.4%), a gap of around 205,000 more women than men nationally. The overall sex ratio sits at approximately 98.5 males per 100 females. At the 2021 Census, males made up 49.3% of the population with a median age of 37, and females made up 50.7% with a median age of 39, a gap driven almost entirely by the female longevity advantage at older ages.
How Australian Population Statistics Measure Sex
The ABS collects and reports sex as male and female categories across its core demographic collections, including the Census and the quarterly Estimated Resident Population series, and the sex ratio convention used throughout official Australian statistics is the number of males per 100 females.
Since the 2021 Census, the ABS has also collected a separate, voluntary question on gender diverse identity as an additional data item, distinct from the core sex classification used in the long-running population time series that this article draws on. Because the historical series spans over a century of consistent male-female measurement, it remains the most reliable basis for tracking demographic change over time.
Male vs Female Population Since 1901
| Year | National sex ratio (males per 100 females) | Note |
|---|---|---|
| 1901 | Well above 100 | Male-dominated colonial and Federation-era population |
| 1947 | Above 100 | Post-war male surplus still evident |
| 1989 | 99.5 | Approaching balance |
| 2002 | 98.5 | |
| 2007 | 98.8 | |
| 2009 | 99.1 | |
| 2015 | 99.0 | Female population passed 12 million |
| 2021 (Census) | 97.3 | Males 49.3% / Females 50.7% |
| 2026 (projected) | 98.5 |
Australia’s sex ratio has moved within a fairly narrow band, roughly 97 to 99.5 males per 100 females, for the past four decades, a far cry from the heavily male-skewed colonial population of the nineteenth century, when male-dominated migration streams, particularly to the goldfields and pastoral frontier, left men substantially outnumbering women for generations.
Sex Ratio at Birth
Australia’s sex ratio at birth sits close to the biologically typical range of around 105 to 106 male births for every 100 female births, a pattern found in almost every human population and not considered evidence of sex-selective practices at the national level.
A 2018 population-based study of births in Victoria between 1999 and 2015 did find a statistically elevated male-to-female birth ratio among some migrant groups, particularly for higher-parity births among mothers born in India, China and parts of South-East Asia, with ratios in some subgroups reaching as high as 1.2 male births per female birth at third or later parity. Even accounting for this variation, Australia’s national sex ratio at birth remains within the biologically normal range and well below the more pronounced imbalances recorded in some parts of Asia.
Sex Ratio by Age
The most striking pattern in Australia’s sex data is the age-based sex ratio curve. At birth, males outnumber females by roughly 106 to 100. That male surplus persists through childhood and into the twenties before crossing over.
| Age milestone | Sex ratio |
|---|---|
| At birth | ~106 males per 100 females |
| Crossover point | Age 28 (males first fall below females) |
| Age 80 | 83 males per 100 females |
| Age 90 | 55 males per 100 females |
| Age 100+ | 32 males per 100 females |
The mechanism is straightforward: male mortality rates exceed female mortality rates at almost every age after infancy, a gap that widens sharply from around age 70 onward as the female life expectancy advantage compounds. By the time a cohort reaches its late eighties, women outnumber men by a wide margin, a pattern with direct implications for aged care design, widowhood rates and the composition of Australia’s oldest-old population.
Why Women Become a Larger Share at Older Ages
Three forces combine to produce Australia’s older female majority. Higher male mortality at almost every adult age, historically linked to occupational hazards, higher rates of smoking-related disease and cardiovascular risk, steadily erodes the male cohort faster than the female one. The female life expectancy advantage, 4.0 years as of the 2022-2024 ABS life tables, compounds that mortality gap over a lifetime.
And because women in Australia have traditionally partnered with men roughly the same age or older, widowhood becomes overwhelmingly a female experience in the final decades of life, reinforcing the sex imbalance visible in aged care and retirement living populations.
Male-Female Balance by State and Territory
| State/Territory | Sex ratio (males per 100 females) | Note |
|---|---|---|
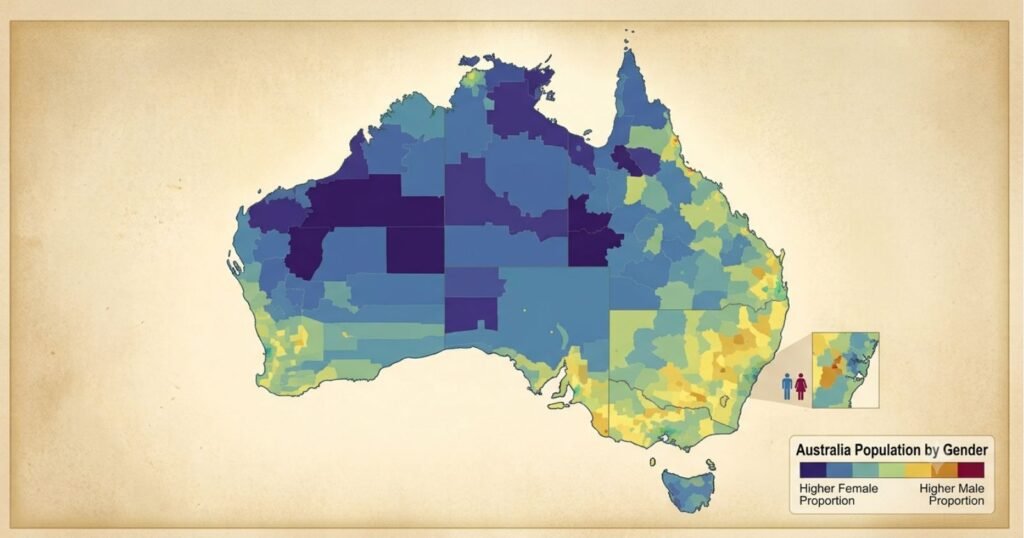
| Northern Territory | ~112 (2015); historically as high as 107.9-112 | Consistently the most male-skewed jurisdiction |
| Western Australia | ~102 | Mining and resources workforce skews male |
| Australian Capital Territory | ~97.1 | Close to balance |
| New South Wales | Below 100 | Slight female majority |
| Victoria | Below 100 | Slight female majority |
| Queensland | Below 100 | Slight female majority |
| South Australia | ~97.6 | Among the lowest ratios |
| Tasmania | ~97.3 | Among the lowest ratios |
The Northern Territory has recorded the highest sex ratio of any Australian jurisdiction for decades, driven by a workforce skewed toward male-dominated industries such as mining, defense and remote-area construction, alongside a smaller, younger population less affected by the female longevity advantage that pulls older states toward female majorities.
Western Australia shows a similar, if less extreme, pattern tied to its resources sector. Within Western Australia itself, the contrast is stark: Perth recorded a sex ratio of just 99.8 in 2024, while the rest of the state, dominated by mining regions, recorded 105.2.
Remote mining localities push this further still; East Pilbara recorded a sex ratio as high as 289.5 males per 100 females in 2019 data, reflecting fly-in fly-out workforce housing rather than a typical residential population.
Migration and Sex Composition
Australia’s overseas-born population is not evenly split by sex, and the imbalance varies significantly by country of birth and by how long ago each migration wave occurred. Older migration streams, dominated by post-war European migration, now skew toward a more balanced or even female-leaning sex ratio simply because those populations have aged into the years where female longevity dominates; the Greek-born population had a median age of 75 and the Italian-born population a median age of 73 in 2022 ABS data.
More recent migration streams, often weighted toward working-age skilled and student visa holders, tend to show different sex balances depending on the industries and course types that dominate each source country’s migration pattern.
Sex Composition of Major Migrant Groups
| Country of birth | Median age (2022) | Note |
|---|---|---|
| Greece | 75 years | Oldest major migrant group, post-war arrival wave |
| Italy | 73 years | Oldest major migrant group, post-war arrival wave |
| England | Older than national average | Long-established migration stream |
| China | Middle-aged | Mixed skilled, family and student migration |
| India | Younger than national average | Recent, working-age dominated migration |
| Nepal | 29 years | 6 years younger than the Australian-born population |
Skilled and student migration streams from South Asia have consistently trended younger and, in several source countries, more male-weighted than the older European migration streams they have gradually overtaken in size, a shift that is steadily reshaping the sex and age profile of Australia’s overseas-born population as a whole.
Historical Changes in Australia’s Sex Ratio
Australia’s sex ratio has moved through three broad phases. Through the nineteenth century and into the early twentieth, male-dominated migration during the colonial and gold rush eras left men substantially outnumbering women nationally. Through the mid-twentieth century, as post-war migration brought more balanced family-based intakes and the population’s age structure normalized, the ratio moved steadily toward parity.
Since the 1990s, the ratio has settled into a narrow band just below 100, drifting between roughly 97 and 99.5 males per 100 females depending on migration composition and the pace of population aging in any given year.
Australia’s Future Sex Composition
Two forces will continue shaping Australia’s sex ratio over the coming decades. Continued population aging will keep pulling the national ratio down over time, since a larger share of the population moving into the 70-plus age bracket, where the female majority is most pronounced, mechanically lowers the overall male-per-100-female figure.
Migration composition will work in the opposite direction if current patterns hold, since net overseas migration continues to skew toward working-age adults, the age bracket where the sex ratio remains closest to balanced or even male-leaning in resource and infrastructure-heavy sectors. The net effect over the next few decades will likely keep Australia’s national sex ratio within a similar narrow band to the one it has occupied since the 1990s, even as the underlying age-specific patterns continue to shift.
Why Sex Composition Matters
- Aging: A rapidly widening female majority above age 80 shapes demand for aged care services, with facilities increasingly designed around a predominantly female resident population
- Workforce: State-level sex imbalances tied to resources and construction industries affect regional labor markets, housing demand and community services planning in areas like the Pilbara and the Northern Territory
- Caregiving: Because women live longer and have traditionally partnered with men of similar or older age, informal caregiving in later life falls disproportionately to women, both as caregivers to spouses and, later, as the surviving partner requiring care themselves
- Household formation: Sex ratio imbalances by region influence local marriage markets and household formation patterns, particularly in remote mining communities with heavily skewed working-age populations
- Population projections: Accurate age-specific sex ratios are essential inputs into ABS population and aged care demand projections, since mortality, migration and fertility all interact differently by sex
Key Findings
- Australia’s population splits to roughly 49.6% male and 50.4% female, with a national sex ratio of approximately 98.5 males per 100 females
- The sex ratio at birth sits at around 106 males per 100 females, within the normal biological range
- Men first fall below women in population count at age 28; by 80, there are just 83 men per 100 women, and by 100, only 32
- The Northern Territory has the highest sex ratio of any state or territory, driven by male-dominated mining, defense and remote construction employment
- Perth’s sex ratio (99.8) is markedly more balanced than the rest of Western Australia (105.2), reflecting the concentration of mining workers outside the capital
- Older post-war migrant groups, such as the Greek-born (median age 75) and Italian-born (median age 73) populations, sit at the opposite demographic extreme from newer migration streams like Nepal-born residents (median age 29)
- Australia’s national sex ratio has held within a narrow band of roughly 97 to 99.5 males per 100 females since the 1990s
Frequently Asked Questions
1. Are there more men or women in Australia?
More women. Australia’s population is roughly 49.6% male and 50.4% female, a gap of around 205,000 more women than men.
2. What is Australia’s sex ratio?
Approximately 98.5 males per 100 females nationally, though this varies significantly by age and by state or territory.
3. What is the sex ratio at birth in Australia?
Around 106 male births for every 100 female births, consistent with the typical biological range found in most human populations.
4. At what age do women start outnumbering men in Australia?
Around age 28, after which the female share of the population steadily increases with age due to higher male mortality.
5. Which Australian state or territory has the most men relative to women?
The Northern Territory, with a sex ratio historically as high as 107 to 112 males per 100 females, driven by male-dominated mining, defense and remote-work industries.
6. Which Australian jurisdiction has the most women relative to men?
Tasmania and South Australia have consistently recorded among the lowest sex ratios in the country, close to 97 to 98 males per 100 females.
7. Why do women outnumber men so heavily at older ages in Australia?
Because male mortality rates exceed female mortality rates at nearly every adult age, and the gap compounds over a lifetime alongside a female life expectancy advantage of around 4 years.
8. Does migration affect Australia’s sex ratio?
Yes. Migration streams vary in sex composition by source country and visa type, with older post-war European migrant populations now skewing female due to aging, while some newer working-age migration streams skew closer to balance or slightly male.
9. What is the sex ratio in Australia’s mining regions?
Extremely high in some remote localities; East Pilbara in Western Australia recorded 289.5 males per 100 females, reflecting fly-in fly-out mining workforce housing rather than a typical residential population.
10. How has Australia’s sex ratio changed since Federation?
It has moved from a substantial male surplus in the colonial and early Federation era toward near parity, settling into a narrow band of roughly 97 to 99.5 males per 100 females since the 1990s.
Sources
- Australian Bureau of Statistics, Australian Demographic Statistics (historical releases, 2002-2016)
- Australian Bureau of Statistics, 2021 Census QuickStats, Australia
- Australian Bureau of Statistics, Regional population by age and sex, 2019 and 2024
- Australian Bureau of Statistics, Australia’s Population by Country of Birth, 2022
- Australian Bureau of Statistics, Life expectancy, 2022-2024
- International Journal of Epidemiology, Male-biased sex ratios in Australian migrant populations, 1999-2015
- StatisticsTimes.com, Australia Demographics 2026





