
A boy born in Australia in 1901 could expect to live to about 55. A boy born today can expect to live to 81. That 26-year gain happened almost entirely without any single medical miracle, driven instead by clean water, vaccination, safer childbirth and a collapse in infant deaths so dramatic that a baby born in 1901-10 was 18 times more likely to die before its first birthday than one born a century later. Australia’s longevity story is really a story about how a society stopped losing its children.
Australia’s Longevity in Perspective
At the latest ABS release, covering 2022-2024, life expectancy at birth in Australia stands at 81.1 years for males and 85.1 years for females, a combined average of roughly 83.0 years. Over the past decade, male life expectancy has risen 0.8 years and female life expectancy 0.7 years, a slower pace of improvement than the twentieth century saw, but still a positive long-term trend after a rare pandemic-era interruption.
What Life Expectancy Measures
Life expectancy figures published by the ABS are typically period life expectancy, meaning they describe how long a person would live if the mortality rates observed during that specific period applied unchanged for their entire life.
This differs from cohort life expectancy, which tracks the actual mortality experience of a group of people born in the same year as they age, accounting for future medical and social improvements. The ABS also publishes life expectancy at age 65, a critical figure for retirement and pension planning, since it strips out the influence of early-life mortality and shows how many further years a 65-year-old can expect to live.
Australia’s Life Expectancy Since 1900
| Period | Male life expectancy | Female life expectancy | Gap |
|---|---|---|---|
| 1901-1910 | ~55 years | ~59 years | ~3.6 years |
| 1990 | 73.9 years | 80.1 years | 6.2 years |
| 1998-2000 | 76.6 years | 82.0 years | 5.4 years |
| 2003-2005 | 78.5 years | 83.3 years | 4.8 years |
| 2010-2012 | 79.9 years | 84.3 years | 4.4 years |
| 2018-2020 | 81.2 years | 85.3 years | 4.1 years |
| 2020-2022 | 81.2 years | 85.3 years | 4.1 years |
| 2022-2024 | 81.1 years | 85.1 years | 4.0 years |
Australia’s life expectancy did not rise in a straight line. It climbed steeply through the first half of the twentieth century, continued more gradually through the second half, and then, for the first time since the mid-1990s, actually fell slightly during the COVID-19 period before stabilizing.
The Biggest Gains in Australian Longevity
The single largest driver of Australia’s twentieth-century longevity gain was the collapse in infant mortality. In 1904, close to 82 infants died for every 1,000 born; by the end of World War II that had fallen to around 29 per 1,000, and by 1998 it had dropped to 5 per 1,000. Because so many nineteenth and early twentieth-century deaths occurred in infancy, saving those lives dragged the national life expectancy average up dramatically. A male in 1901-10 who survived his first year already had a life expectancy of around 60 years, five years higher than the birth figure of 55, illustrating how heavily infant deaths distorted early life expectancy statistics.
Beyond infant survival, sanitation, mass vaccination, antibiotics, improved nutrition and rising living standards drove mortality down across every age group through the twentieth century, while more recent decades have added gains concentrated at older ages through better management of cardiovascular disease and cancer.
Male vs Female Life Expectancy
Women have outlived men in Australia for as long as records exist, but the size of that gap has moved in a clear arc. It stood at roughly 3.6 years at birth in 1901-1910, then widened steadily through the century as male mortality from smoking-related disease, workplace injury and cardiovascular disease climbed relative to female mortality, before narrowing again from the late twentieth century onward as men’s smoking rates fell and cardiovascular treatment improved. The gap peaked around 6-7 years in the late twentieth century and has since narrowed to 4.0 years as of 2022-2024, the smallest gap in decades.
Life Expectancy by State and Territory
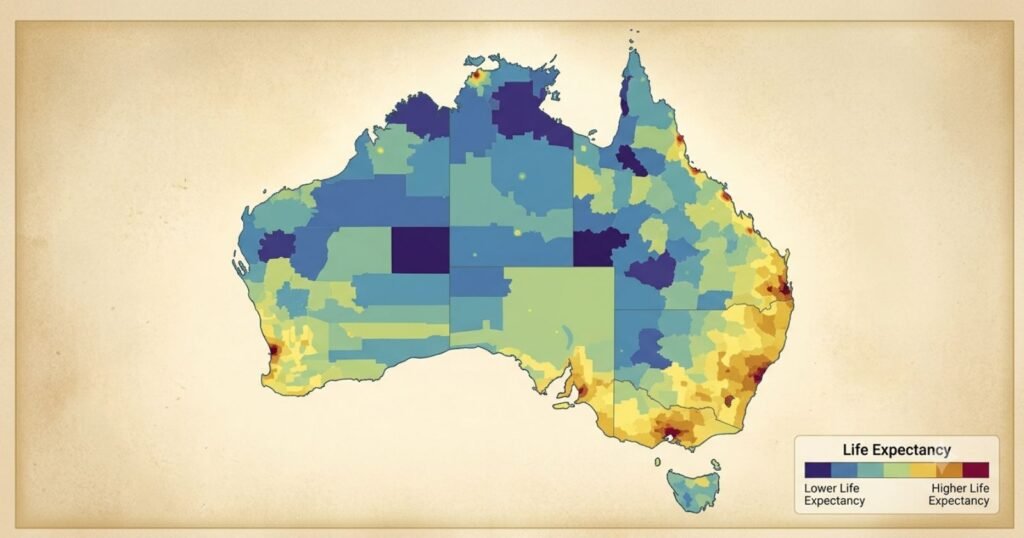
Life expectancy varies meaningfully across Australia’s states and territories, generally correlating with remoteness, socioeconomic conditions and the size of each jurisdiction’s Aboriginal and Torres Strait Islander population. The Northern Territory has consistently recorded the lowest life expectancy of any state or territory, with male life expectancy around 77.0 years and female life expectancy around 80.7 years in the most recent data, several years below the national average.
The Australian Capital Territory and Victoria have typically recorded among the highest life expectancies in the country, benefiting from higher average incomes, greater healthcare access and lower rates of remote and disadvantaged communities relative to their population.
Indigenous Life Expectancy
Aboriginal and Torres Strait Islander life expectancy remains one of the starkest and most persistent gaps in Australian public health data. Recent estimates put Indigenous life expectancy at 71.9 years for men, 8.8 years below the non-Indigenous male figure, and 75.6 years for women, 8.1 years below the non-Indigenous female figure.
Historical analysis suggests this gap has remained close to 11-12 years by some measures since at least the early 1980s, showing only limited narrowing despite Indigenous life expectancy improving at rates broadly similar to the general population over the same period.
Indigenous infant mortality has narrowed more successfully: the gap fell from over 8 deaths per 1,000 live births before 2000 to around 4 per 1,000 by 2008, though the Indigenous infant mortality rate of 7.8 per 1,000 in 2007-2009 remained almost double the national rate of 4.3 per 1,000 for the same period. Closing the Gap targets continue to track this life expectancy gap as one of the nation’s central health equity indicators.
Australia’s Major Mortality Trends
Australia’s cause-of-death profile has transformed alongside its life expectancy gains. Infectious diseases accounted for 15% of all deaths in 1922, with an average age at death of just 27 years for those conditions; by 2024, infectious diseases excluding COVID-19 accounted for less than 2% of deaths, with an average age at death of 80 years.
That shift, from infectious disease killing the young to chronic disease affecting the old, is the defining mortality transition of the past century, and it explains why further life expectancy gains now depend increasingly on managing cardiovascular disease, cancer and dementia in an aging population rather than on preventing early death.
COVID-19 and Australia’s Life Expectancy
Australia’s life expectancy fell for two consecutive reporting periods during the pandemic era, 2020-2022 and 2021-2023, the first decreases recorded since the mid-1990s.
Male life expectancy dipped to 81.2 years and female life expectancy to 85.3 years in 2020-2022, a decrease of 0.1 years for both sexes from the prior period. The decline reflected both direct COVID-19 mortality and broader pandemic-era disruption to health services and mortality patterns.
By 2022-2024, life expectancy had stabilized at 81.1 years for males and 85.1 years for females, effectively unchanged from 2021-2023, suggesting the disruption has plateaued rather than reversed the underlying long-term upward trend, though growth has not yet resumed at its pre-pandemic pace.
Healthy Life Expectancy
Total lifespan and years lived in good health are not the same measure, and the gap between them matters enormously for aged care and health policy. Health-adjusted life expectancy (HALE) for males born in 2024 was 71.7 years, and 73.8 years for females, meaning men spend on average 88% of their lives in full health and women 86%.
The remaining years, roughly 9.4 years for men and 11.3 years for women on average, are lived with some burden of disease or disability, a gap that tends to concentrate heavily in the final years of life and drives much of the demand for aged care and chronic disease management services.
Australia’s Aging Population and Longevity
Rising life expectancy is one half of Australia’s aging story; falling fertility is the other. Together they have pushed the national median age from the low twenties at Federation to 38.4 years by 2024-25, and pushed the 65-plus share of the population from around 12% in the mid-1990s to 18% today.
Longer lives mean each successive generation of retirees draws on the pension and aged care systems for longer than the generation before it, even as fewer working-age Australians, relative to the retired population, are available to fund that support.
Future Life Expectancy
Government actuarial projections assume continued, if gradual, improvement. The Australian Government Actuary’s long-term modeling assumes life expectancy improvements of around 0.15 years per year for men and 0.10 years per year for women through to 2030-31, roughly matching the pace of improvement recorded over the prior decade.
Applying that trajectory forward, Australia’s male life expectancy could approach 84-85 years and female life expectancy could approach 87-88 years by 2050, though the pace of improvement could shift meaningfully depending on future trends in obesity, chronic disease management and any future pandemic-scale health shocks. The male-female gap is expected to continue narrowing slowly, following its trajectory since the late twentieth century.
What Longer Lives Mean for Australia
- Retirement: Longer post-retirement lifespans increase the number of years superannuation and pension savings must support, intensifying pressure on retirement income adequacy
- Pensions: A rising life expectancy at 65 directly increases the fiscal cost of the Age Pension over time, a key input into long-term budget projections
- Healthcare: As mortality shifts further toward chronic disease in older age, healthcare demand increasingly concentrates on cardiovascular disease, cancer and dementia management rather than acute infectious disease
- Aged care: The gap between total life expectancy and healthy life expectancy, roughly 9 to 11 years on average, drives sustained demand for both residential and home-based aged care
- Workforce: Longer, healthier lives support later workforce participation, a policy lever governments have increasingly relied on to offset the fiscal cost of an aging population
Key Takeaways
- Australian life expectancy has risen from around 55 years for men in 1901-1910 to 81.1 years in 2022-2024, and from around 59 to 85.1 years for women over the same period
- Falling infant mortality, from 104 deaths per 1,000 live births in 1901 to 0.3% by 2021, drove most of the twentieth-century longevity gain
- The male-female life expectancy gap has narrowed to 4.0 years, its smallest in decades, after widening to 6-7 years mid-century
- Life expectancy fell for the first time since the mid-1990s during 2020-2022 and 2021-2023, before stabilizing in 2022-2024
- Aboriginal and Torres Strait Islander life expectancy remains roughly 8 to 9 years below the non-Indigenous population, a gap that has narrowed only slowly since the early 1980s
- Healthy life expectancy trails total life expectancy by roughly 9 to 11 years on average, concentrating aged care and chronic disease demand in later life
- Actuarial projections point toward male life expectancy near 84-85 years and female life expectancy near 87-88 years by 2050
Frequently Asked Questions
1. What is the current life expectancy in Australia?
81.1 years for males and 85.1 years for females, based on the ABS 2022-2024 life expectancy release.
2. Has Australian life expectancy ever declined?
Yes. It fell slightly in both 2020-2022 and 2021-2023, the first declines recorded since the mid-1990s, linked to the COVID-19 pandemic period, before stabilizing in 2022-2024.
3. What was life expectancy in Australia 100 years ago?
Around 55 years for males and 59 years for females in 1901-1910, driven down heavily by very high infant mortality.
4. Why has the male-female life expectancy gap narrowed?
Falling male smoking rates and improved cardiovascular disease treatment have narrowed the gap from 6-7 years mid-century to 4.0 years in 2022-2024.
5. What is the Aboriginal and Torres Strait Islander life expectancy gap?
Indigenous life expectancy is estimated at 71.9 years for men and 75.6 years for women, roughly 8 to 9 years below the non-Indigenous population.
6. What is healthy life expectancy?
The average number of years a person can expect to live in full health, distinct from total life expectancy. For Australians born in 2024, that is 71.7 years for males and 73.8 years for females.
7. Which Australian jurisdiction has the lowest life expectancy?
The Northern Territory, with male life expectancy around 77.0 years and female life expectancy around 80.7 years, both below the national average.
8. What drove the biggest historical gains in Australian life expectancy?
The collapse in infant mortality during the early to mid-twentieth century, alongside improved sanitation, vaccination, nutrition and living standards.
9. What is Australia’s life expectancy projected to be by 2050?
Actuarial projections suggest male life expectancy could reach roughly 84-85 years and female life expectancy roughly 87-88 years, assuming continued gradual improvement.
10. What is the difference between period and cohort life expectancy?
Period life expectancy assumes current mortality rates apply for a person’s whole life, while cohort life expectancy tracks an actual generation’s mortality as they age, typically producing a higher figure since it accounts for future medical improvement.
Sources
- Australian Bureau of Statistics, Life expectancy, 2022-2024
- Australian Bureau of Statistics, Life expectancy, 2020-2022
- Australian Bureau of Statistics, Historical population, 2021
- Australian Government Actuary, Australian Life Tables 2020-22
- Australian Institute of Health and Welfare, Deaths in Australia
- Australian Institute of Health and Welfare, Changing patterns of mortality in Australia since 1900
- Australian Bureau of Statistics, Year Book Australia, 2007, Infant mortality over the last 100 years
- PMC/National Library of Medicine, A review of life expectancy and infant mortality estimations for Australian Aboriginal people
- Centre for Population, 2025 Population Snapshot





