The world population graph rises from 2.49 billion in 1950 to 8.30 billion in 2026 and peaks at 10.29 billion in 2084, while annual growth falls from 2.28% to zero.
Key Takeaways
- The world population graph climbs 3.3 times from 2.49 billion in 1950 to 8.30 billion in 2026, peaks at 10.29 billion in 2084, and eases to 10.18 billion by 2100, according to the UN medium projection.
- The growth-rate line peaked at 2.28% in 1963 and stands at 0.83% in 2026, while the yearly gain peaked at 93.7 million in 1990, so the curve bends decades before the total stops rising.
- Other projections draw a lower, earlier peak: 9.7 billion in 2064 (IHME, 2020) and 10.1 billion in 2080 (Wittgenstein Centre), against the UN’s 10.29 billion in 2084.
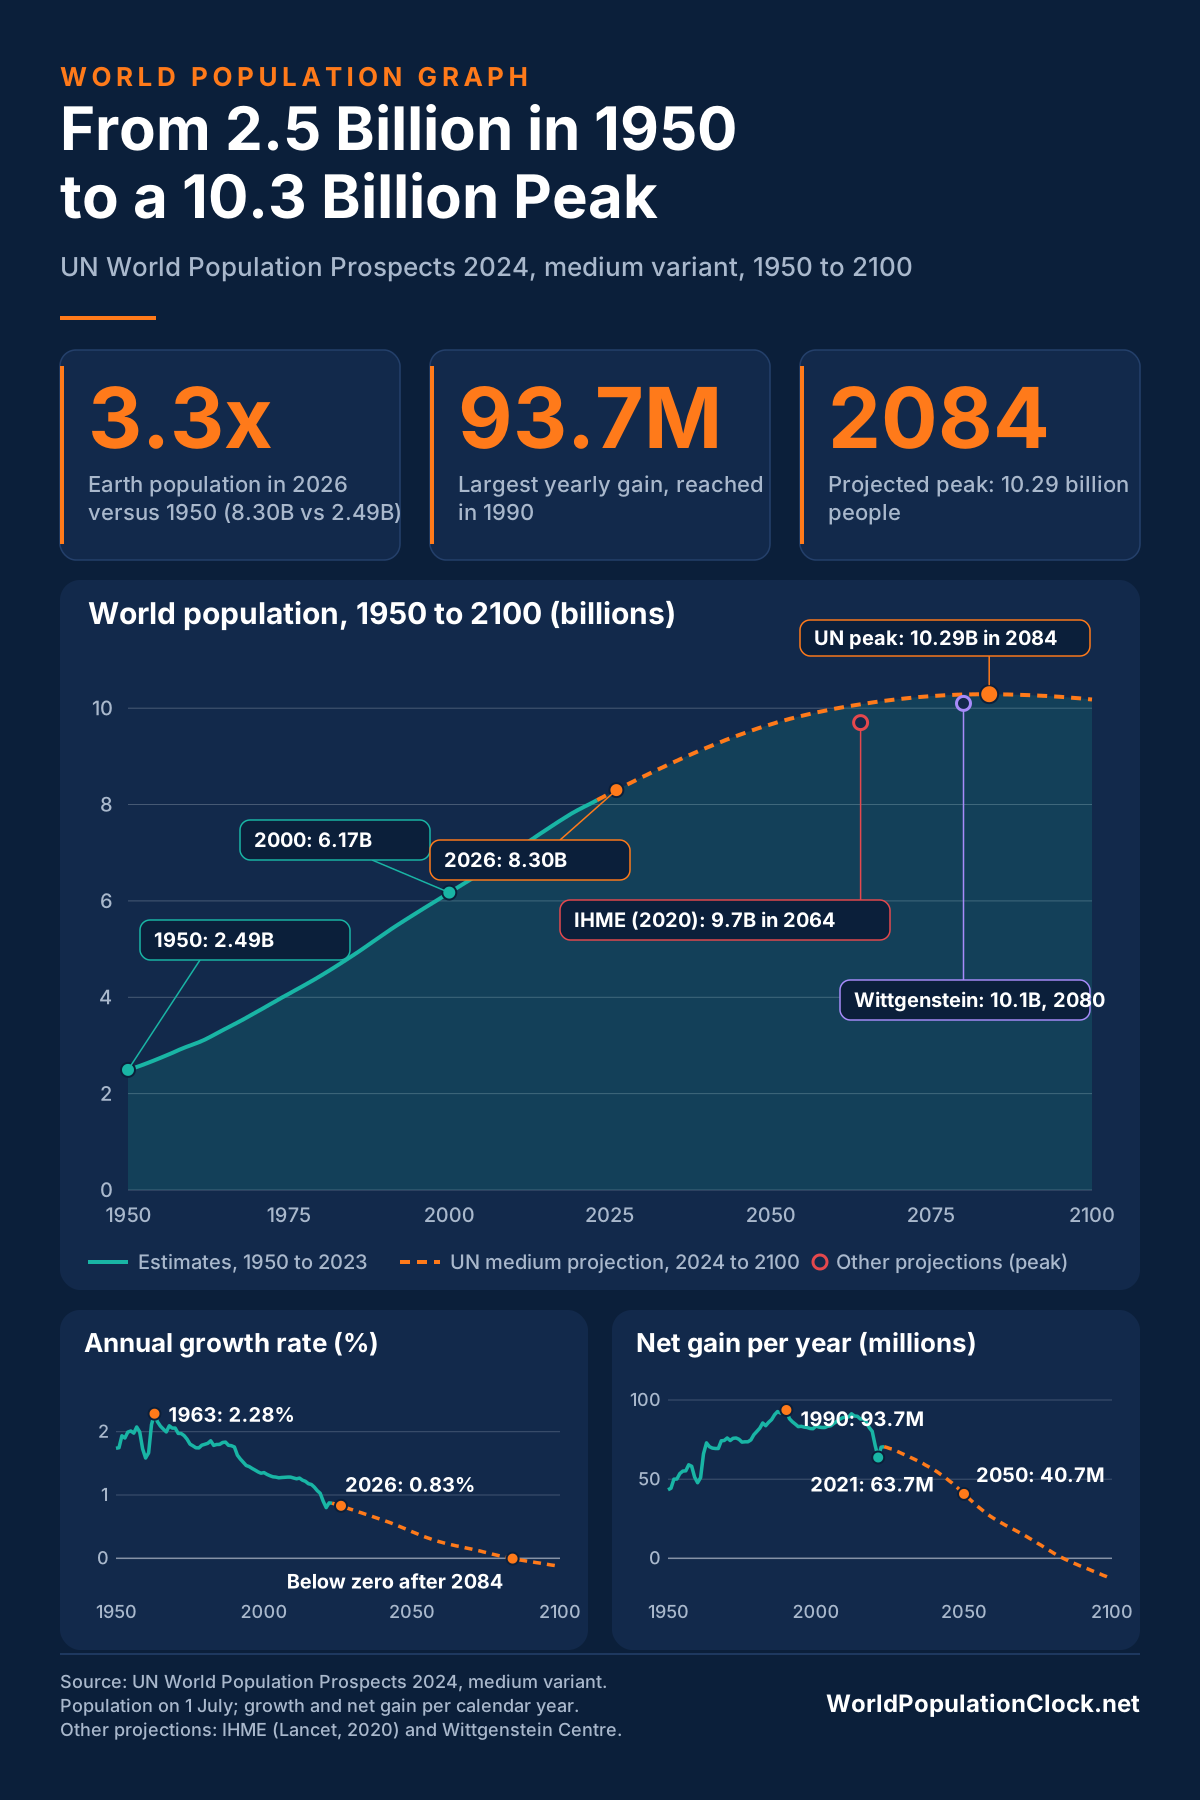
The world population graph has three lines worth reading: the total, the annual growth rate and the number of people added each year. The total has risen without a break since 1950, from 2.49 billion to 8.30 billion in 2026, a gain of 5.81 billion. The growth rate tells a different story. It peaked at 2.28% in 1963 and has fallen by almost two-thirds, and the UN projects it will reach zero in 2084. The world population clock shows where the total stands today.
The graph in the infographic for this article combines all three lines. It uses the UN’s World Population Prospects 2024, medium variant. Population levels are 1 July values. Growth rates and yearly gains are UN calendar-year figures, measured from 1 January to 1 January, which is why 2026 shows a gain of 68.9 million and 0.83%, while a simple July-to-July difference gives 69.1 million and 0.84%, the figure some sites quote. Years up to 2023 are UN estimates, and 2024 onward are projections. The vertical axis starts at zero.
Reading the World Population Graph Year by Year
The table samples the UN series at the points where the curve changes character.
| Year | Population (billions) | Yearly gain (millions) | Growth rate (%) |
|---|---|---|---|
| 1950 | 2.493 | 43.3 | 1.74 |
| 1960 | 3.015 | 47.8 | 1.58 |
| 1970 | 3.695 | 76.0 | 2.06 |
| 1980 | 4.448 | 80.1 | 1.80 |
| 1990 | 5.328 | 93.7 | 1.76 |
| 2000 | 6.172 | 83.5 | 1.35 |
| 2010 | 7.022 | 89.1 | 1.27 |
| 2020 | 7.887 | 71.2 | 0.90 |
| 2026 | 8.301 | 68.9 | 0.83 |
| 2030 | 8.569 | 65.4 | 0.76 |
| 2040 | 9.177 | 55.7 | 0.61 |
| 2050 | 9.664 | 40.7 | 0.42 |
| 2060 | 9.989 | 25.3 | 0.25 |
| 2070 | 10.189 | 15.0 | 0.15 |
| 2080 | 10.283 | 3.6 | 0.04 |
| 2084 | 10.289 | -0.4 | 0.00 |
| 2090 | 10.272 | -5.3 | -0.05 |
| 2100 | 10.180 | -12.9 | -0.13 |
The total rises in every row until 2084. The yearly gain rose from 43.3 million in 1950 to 93.7 million in 1990, then drifted down. By 2050, the gain is 40.7 million, less than half the 1990 peak, and the 2100 row shows a loss of 12.9 million a year. A longer record of the same totals is kept on the world population growth trends page.
Six Phases of the World Population Graph
The curve passes through six phases, each with a different slope.
| Phase | Years | What the graph does | Key figures |
|---|---|---|---|
| Acceleration | 1950 to 1963 | Growth rate climbs to its peak | 1.74% to 2.28%; yearly gain 43.3 to 72.9 million |
| Falling rate, rising gain | 1963 to 1990 | Rate falls while the base grows | Rate 2.28% to 1.76%; gain up to 93.7 million |
| Plateau | 1990 to 2019 | Gain stays between 80 and 91 million from 1991 | Low of 81.9 million in 1999, 91.3 million in 2012 |
| Pandemic dip | 2020 to 2021 | Gain drops, then recovers | 71.2 million in 2020, 63.7 million in 2021, 70.5 million in 2023 |
| Slow deceleration | 2024 to 2083 | Gain shrinks every year | 70.0 million in 2024 to 0.5 million in 2083 |
| Decline | 2084 to 2100 | Total falls slowly | 10.289 billion to 10.180 billion, a loss of 109 million |
The first phase includes a dip in 1959 to 1961, when the growth rate fell to 1.58% in 1960, which coincides with the famine in China. The second phase shows why a falling growth rate does not mean a falling gain: in 1990 the rate was 1.76%, below the 1963 peak of 2.28%, yet the gain was 93.7 million against 72.9 million, because 1.76% of 5.28 billion is more than 2.28% of 3.19 billion. The 2020 to 2021 dip coincides with the COVID-19 pandemic, and the recovery to 70.5 million in 2023 was only partial. The growth rate was above 2% in ten years of the series, all between 1955 and 1970.
The slower slope has not made the later years smaller in absolute terms. The 40 years from 1950 to 1990 added 2.84 billion people, and the 36 years from 1990 to 2026 added 2.97 billion. The projection adds a further 1.99 billion between 2026 and the 2084 peak, which means the world will add about two-thirds as many people in the next 58 years as it added in the last 36.
Why the Curve Bends Before the Total Stops Rising
By 2026, the growth rate has fallen 64% from its 1963 peak, but the yearly gain is only 5.5% lower, 68.9 million against 72.9 million. The difference is the base: the same percentage applies to 8.30 billion people instead of 3.19 billion. The world’s fertility rate fell from 4.83 births per woman in 1970 to 2.23 in 2026, according to UN-based data, which lowers the growth rate, while the large generations already born keep the total rising.
Longer lives also add to the total: global life expectancy reached 73.3 years in 2024 and is projected to reach 77.4 years by 2054. The graph also hides a split between countries, since 63 countries holding 28% of the world’s people had already seen their populations peak by 2024. That lag is the subject of global population momentum, and the country-level figures sit on the world fertility rate page.
The result is a graph with a long, flat top. Between 2060 and 2080, the total moves from 9.989 billion to 10.283 billion, a gain of 294 million in 20 years, against 1.36 billion between 2026 and 2050. The 2084 peak is 24% above the 2026 level.
The World Population Graph Before 1950
UN estimates begin in 1950. Earlier points come from historical compilations, which carry wider uncertainty.
| Year | Population | Source basis |
|---|---|---|
| 200 | 190 million | Historical estimate |
| 1000 | 275 million | Historical estimate |
| 1804 | 1.0 billion | Historical estimate |
| 1850 | 1.2 billion | Historical estimate |
| 1900 | 1.6 billion | Historical estimate |
| 1927 | 2.0 billion | Historical estimate |
| 1950 | 2.49 billion | UN estimate |
The graph is almost flat for the first 1,800 years and then turns steeply upward. It took until 1804 to reach 1 billion people and 123 more years to reach 2 billion in 1927. The next doubling, from 2 to 4 billion, took 47 years (1927 to 1974), and the one after, from 4 to 8 billion, took 48 years (1974 to 2022).
The UN series has no further doubling: the peak of 10.29 billion is 1.24 times the 2026 total. Historical compilations disagree for the distant past. Estimates for 1900 range from 1.56 to 1.71 billion, and for 2000 from 6.06 to 6.15 billion, against the UN’s 6.17 billion. A fuller timeline is in the world population history article.
Competing Projection Graphs Disagree on the Peak
The UN medium graph is not the only forecast, and the gap between them is large by 2100.
| Source | Peak population | Peak year | Population in 2100 |
|---|---|---|---|
| UN World Population Prospects 2024 | 10.29 billion | 2084 | 10.2 billion |
| UN World Population Prospects 2022 | 10.43 billion | 2086 | 10.36 billion |
| Wittgenstein Centre | 10.1 billion | 2080 | 9.9 billion |
| IHME (Lancet, 2020) | 9.7 billion | 2064 | 8.8 billion |
The UN’s own 2100 figure has shifted with each revision: 10.1 billion and still growing in 2010, 10.9 billion in 2012 and 2019, 10.36 billion in 2022, and 10.2 billion in 2024. The latest revision lowered and advanced the peak because of lower-than-expected fertility in some of the largest countries, particularly China.
The gap between the UN and IHME for 2100 is about 1.4 billion people, and IHME’s own 95% interval reaches 11.8 billion at the top end. The UN estimates an 80% likelihood that the world’s population peaks within this century. Projections through 2050 are examined in world population by 2050, and the timing question in when the world population will peak.
What the Whole Graph Says
The world population graph is a story of a steep climb followed by a long flattening. Between 1950 and 2026, the total grew 3.3 times, the growth rate peaked at 2.28% in 1963, and the yearly gain peaked at 93.7 million in 1990. The UN medium projection has the line topping out at 10.29 billion in 2084 and sliding to 10.18 billion by 2100, with the yearly gain already down to 68.9 million and projected to reach 40.7 million in 2050. The firmest part of the graph is the next two or three decades, because most of the people who will be adults in 2050 are alive now.
The least certain part is the top. IHME’s 9.7 billion peak in 2064 and the UN’s 10.29 billion in 2084 differ by 1.4 billion people by 2100, and the UN has revised its own 2100 figure repeatedly. Whatever the path, the era of rapid growth is over, and the question is how high and how soon the line flattens, a question the future of world population analysis takes up.
Frequently Asked Questions
1. What does the world population graph show?
It shows total population, the annual growth rate, and the yearly gain from 1950 to 2100. The total rises from 2.49 billion in 1950 to a projected peak of 10.29 billion in 2084, while the growth rate falls from 2.28% in 1963 to zero in 2084 and the yearly gain peaks at 93.7 million in 1990.
2. What is the world population on the graph in 2026?
8.30 billion on 1 July 2026, according to the UN medium projection, up 68.9 million (0.83%) in the calendar year. That is 3.3 times the 1950 figure. The world population in 2026 page gives the year in more detail.
3. When was the world’s population growth rate highest?
In 1963, at 2.28% a year, when the world added 72.9 million people. The rate stayed above 2% in ten years between 1955 and 1970. By 2026, it has fallen to 0.83%, and the UN projects 0.42% in 2050.
4. When did the world add the most people in a single year?
In 1990, when the UN series shows a gain of 93.7 million people, from a base of 5.28 billion. The gain stayed above 80 million until 2019, fell to 63.7 million in 2021, and is projected at 40.7 million in 2050.
5. When does the world population graph peak?
In 2084 at 10.29 billion, in the UN medium variant. The gain falls to 0.5 million in 2083 and turns negative in 2084. Other projections put the peak earlier and lower: 9.7 billion in 2064 (IHME) and 10.1 billion in 2080 (Wittgenstein Centre).
6. Will the world population fall after the peak?
Slowly, in the UN medium variant. The total declines from 10.289 billion in 2084 to 10.180 billion in 2100, a loss of 109 million, or about 1.1%. The yearly loss reaches 12.9 million by 2100, a decline rate of 0.13%.
7. How many people have been added since 1950?
About 5.81 billion. The UN estimates 2.49 billion in 1950 and 8.30 billion in 2026. Almost all of that growth came after 1960, when the world had 3.02 billion people, and the yearly gain exceeded 80 million throughout 1980 to 2019.
8. Why do the UN and IHME graphs differ?
They assume different fertility paths. IHME’s 2020 study projects a peak of 9.7 billion in 2064 and 8.8 billion in 2100, while the UN’s 2024 revision projects 10.29 billion in 2084 and 10.2 billion in 2100. The 2100 gap is about 1.4 billion people.
9. Why does the graph dip in 2020 and 2021?
The yearly gain fell from 80.2 million in 2019 to 71.2 million in 2020 and 63.7 million in 2021, a period that coincides with the COVID-19 pandemic. It recovered to 70.5 million in 2023 but not to the 2019 level. The total still rose every year.
10. How long does it take the world population to double?
The last two doublings took 47 and 48 years: 2 to 4 billion from 1927 to 1974, and 4 to 8 billion from 1974 to 2022. The UN projection has no further doubling. A milestone list is on the world population timeline page.
Sources
- United Nations, Department of Economic and Social Affairs, Population Division. World Population Prospects 2024, medium variant, as tabulated by StatisticsTimes: World population 1950 to 2100 (1 January and 1 July values, net change, growth rate).
- Lam, David. The Next 2 Billion: Can the World Support 10 Billion People? Population and Development Review (2025).
- United Nations, Population Division. World Population Prospects 2024: Summary of Results (2024).
- Wikipedia. Estimates of historical world population (range of estimates for 1900 and 2000).