The UN puts the world population in 2000 at 6.17 billion, with China and India holding 37.7%, and Earth has since added 2.13 billion more people.
Key Takeaways
- The world population in 2000 was 6,171,702,993 on 1 July (UN), up 83.5 million or 1.35% in the year, and Earth has since grown 34.5% to 8.30 billion in 2026.
- China (1.27 billion) and India (1.06 billion) held 37.7% of the world in 2000, and ten countries had more than 100 million people, against 16 today.
- Asia held 60.7% of the world in 2000 and Africa 13.5%, but Africa has since grown 91% and now holds 19.1%, while 22 of the 154 countries with over 1 million people in 2000 have shrunk.
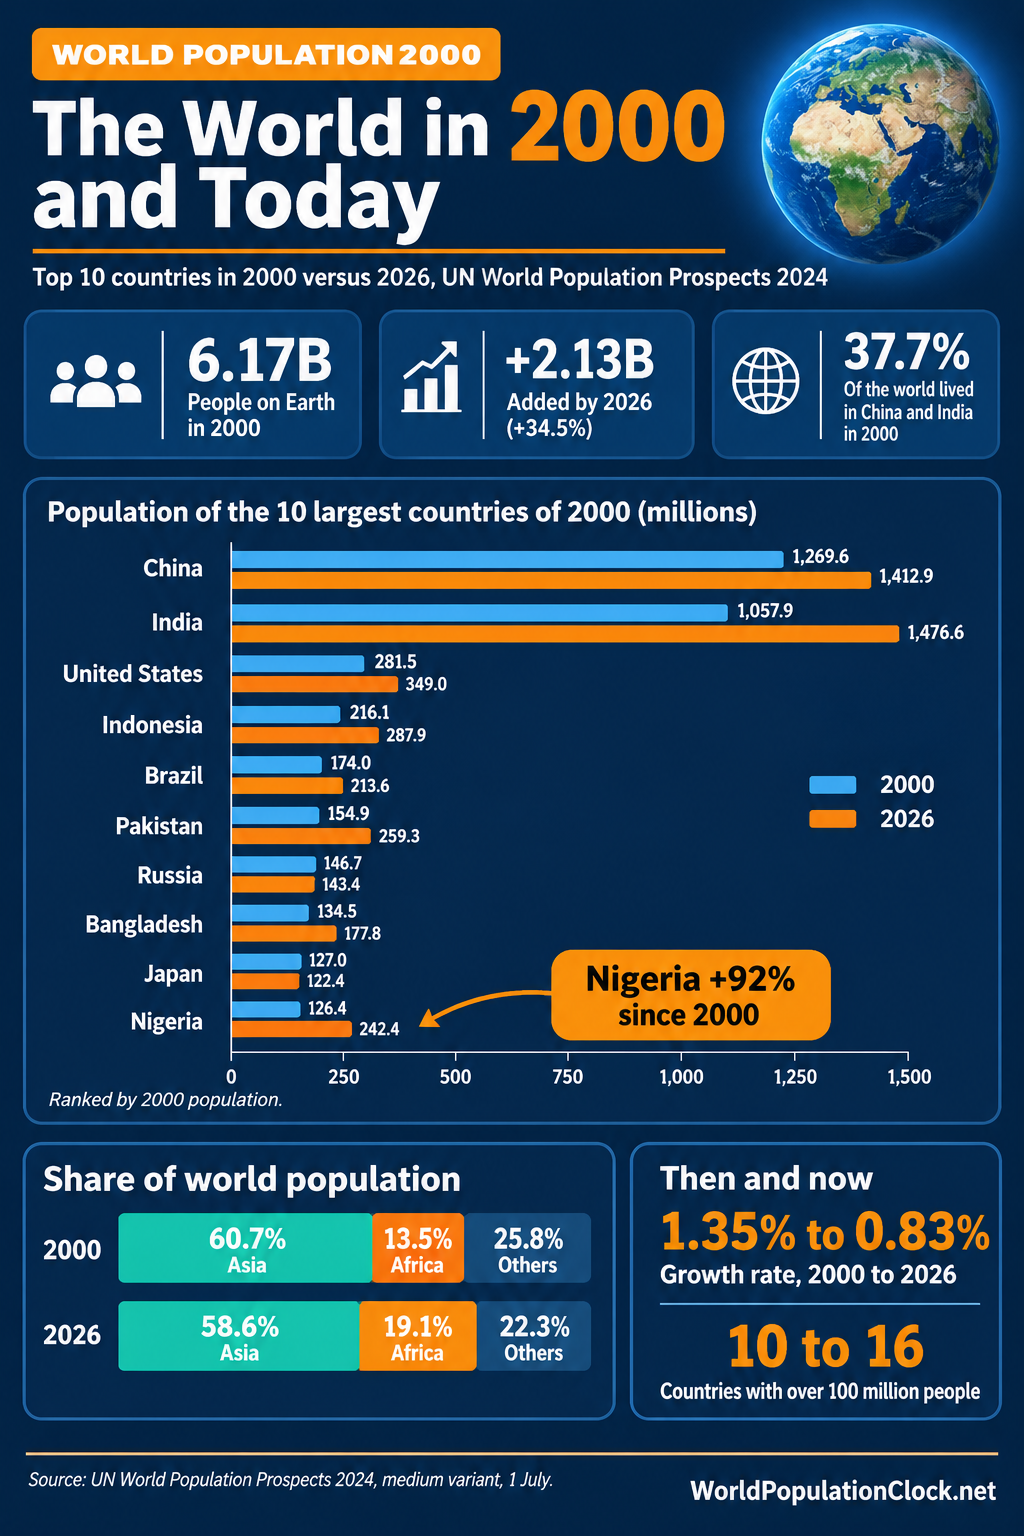
The world population in 2000 stood at 6,171,702,993 people on 1 July, according to the United Nations’ World Population Prospects 2024. That was 843.9 million more than in 1990, a decade gain of 15.8%, and the year itself added 83.5 million people, a growth rate of 1.35%. Earth has added 2.13 billion more since, reaching 8.30 billion in 2026. The longer record is set out on the world population growth trends page.
The year 2000 sits at a turning point in the data. Growth was already slowing from its 1990 peak, fertility had fallen to 2.75 births per woman, and the countries that would drive the next 26 years of growth, among them Nigeria, Pakistan, Ethiopia and DR Congo, were still far smaller than they are now. This article sets out the world population 2000 totals, the ranking of countries, the regional split, and how each compares with 2026.
All figures come from the UN’s 2024 revision, medium variant, with population levels on 1 July. Growth rates and yearly gains are UN calendar-year figures, so the 2000 gain is 83.5 million; a July-to-July difference gives 82.7 million, or 1.36%. Estimates for 2000 have been revised several times, and the section on why estimates differ shows how far.
World Population in 2000 at a Glance
| Metric | Figure | Year |
|---|---|---|
| Population (1 July) | 6,171,702,993 | 2000 |
| Population (1 January) | 6,129,943,964 | 2000 |
| Yearly gain | +83,518,059 | 2000 |
| Growth rate | 1.35% | 2000 |
| Gain over the previous decade | +843.9 million (+15.8%) | 1990 to 2000 |
| Share under 15 | 30.4% | 2000 |
| Share aged 65 and older | 6.8% | 2000 |
| Median age | 26.1 years | 2000 |
| Fertility rate | 2.75 births per woman | 2000 |
| Population density | 47 people per km² | 2000 |
The age structure was far younger than today’s. In 2000, 30.4% of people were under 15 and 6.8% were 65 or older. By 2024, the under-15 share had fallen to 24.7% and the 65-plus share risen to 10.2%. Median age is computed slightly differently by different providers: one UN-based series gives 26.1 years for 2000, and Worldometer gives 25.1, so compare figures within one series. Density has risen from 47 people per square kilometer of land in 2000 to 56 in 2026, and the fertility rate from 2.75 to 2.23, as the page on the world fertility rate shows by country.
From 5 Billion to 6 Billion and Beyond
The world crossed 6 billion people in 1998 in the UN’s 2024 series, at 6.007 billion on 1 July of that year. The UN marked 12 October 1999 as the Day of Six Billion at the time, but later revisions placed the crossing earlier, as Worldometer notes.
| Year | Population (billions) | Added since previous row (millions) | Growth between rows (%) |
|---|---|---|---|
| 1990 | 5.328 | n/a | n/a |
| 1995 | 5.759 | 431.1 | 8.1 |
| 1998 | 6.007 | 248.2 | 4.3 |
| 2000 | 6.172 | 164.6 | 2.7 |
| 2005 | 6.587 | 415.3 | 6.7 |
| 2010 | 7.022 | 434.8 | 6.6 |
| 2015 | 7.470 | 448.8 | 6.4 |
| 2020 | 7.887 | 416.5 | 5.6 |
| 2026 | 8.301 | 413.7 | 5.2 |
The 1990s added 843.9 million people, the 2000s 850.0 million, and the 2010s 865.3 million. The yearly gain fell to a low of 81.9 million in 1999, then rose to 83.5 million in 2000 and to a second peak of 91.3 million in 2012. The growth rate fell steadily across the period, from 1.76% in 1990 to 1.35% in 2000 and 0.83% in 2026. For earlier milestones, see the world population history.
Where People Lived in 2000 and the 20 Largest Countries
Two countries held 37.7% of the world in 2000. The ten largest held 59.8%, and the top 20 held 71.6%.
| Rank 2000 | Country | Population 2000 (millions) | Share of world (%) | Population 2026 (millions) | Change (%) | Rank 2026 |
|---|---|---|---|---|---|---|
| 1 | 🇨🇳 China | 1,269.6 | 20.57 | 1,412.9 | +11.3 | 2 |
| 2 | 🇮🇳 India | 1,057.9 | 17.14 | 1,476.6 | +39.6 | 1 |
| 3 | 🇺🇸 United States | 281.5 | 4.56 | 349.0 | +24.0 | 3 |
| 4 | 🇮🇩 Indonesia | 216.1 | 3.50 | 287.9 | +33.2 | 4 |
| 5 | 🇧🇷 Brazil | 174.0 | 2.82 | 213.6 | +22.7 | 7 |
| 6 | 🇵🇰 Pakistan | 154.9 | 2.51 | 259.3 | +67.4 | 5 |
| 7 | 🇷🇺 Russia | 146.7 | 2.38 | 143.4 | -2.3 | 9 |
| 8 | 🇧🇩 Bangladesh | 134.5 | 2.18 | 177.8 | +32.2 | 8 |
| 9 | 🇯🇵 Japan | 127.0 | 2.06 | 122.4 | -3.6 | 12 |
| 10 | 🇳🇬 Nigeria | 126.4 | 2.05 | 242.4 | +91.8 | 6 |
| 11 | 🇲🇽 Mexico | 98.6 | 1.60 | 133.0 | +34.9 | 11 |
| 12 | 🇩🇪 Germany | 81.8 | 1.33 | 83.6 | +2.3 | 19 |
| 13 | 🇵🇭 Philippines | 79.6 | 1.29 | 117.7 | +47.8 | 14 |
| 14 | 🇻🇳 Vietnam | 77.2 | 1.25 | 102.2 | +32.4 | 16 |
| 15 | 🇪🇬 Egypt | 73.1 | 1.18 | 120.1 | +64.3 | 13 |
| 16 | 🇪🇹 Ethiopia | 67.4 | 1.09 | 138.9 | +106.1 | 10 |
| 17 | 🇮🇷 Iran | 66.4 | 1.08 | 93.2 | +40.3 | 17 |
| 18 | 🇹🇷 Turkey | 65.4 | 1.06 | 87.9 | +34.4 | 18 |
| 19 | 🇹🇭 Thailand | 63.0 | 1.02 | 71.6 | +13.6 | 21 |
| 20 | 🇫🇷 France | 59.5 | 0.96 | 66.7 | +12.2 | 23 |
China led with 1,269.6 million people, 20.57% of the world, against India’s 1,057.9 million, a lead of 211.7 million that has reversed. India has been ahead since 2023, and the India vs China population comparison traces the change.
The United States was third with 281.5 million. Nigeria ranked tenth in 2000 and is sixth in 2026; Ethiopia moved from 16th to 10th, and Germany fell from 12th to 19th. Only ten countries had more than 100 million people in 2000, against 16 in 2026, a ranking explored on the largest population country page. The full list of countries is on the world population by country page.
Asia Held Three of Every Five People
Asia was home to 3.75 billion people in 2000 and Africa to 831 million. The remaining continents, Europe, the Americas and Oceania, held 1.59 billion between them.
| Region | Population 2000 (millions) | Share 2000 (%) | Population 2026 (millions) | Share 2026 (%) | Change (%) | Share of world growth (%) |
|---|---|---|---|---|---|---|
| Asia | 3,747.8 | 60.7 | 4,863.3 | 58.6 | +29.8 | 52.4 |
| Africa | 830.6 | 13.5 | 1,585.0 | 19.1 | +90.8 | 35.4 |
| Europe, Americas and Oceania | 1,593.3 | 25.8 | 1,852.4 | 22.3 | +16.3 | 12.2 |
| World | 6,171.7 | 100.0 | 8,300.7 | 100.0 | +34.5 | 100.0 |
Asia’s share has slipped from 60.7% to 58.6%, although the continent added 1,115 million people. Africa grew by 754 million, a 91% rise, and now supplies 35.4% of the world’s growth since 2000 from 13.5% of its people. The three-region split is used because UN figures for Europe, the Americas and Oceania individually could not be verified for this year. Asia held 54.9% of the world in 1950, so its share rose by almost six points in 50 years. The continents population page has the regional detail.
The World Population 2000 Compared With 2026 by Country
Between 2000 and 2026, the world added 2,129 million people. India supplied 19.7% of that, and the ten countries below supplied 54.1%.
| Rank | Country | Population 2000 (millions) | Population 2026 (millions) | Added (millions) | Change (%) | Share of world gain (%) |
|---|---|---|---|---|---|---|
| 1 | India | 1,057.9 | 1,476.6 | +418.7 | +40 | 19.7 |
| 2 | China | 1,269.6 | 1,412.9 | +143.3 | +11 | 6.7 |
| 3 | Nigeria | 126.4 | 242.4 | +116.0 | +92 | 5.5 |
| 4 | Pakistan | 154.9 | 259.3 | +104.4 | +67 | 4.9 |
| 5 | Indonesia | 216.1 | 287.9 | +71.8 | +33 | 3.4 |
| 6 | Ethiopia | 67.4 | 138.9 | +71.5 | +106 | 3.4 |
| 7 | United States | 281.5 | 349.0 | +67.6 | +24 | 3.2 |
| 8 | DR Congo | 50.5 | 116.5 | +65.9 | +131 | 3.1 |
| 9 | Egypt | 73.1 | 120.1 | +47.0 | +64 | 2.2 |
| 10 | Bangladesh | 134.5 | 177.8 | +43.3 | +32 | 2.0 |
Percentage growth tells a different story. Among countries with more than 1 million people in 2000, the fastest growth was in oil-rich Gulf states and in Africa.
| Rank | Country | Population 2000 (millions) | Population 2026 (millions) | Change (%) |
|---|---|---|---|---|
| 1 | United Arab Emirates | 3.5 | 11.6 | +231 |
| 2 | Kuwait | 2.0 | 5.1 | +161 |
| 3 | Chad | 8.5 | 21.6 | +153 |
| 4 | Niger | 11.5 | 28.8 | +150 |
| 5 | Oman | 2.3 | 5.7 | +149 |
| 6 | Angola | 16.2 | 40.2 | +148 |
| 7 | DR Congo | 50.5 | 116.5 | +131 |
| 8 | Somalia | 8.8 | 20.3 | +130 |
Twenty-nine countries with more than 1 million people in 2000, mostly in Africa, more than doubled. The UAE’s 231% rise reflects labor migration, and the other countries on the list grew through high fertility. Detailed rankings are on the fastest-growing populations page.
Countries That Shrank After 2000
Of the 154 countries with more than 1 million people in 2000, 22 had fewer people in 2026.
| Rank | Country | Population 2000 (millions) | Population 2026 (millions) | Change (millions) | Change (%) |
|---|---|---|---|---|---|
| 1 | Ukraine | 49.6 | 39.5 | -10.02 | -20.2 |
| 2 | Japan | 127.0 | 122.4 | -4.60 | -3.6 |
| 3 | Russia | 146.7 | 143.4 | -3.32 | -2.3 |
| 4 | Romania | 22.0 | 18.8 | -3.25 | -14.7 |
| 5 | Bulgaria | 8.0 | 6.7 | -1.33 | -16.7 |
| 6 | Moldova | 4.2 | 3.0 | -1.27 | -30.1 |
| 7 | Belarus | 10.0 | 8.9 | -1.05 | -10.6 |
| 8 | Serbia | 7.7 | 6.6 | -1.05 | -13.7 |
| 9 | Bosnia and Herzegovina | 4.2 | 3.1 | -1.05 | -25.1 |
| 10 | Greece | 10.8 | 9.9 | -0.89 | -8.2 |
Ukraine lost 10.0 million people, 20.2% of its 2000 population, the largest loss of any country. Japan, Russia and Romania each lost more than 3 million. In percentage terms, Moldova fell furthest, by 30.1%, followed by Bosnia and Herzegovina (25.1%), Latvia (22.5%), Ukraine and Lithuania (about 20% each). Most of the shrinking countries are in Eastern and Southern Europe, joined by Japan. The countries with declining populations page tracks the wider list.
Why Estimates of the World Population in 2000 Differ
The year 2000 has been revised repeatedly. An earlier UN estimate, published in a UN DESA paper on long-range projections, put India at 1,017 million in 2000, against 1,058 million in the 2024 revision.
| Country | Earlier UN estimate (millions) | UN 2024 revision (millions) | Difference (millions) |
|---|---|---|---|
| China | 1,275 | 1,270 | -5 |
| India | 1,017 | 1,058 | +41 |
| United States | 285 | 281 | -4 |
| Indonesia | 212 | 216 | +4 |
| Brazil | 172 | 174 | +2 |
| Russia | 146 | 147 | +1 |
| Pakistan | 143 | 155 | +12 |
| Bangladesh | 138 | 135 | -3 |
| Japan | 127 | 127 | 0 |
| Nigeria | 115 | 126 | +11 |
The largest revisions were upward for India (+41 million), Pakistan (+12 million) and Nigeria (+11 million), which moved Pakistan above Russia in the ranking. Global compilations show the same spread: estimates for the world population in 2000 range from 6.06 to 6.15 billion across older sources, against the UN’s current 6.17 billion. The 2024 revision’s country values add up to 6.170 billion, because a few small territories are not listed separately. This article uses the 2024 revision throughout.
What the 2000 Count Shows
The world population in 2000 was 6.17 billion, and the main lesson is how much of the next 2.13 billion was already visible. Asia held 60.7% of people and added 1.12 billion, but Africa grew 91% and lifted its share from 13.5% to 19.1%. India added 418.7 million, Nigeria nearly doubled from 126 million to 242 million, and the growth rate fell from 1.35% to 0.83%.
At the same time, 22 countries with more than 1 million people in 2000 shrank, led by Ukraine, Japan, Russia and Romania. The firmest figures are the world total and the biggest countries, where the UN estimate for 2000 has been stable to within a few percent. The least stable are the individual revisions, which moved India by 41 million between UN editions. The shift from fast growth in Asia to fast growth in Africa is the lasting change, and it continues in the projections set out in the future of world population.
Frequently Asked Questions
1. What was the world population in 2000?
6,171,702,993 on 1 July 2000, according to the UN’s 2024 revision, or about 6.17 billion. Some older compilations give a range of 6.06 to 6.15 billion. Earth added 83.5 million people during the year, a growth rate of 1.35%.
2. How much has the world population grown since 2000?
By 2.13 billion, or 34.5%, from 6.17 billion in 2000 to 8.30 billion in 2026. The yearly gain has fallen from 83.5 million in 2000 to 68.9 million in 2026, and the growth rate has fallen from 1.35% to 0.83%. The world population in 2026 page gives the current figures.
3. Which country had the largest population in 2000?
China, with 1,269.6 million people, or 20.57% of the world. India was second with 1,057.9 million and the United States third with 281.5 million. India overtook China in 2023, and in 2026 India has 1,476.6 million people against China’s 1,412.9 million.
4. How many people lived in Asia in 2000?
About 3.75 billion, or 60.7% of the world. Africa had 831 million people (13.5%), and Europe, the Americas and Oceania together had 1.59 billion (25.8%). By 2026, Asia’s share was 58.6% and Africa’s 19.1%.
5. How fast was the world population growing in 2000?
At 1.35% a year, or 83.5 million people, according to the UN calendar-year series. That was down from 1.76% in 1990 and is above 0.83% in 2026. The yearly gain was 81.9 million in 1999, its low point for the decade.
6. When did the world reach 6 billion people?
In 1998, in the UN’s 2024 revision, which has 6.007 billion on 1 July 1998. The UN had marked 12 October 1999 as the Day of Six Billion, but later revisions moved the crossing earlier. The 7 billion mark followed in 2010.
7. Which countries grew fastest between 2000 and 2026?
In percentage terms among countries with over 1 million people in 2000, the UAE (+231%), Kuwait (+161%), Chad (+153%), Niger (+150%), and Oman (+149%). In absolute terms, India added the most, 418.7 million, then China (143.3 million), Nigeria (116.0 million), and Pakistan (104.4 million).
8. Which countries had fewer people in 2026 than in 2000?
Twenty-two of the 154 countries with over 1 million people in 2000. Ukraine lost the most, 10.0 million (20.2%), followed by Japan (4.6 million), Russia (3.3 million), and Romania (3.3 million). Moldova fell furthest in percentage terms, by 30.1%.
9. What was the median age of the world in 2000?
About 26 years, 26.1 in one UN-based series and 25.1 in another. Worldometer lists 31.1 years for 2026, so the median age rose by about five to six years in 26 years. Under-15s were 30.4% of the world in 2000 and over-65s 6.8%.
10. How many countries had more than 100 million people in 2000?
Ten: China, India, the United States, Indonesia, Brazil, Pakistan, Russia, Bangladesh, Japan, and Nigeria. By 2026, there are 16, with Mexico, Ethiopia, Egypt, the Philippines, DR Congo and Vietnam added, while Japan has slipped to 12th place.
Sources
- United Nations, Department of Economic and Social Affairs, Population Division. World Population Prospects 2024, medium variant, as tabulated by StatisticsTimes: World population 1950 to 2100.
- United Nations Statistics Division. Demographic Yearbook 2024, Table 1: population by region, 1970 to 2024.
- United Nations, Department of Economic and Social Affairs. Countries accounting for 75 per cent of the world population in 2000, 2050, 2100, 2200 and 2300 (earlier estimate for 2000).
- Wikipedia. Estimates of historical world population (range of estimates for 2000).