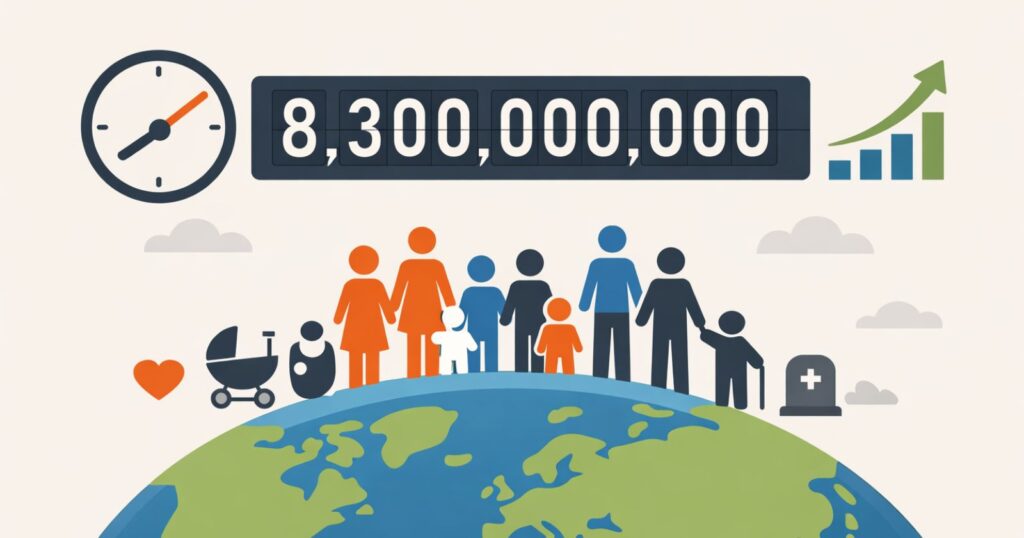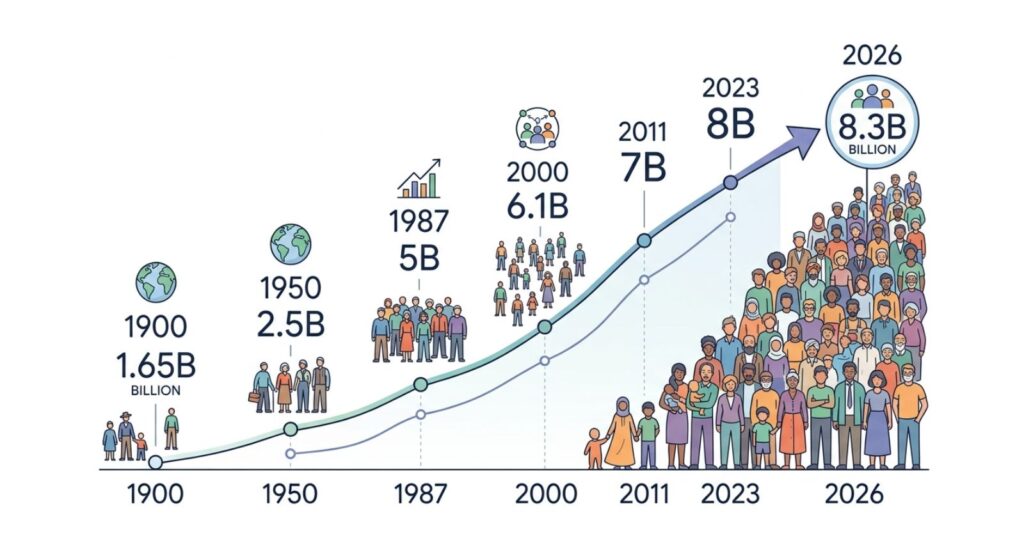
The numbers tell a story of profound transformation. In 1900 the world held about 1.65 billion people. By 1950 that figure climbed to around 2.5 billion. The count passed 6.17 billion at the turn of the millennium and stands near 8.3 billion in 2026. Such expansion did not occur evenly or gradually. Instead, growth rates accelerated sharply through much of the 20th century before beginning a measured slowdown.
This pace reflects shifts far beyond simple counts. Death rates dropped as sanitation improved, food production scaled, and medical knowledge spread. Birth rates stayed elevated longer in many regions, creating a surge that added billions within single lifetimes. The result reshaped economies, cities, and resource demands on a global scale. Understanding these specific benchmarks from 1900, 1950, 2000, and 2026 puts the speed of change into perspective.
World population growth in the 20th century stands out because earlier centuries saw far slower increases. From the start of the Common Era until roughly 1800, total numbers grew modestly, often held in check by famine, disease, and limited agricultural output. The 1900 figure of 1.65 billion already marked a departure from that long stability. Yet the real acceleration arrived later.
Population Figures at Key Points
Reliable estimates place world population near 1.65 billion in 1900. By 1950 the total reached approximately 2.5 billion. The year 2000 recorded 6.17 billion. Projections and current estimates for mid-2026 put the figure at 8.3 billion. These anchor points capture distinct phases: modest early-century gains, postwar explosion, late-century peak velocity, and the present tapering.
Annual growth rates provide sharper insight. Early in the century, rates hovered below 1 percent in many places. By the late 1960s the global rate exceeded 2 percent per year at its height. That peak translated into rapid absolute gains even as percentages later declined. The shift from 2.5 billion in 1950 to over 6 billion by 2000 occurred in half a century, a doubling time without precedent.
What Drove the Surge After 1900
Several converging forces explain why numbers rose so quickly. Improvements in public health and sanitation reduced deaths from infectious diseases. Clean water systems, sewage management, and basic hygiene practices spread in urban centers and gradually reached wider populations. These changes lowered infant and child mortality first, allowing more people to survive into adulthood.
Agricultural advances played a parallel role. The spread of better farming techniques, crop varieties, and eventually synthetic fertilizers increased food availability. Fewer people faced chronic hunger or famine on the scale seen in prior eras. Combined with expanded trade networks, these gains supported larger populations even in regions with limited arable land.
Medical breakthroughs amplified the effect. Vaccines, antibiotics, and treatments for common killers extended life expectancy. Global average life expectancy rose from around 48 years in the early 1950s to higher levels by the end of the century. Fewer deaths at young ages meant more individuals lived long enough to have families of their own.
Fertility patterns sustained the momentum. In many parts of the world, cultural, economic, and social norms favored larger families. High birth rates persisted while death rates fell, producing natural increase on a massive scale. This imbalance defined the demographic transition in country after country during the 20th century.
Urbanization accompanied and reinforced these trends. Cities offered jobs, services, and new opportunities, drawing people from rural areas. Urban environments often saw faster adoption of health practices and education, though they also introduced new challenges related to density and infrastructure.
Growth Between 1900 and 1950
The first half of the century added roughly 850 million people. From 1.65 billion to 2.5 billion represents steady but not explosive expansion by later standards. Wars, economic upheaval, and lingering high mortality in many regions tempered the pace. Still, foundations for faster growth took shape.
Sanitation reforms and early public health campaigns began to curb diseases such as cholera and typhoid in parts of Europe and North America. Colonial administrations and missionary efforts introduced some medical practices elsewhere, though coverage remained uneven. Agricultural output grew through mechanization in certain areas and expanded cultivation.
Life expectancy edged upward, but global averages stayed modest. Infant mortality rates remained high compared with today. The period set the stage: mortality began its long decline while fertility stayed relatively stable.
Acceleration from 1950 to 2000
The second half of the century witnessed the most dramatic rise. From 2.5 billion in 1950 the total more than doubled to 6.17 billion by 2000. Absolute annual additions climbed into the 80-million range at times. This phase marks the height of modern population growth.
Postwar recovery, international aid programs, and the green revolution boosted food security across Asia and Latin America. Vaccines against smallpox, polio, and other diseases reached wider populations. Antibiotics became widely available. Child survival rates improved markedly.
Fertility remained high in developing regions. Many countries recorded total fertility rates well above five or six children per woman. Even as some nations began fertility transitions, the global base of young people entering reproductive years kept numbers climbing.
The result was a cascade of billion-person milestones reached at shortening intervals: 3 billion around 1960, 4 billion in 1974, 5 billion in 1987, and 6 billion near the end of 1999. Each increment arrived faster than the last.
Trends from 2000 to 2026
Growth continued after 2000 but at a decelerating rate. The total advanced from 6.17 billion to roughly 8.3 billion by 2026, an addition of more than 2 billion in a little over two decades. Annual growth rates fell below 1 percent in recent years, yet absolute increases still exceed 60 million people annually because the base population is so large.
Fertility declines in many large countries drove the slowdown. China’s one-child policy and subsequent shifts, along with broader access to education and family planning in India, Latin America, and parts of Africa, lowered birth rates. Life expectancy continued to rise, but aging populations in some regions began to influence overall dynamics.
Sub-Saharan Africa emerged as the primary region sustaining higher growth rates. Elsewhere, many countries saw fertility drop toward or below replacement levels. These regional differences mean future additions will concentrate in specific areas while others stabilize or decline.
Comparative Data on World Population Growth
The following table summarizes population totals and approximate annual growth characteristics across the benchmark years.
| Year | Estimated Population | Approximate Prior Decade Growth Rate | Key Context |
|---|---|---|---|
| 1900 | 1.65 billion | Under 1% annually | Pre-modern medicine dominance, limited global sanitation |
| 1950 | 2.5 billion | Around 1% | Postwar recovery, early health gains |
| 2000 | 6.17 billion | Peaked near 2% mid-century | Green revolution, widespread vaccines and antibiotics |
| 2026 | 8.3 billion | Below 1% currently | Fertility declines in major economies, continued growth in select regions |
Data drawn from United Nations World Population Prospects and aligned historical compilations. Growth rates represent averages or peaks within surrounding periods rather than exact single-year figures.
Regional Variations in Growth Patterns
No single narrative captures every part of the world. Europe and North America experienced earlier mortality declines tied to the Industrial Revolution. Their populations grew steadily but later entered fertility transitions that slowed expansion.
Asia, home to the largest share of humanity, saw massive absolute gains. India and China together accounted for a substantial portion of the 20th-century increase. Rapid postwar growth in both nations reflected improved survival rates amid still-high fertility.
Latin America followed a similar path, with urbanization and health improvements fueling expansion until fertility began falling in later decades.
Africa entered the fastest growth phase later. Many sub-Saharan countries maintained high fertility longer while benefiting from sharp drops in child mortality. This combination produces continued rapid increase even as global rates moderate.
These differences matter for planning. Resource demands, education systems, and labor markets face distinct pressures depending on age structures and growth momentum in each region.
Demographic Transition and Its Stages
The classic demographic transition model outlines four stages. High birth and death rates characterize the first. Death rates fall in the second while births stay elevated, producing rapid growth. Fertility decline defines the third stage, slowing net increase. Low birth and death rates mark the fourth, often leading to stability or modest decline.
Most of the world moved through the second and into the third stage during the 20th century. The timing varied widely. Northern and Western Europe completed much of the transition earlier. Many developing nations accelerated through mortality improvements in the mid-20th century but entered fertility decline later.
The global growth surge largely reflects the lag between falling deaths and falling births. As more countries complete the transition, overall rates moderate.
Impact on Society and Resources
Rapid population growth influenced nearly every domain. Cities expanded at unprecedented speed. Global urban population share rose dramatically, from roughly 30 percent in 1950 toward higher levels today. Infrastructure, housing, and services struggled to keep pace in many places.
Food systems scaled through technological innovation. The green revolution prevented widespread famine despite billions more mouths to feed. Yet challenges around soil health, water use, and distribution persist.
Education and health systems expanded to serve larger cohorts of young people. Gains in literacy and life expectancy stand among the clearest positive outcomes. At the same time, youth bulges in high-growth regions created pressure on job markets.
Environmental systems felt the strain. Expanded agriculture, energy demand, and settlement patterns altered landscapes and ecosystems. Carbon emissions and resource extraction rose in tandem with human numbers and economic activity.
Why Growth Rates Eventually Slowed
Fertility decline drives the current moderation. Access to education, especially for girls and women, correlates strongly with smaller family sizes. Urban living raises the costs of child-rearing. Greater female workforce participation and changing social norms also play roles.
Economic development tends to accompany these shifts. As incomes rise and social safety nets strengthen, parents invest more in fewer children rather than relying on large families for labor or old-age support.
Policy interventions in some countries accelerated change. Family planning programs, though controversial in certain contexts, expanded contraceptive access. Public messaging and economic incentives influenced behavior in places like China and parts of Southeast Asia.
Even with lower rates, momentum from a large base of young adults keeps absolute numbers rising for decades. This built-in lag explains why totals continue upward even as percentages fall.
Challenges and Opportunities Ahead
Current trends point toward a global peak sometime in the second half of the century, according to United Nations medium-variant projections. The precise timing and level depend on fertility paths in high-growth regions.
Societies face questions around aging populations in low-fertility areas. Labor shortages, pension systems, and healthcare demands shift as working-age cohorts shrink relative to retirees. Immigration and productivity gains offer partial offsets.
In high-fertility regions, investments in education, health, and economic opportunity can turn demographic momentum into a dividend. Young populations represent potential for innovation and growth when equipped with skills and jobs.
Resource management grows more critical. Sustainable agriculture, renewable energy, and efficient urban design become essential to support 8 billion and beyond without excessive environmental cost.
World Population Growth in Context
The span from 1.65 billion in 1900 to 8.3 billion in 2026 compresses extraordinary change into little more than a century. Earlier humanity required thousands of years to reach the first billion. Recent decades added billions in intervals measured by single generations.
This pace resulted from concrete advances in health, food production, and living conditions rather than abstract forces. Death rates fell faster than birth rates for an extended period, creating the surge. Subsequent fertility adjustments are now rebalancing the equation.
The story is neither purely celebratory nor cautionary. Billions of people gained the chance to live longer, healthier lives. At the same time, the scale of human presence tests planetary systems in new ways. Policy, technology, and individual choices will shape how the next chapters unfold.
Key Conclusion and Analysis
The trajectory from 1.65 billion in 1900 through 2.5 billion in 1950, 6.17 billion in 2000, and 8.3 billion in 2026 captures one of the most significant shifts in human history. Each era built on prior gains in survival and productivity. The slowing pace today reflects successful adaptation in family size and opportunity across diverse societies.
Attention now turns to equipping current and future generations with the tools to thrive within sustainable bounds while addressing the varied demographic realities that define different parts of the world. The numbers reveal both the scale of past achievement and the practical choices that will determine the quality of life for billions in the decades ahead.
FAQ
What was the world population in 1900?
Estimates place the world population at approximately 1.65 billion in 1900. This figure reflects gradual growth from earlier centuries, still constrained by higher mortality and limited agricultural reach compared with later periods.
How did world population change from 1900 to 1950?
Numbers rose from 1.65 billion to about 2.5 billion. Improvements in sanitation, early medical practices, and agricultural output supported the increase, though wars and uneven development kept the pace moderate by 20th-century standards.
What was the world population in 1950?
The total stood near 2.5 billion. This benchmark marks the start of the most rapid expansion phase as health interventions spread more widely after World War II.
How fast did world population grow between 1950 and 2000?
The population more than doubled from 2.5 billion to 6.17 billion. Annual growth rates peaked above 2 percent, fueled by sharp declines in child mortality and sustained fertility levels across much of the developing world.
What was the world population in 2000?
Records show approximately 6.17 billion people. This total reflected the cumulative effect of postwar health and food production gains.
What is the projected world population in 2026?
Current estimates place the figure around 8.3 billion in 2026. Growth continues but at a slower annual percentage rate than in previous decades.
Why did world population grow so quickly in the 20th century?
Falling death rates from better sanitation, vaccines, antibiotics, and nutrition outpaced fertility declines for decades. This gap produced high natural increase across many regions.
When did world population growth rates peak?
Global annual growth rates reached their highest levels around the late 1960s, exceeding 2 percent before beginning a long-term decline as fertility fell in more countries.
How do regional growth patterns differ today?
Sub-Saharan Africa maintains relatively higher fertility and growth rates. Many Asian and Latin American countries show slower expansion or near-stabilization. Europe and parts of East Asia face low fertility and aging populations.
Will world population keep growing indefinitely?
Most projections indicate continued increase for several more decades, followed by a peak and potential gradual stabilization or decline. Outcomes depend heavily on fertility trends in regions that still have higher birth rates.