Published estimates put the world population in 1900 between 1.55 and 1.71 billion, about a fifth of today’s 8.30 billion, with China and India holding 44%.
Key Takeaways
- The world population in 1900 was about 1.65 billion (UN compilation), within a published range of 1.55 to 1.71 billion, so Earth has since grown about five times to 8.30 billion in 2026.
- China (400 million) and India (284.5 million) held 44% of the world in 1900, and Asia held about 57%, while Sub-Saharan Africa held 5.6% of people and now holds 15%.
- Growth in the decades before 1900 ran at roughly 0.65% a year, and global life expectancy was only 32 years, compared with 73 in 2023.
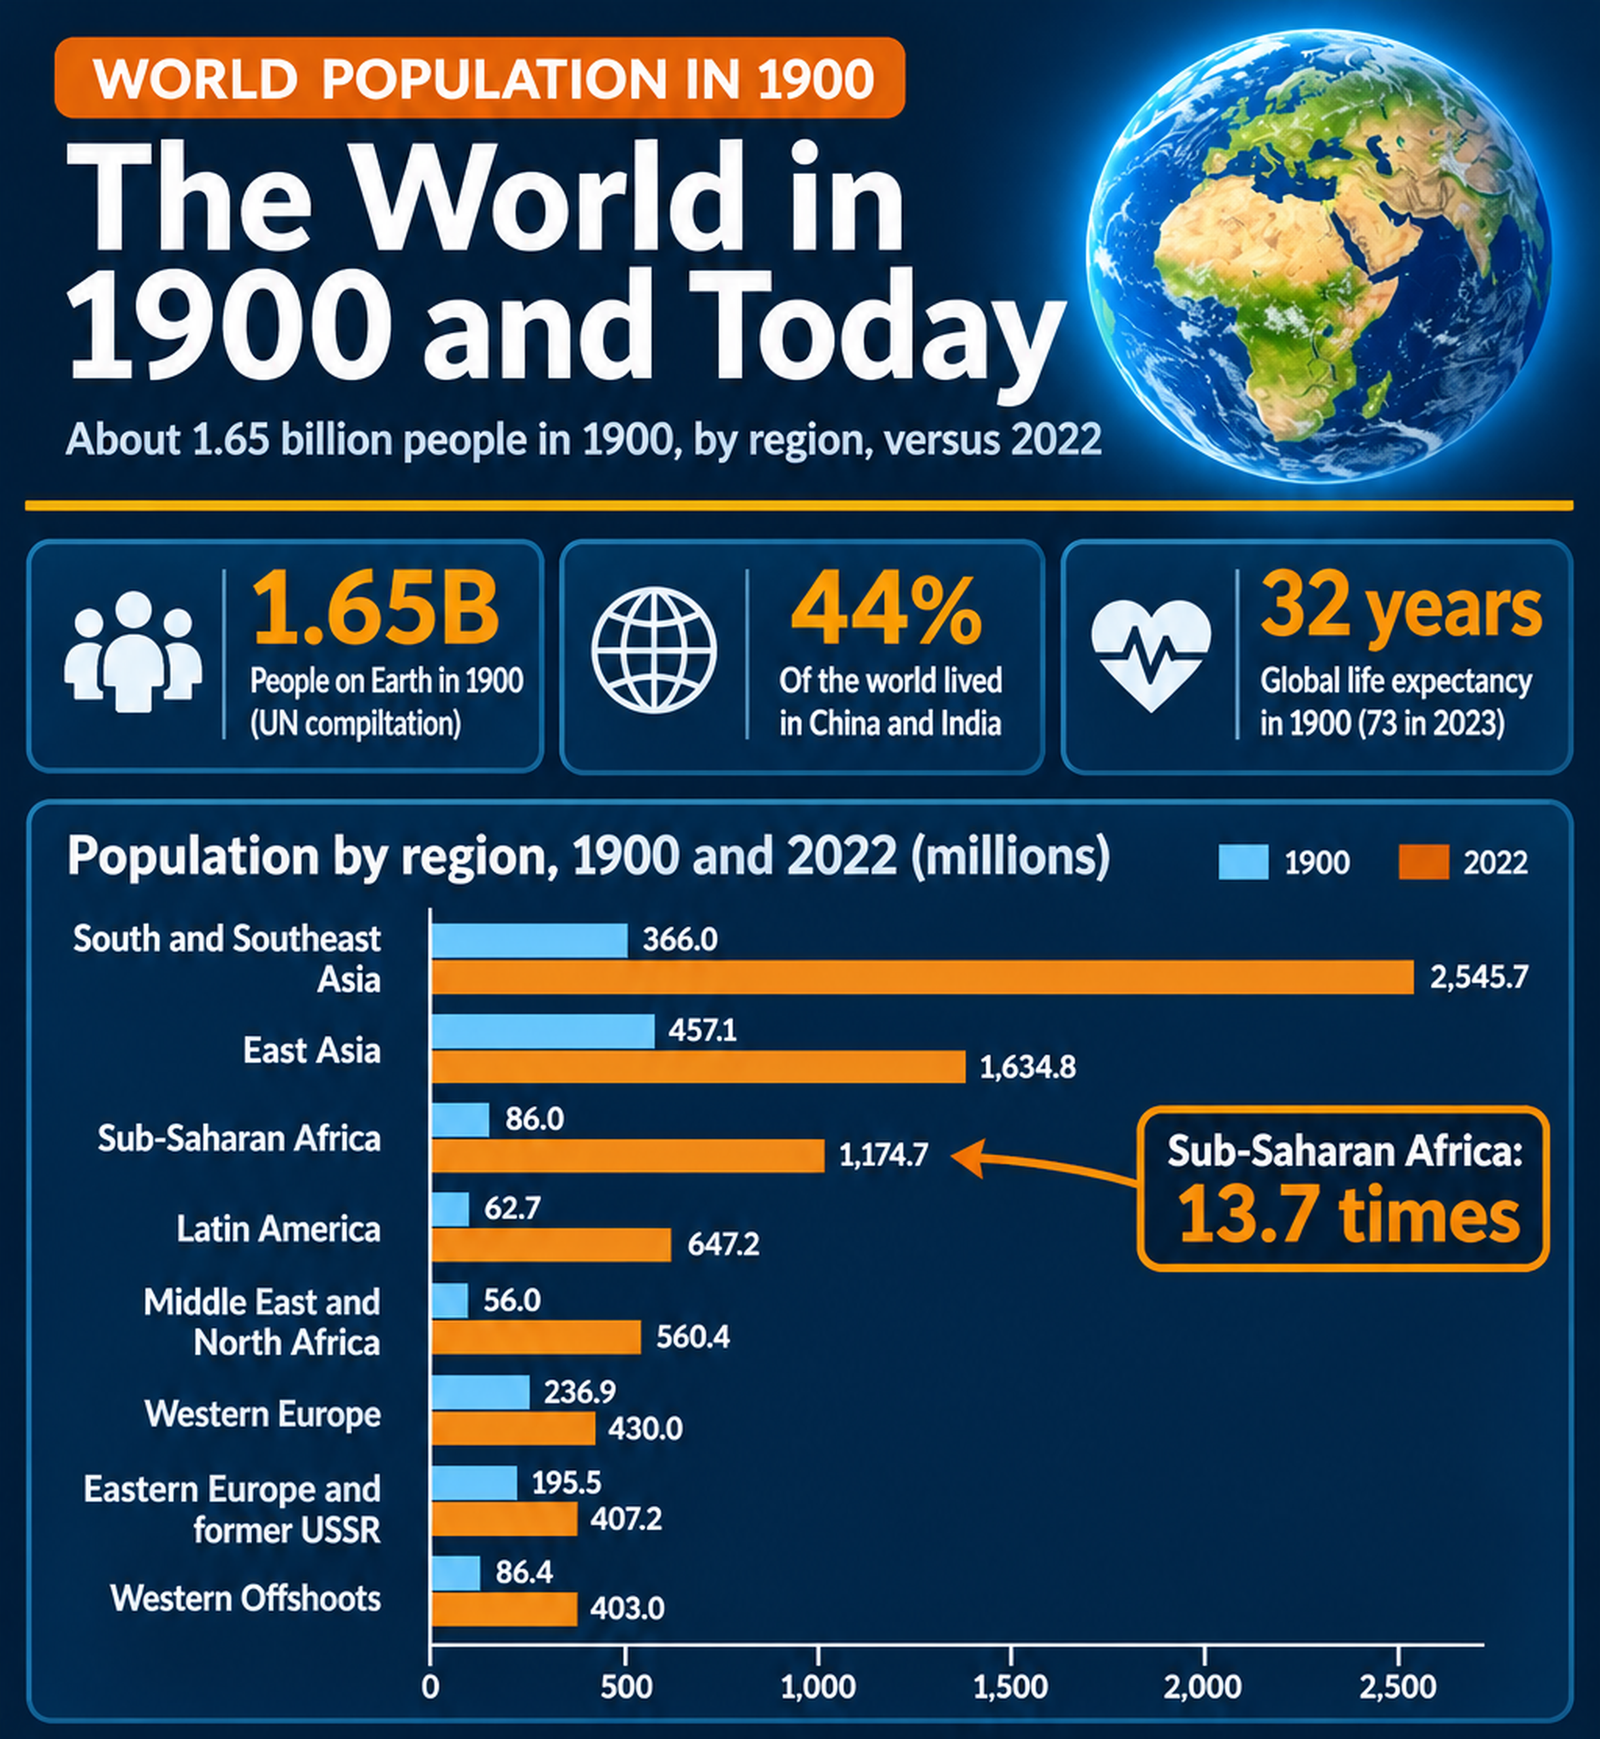
The world population in 1900 was about 1.65 billion people, according to the United Nations’ compilation of historical estimates, and the figure is uncertain by about 10%. Nine of the ten published estimates fall between 1.55 and 1.67 billion, and a tenth runs as high as 1.71 billion. The number matters because 1900 sits at the start of the century that multiplied the population five times: the world of 2026 holds 8.30 billion people, and India alone, at 1.48 billion, has nearly as many people as the entire planet had in 1900.
Nobody counted everyone in 1900. Censuses covered Europe, the United States and parts of the British Empire, while China, much of Africa and large parts of Asia relied on tax records and estimates. The UN’s own population database begins in 1950, so every 1900 figure here comes from compilations by historians and demographers. For the longer series, see the world population growth trends page.
This article sets out the range of estimates, the growth curve that led to 1900, where people lived, the largest countries, and why the numbers differ. Regional and country values come from the Maddison Project’s 2023 update as tabulated in the Wikipedia compilation of historical estimates. They use present-day borders, and for eight countries (Algeria, Egypt, Iran, Iraq, Morocco, South Africa, Tunisia and Turkey) the 1913 figure stands in for 1900.
Estimates of the World Population in 1900 Range From 1.55 to 1.71 Billion
Ten published estimates exist for 1900, and they differ by 163 million people between the lowest and the highest.
| Source (publication year) | World population 1900 (millions) | Difference from UN (%) |
|---|---|---|
| Durand (1974) | 1,650 to 1,710 | 0 to +3.6 |
| Clark (1967) | 1,668 | +1.1 |
| Population Reference Bureau (1973 to 2016) | 1,656 | +0.4 |
| HYDE database (2010) | 1,654 | +0.2 |
| United Nations compilation (2015) | 1,650 | 0.0 |
| Gapminder | 1,645 | -0.3 |
| Biraben (1980) | 1,633 | -1.0 |
| McEvedy and Jones (1978) | 1,625 | -1.5 |
| Thomlinson (1975) | 1,600 | -3.0 |
| Maddison (2010 and 2023) | 1,547 | -6.2 |
Seven of the nine single-value estimates fall between 1,625 and 1,668 million, and their average is 1,631 million. Maddison’s figure of 1,547 million is the outlier, 103 million below the UN compilation. Another compilation, Johnston’s Archive, gives 1,671 million. The summary range quoted in the Wikipedia compilation is 1,560 to 1,710 million, and Maddison’s 2023 update sits just below it. This article uses the UN’s 1,650 million as its central figure.
The Growth Curve That Reached 1900
Growth before 1900 was slow by modern standards, and it was accelerating. The table uses the Maddison series, which gives one consistent set of numbers from 1820 to 2022.
| Year | Population (millions) | Added since previous row (millions) | Average annual growth (%) |
|---|---|---|---|
| 1820 | 1,042.0 | n/a | n/a |
| 1870 | 1,272.0 | 230.0 | 0.40 |
| 1900 | 1,546.5 | 274.5 | 0.65 |
| 1950 | 2,518.2 | 971.7 | 0.98 |
| 1975 | 4,052.5 | 1,534.3 | 1.92 |
| 2000 | 6,047.9 | 1,995.4 | 1.61 |
| 2022 | 7,802.0 | 1,754.1 | 1.16 |
Between 1870 and 1900, the world added 274.5 million people, a growth rate of 0.65% a year, and published summaries put the average over the whole 19th century at 0.5% to 0.6%. The next 50 years added 971.7 million, and the 25 years from 1950 to 1975 added 1.53 billion. The UN’s 2024 series, which starts in 1950, shows the scale of the acceleration: the world added 1.65 billion people between 1950 and 1976, as many as lived on Earth in 1900.
On the UN’s 1900 figure, the population doubled to about 3.3 billion by roughly 1965, and doubled again to about 6.6 billion by around 2006. The later years of the curve are charted in the world population history article.
Maddison’s 2000 figure of 6,048 million is below the UN’s 6,172 million for the same year, which shows that the gap between sources did not disappear after 1900. Lives were also short in 1900. Global life expectancy at birth was 32 years in 1900 and 73 in 2023, according to Our World in Data’s compilation of long-run mortality estimates.
Where People Lived in 1900
Asia and Europe held about four of every five people in 1900. The table shows eight regions in 1900, 1950, 2000, and 2022.
| Region | 1900 (millions) | Share 1900 (%) | 1950 (millions) | 2000 (millions) | 2022 (millions) | Share 2022 (%) | Growth 1900 to 2022 |
|---|---|---|---|---|---|---|---|
| East Asia | 457.1 | 29.6 | 670.4 | 1,483.7 | 1,634.8 | 21.0 | 3.6 times |
| South and Southeast Asia | 366.0 | 23.7 | 652.0 | 1,889.9 | 2,545.7 | 32.6 | 7.0 times |
| Western Europe | 236.9 | 15.3 | 304.9 | 390.2 | 430.0 | 5.5 | 1.8 times |
| Eastern Europe and former USSR | 195.5 | 12.6 | 266.9 | 407.5 | 407.2 | 5.2 | 2.1 times |
| Western Offshoots (US, Canada, Australia, New Zealand) | 86.4 | 5.6 | 176.5 | 335.7 | 403.0 | 5.2 | 4.7 times |
| Sub-Saharan Africa | 86.0 | 5.6 | 178.9 | 652.5 | 1,174.7 | 15.1 | 13.7 times |
| Latin America | 62.7 | 4.1 | 164.2 | 512.7 | 647.2 | 8.3 | 10.3 times |
| Middle East and North Africa | 56.0 | 3.6 | 103.8 | 375.7 | 560.4 | 7.2 | 10.0 times |
| World | 1,546.5 | 100.0 | 2,518.2 | 6,047.9 | 7,802.0 | 100.0 | 5.0 times |
Region values are rounded, so they may not add exactly to the world row. East Asia and South and Southeast Asia together held 53.3% of the world, and the two European regions 27.9%. Sub-Saharan Africa, with 5.6% of people, has grown 13.7 times since, and now holds 15.1%, the fastest multiple of any region, while Western Europe has grown only 1.8 times and its share has fallen from 15.3% to 5.5%.
Johnston’s Archive uses continents instead, and gives Asia 947 million (56.7%), Europe 429 million (25.7%), Africa 133 million (8.0%), Latin America 74 million, North America 82 million and Oceania 6 million. By UN 2026 figures, Africa has grown about twelvefold since then and Europe about 1.7 times, to 9.0% of the world. The continents population page gives today’s split.
The Largest Countries in 1900
China and India dominated the list in 1900, as they do now, but the rest of the top ten looked different.
| Country | 1900 (millions) | Share of world 1900 (%) | 2000 (millions) | 2022 (millions) | Growth 1900 to 2022 |
|---|---|---|---|---|---|
| China | 400.0 | 25.9 | 1,258.7 | 1,401.7 | 3.5 times |
| India | 284.5 | 18.4 | 1,018.7 | 1,349.1 | 4.7 times |
| Former USSR | 124.5 | 8.1 | 288.7 | 294.4 | 2.4 times |
| United States | 76.3 | 4.9 | 282.2 | 333.3 | 4.4 times |
| Germany | 54.4 | 3.5 | 81.5 | 83.8 | 1.5 times |
| Indonesia | 45.1 | 2.9 | 211.4 | 273.4 | 6.1 times |
| Japan | 44.1 | 2.9 | 126.8 | 124.8 | 2.8 times |
| United Kingdom | 41.2 | 2.7 | 59.2 | 68.1 | 1.7 times |
| France | 40.6 | 2.6 | 60.8 | 68.3 | 1.7 times |
| Italy | 33.7 | 2.2 | 57.0 | 59.0 | 1.8 times |
China and India together held 44.3% of the world on the Maddison figures, against 34.8% in 2026 on UN figures. Germany, the United Kingdom, France and Italy each ranked among the ten largest, a position none of them holds now. The largest population country page covers the current ranking, and the India vs China population comparison traces how the two giants have moved.
Counting method changes the list. A compilation that counts colonial empires puts Qing China at 400 million (23.5% of a 1,700 million world), the Russian Empire at 136.3 million, the United States and its territories at 78.8 million, and the German Empire, with its colonies, at 67.6 million.
Germany itself had 54.4 million on modern borders. Other countries with large increases since 1900 include Mexico (13.6 to 125.2 million, 9.2 times), Egypt (12.1 to 110.6 million, 9.1 times) and Turkey (15.0 to 87.2 million, 5.8 times), the last two using 1913 figures for 1900.
Why Estimates for 1900 Differ
Four things drive the 163 million gap between the lowest and highest estimates. First, coverage: complete censuses were rare outside Europe and parts of the Americas, and figures for much of Asia and Africa rest on administrative records and informed estimates. A 2023 paper in the Journal of Economic History by Timothy Guinnane argues, in its title, that we do not know the population of every country for the past two thousand years.
Second, borders: the Russian, Ottoman, Austro-Hungarian, and colonial empires have to be mapped onto present-day countries. Third, method: HYDE, Maddison and the others reconstruct the numbers differently, and Maddison’s figure of 1,547 million is 6.2% below the UN compilation. Fourth, revisions: Maddison’s database was updated in 2010 and again in 2023, and the 1900 figure has stayed near 1,547 million, but the country detail changed.
Present-day estimates carry uncertainty too. The US Census Bureau, the Population Reference Bureau, and the UN gave 2012 world totals about 0.8% apart, and published summaries describe estimates as uncertain by 3% to 5% even for current population counts. For 1900, the uncertainty is about 10%, which is why a single number should be read as a central estimate. The world population timeline shows how the milestones follow from it.
What 1900 Tells Us About the Century After
The world of 1900 was about 1.65 billion people, short-lived and growing at about 0.65% a year, and the central lesson is how steep the climb since has been. The population grew about five times by 2026, life expectancy rose from 32 to 73 years, and the share of Europe fell from about a quarter of humanity to 9% as South Asia and Africa surged.
The firmest findings are the order of magnitude and the regional pattern, which every source supports. The weakest are the exact totals, where a 10% gap separates the lowest estimate from the highest and country figures depend on border choices.
The 20th century added more people than all earlier history combined, yet the growth rate peaked in the 1960s and has since more than halved, so the 1900 starting point will not be repeated. The question now is how high the line goes before it flattens, which the future of world population analysis takes up.
Frequently Asked Questions
1. What was the world population in 1900?
About 1.65 billion people, according to the UN’s compilation of historical estimates. Published figures range from 1.55 billion (Maddison) to 1.71 billion (the upper end of Durand’s estimate). Seven of nine single-value estimates fall between 1.625 and 1.668 billion, and their average is 1.631 billion.
2. Why do estimates of the 1900 population differ?
Because most of the world was not counted by censuses. Estimates for China, India, Africa, and parts of the Middle East rely on tax records and reconstruction; borders changed, and methods differ. The result is a spread of 163 million people, or about 10%, between the lowest and highest estimates.
3. Which country had the largest population in 1900?
China, with about 400 million people, or 25.9% of the Maddison world total. India was second with 284.5 million, then the former USSR (124.5 million) and the United States (76.3 million). On a colonial-empire, count the Russian Empire ranks above the United States.
4. How many people lived in Asia in 1900?
About 947 million, or 56.7% of the world, in Johnston’s continent-based compilation. Maddison’s East Asia and South and Southeast Asia regions together hold 823 million (53.3%), excluding Central and West Asia. Asia holds 58.6% of the world in 2026, so its share is similar to 1900.
5. How much has the world population grown since 1900?
About five times. The UN compilation has 1.65 billion in 1900 and the UN’s 2024 revision has 8.30 billion in 2026, a factor of 5.03. The 1900 population equals about 20% of today’s. Current figures are on the world population in 2026 page.
6. What was life expectancy in 1900?
About 32 years worldwide, according to Our World in Data’s long-run series, compared with 73 years in 2023. Life expectancy more than doubled over the 20th century in every world region. High child mortality was the main reason for the low average.
7. How fast was the world population growing in 1900?
About 0.65% a year between 1870 and 1900 on the Maddison series, and about 0.98% a year from 1900 to 1950. Summaries of the standard estimates give an average of 0.5% to 0.6% over the 19th century. The UN’s growth rate in 2026 is 0.83%, lower than the 1900 to 1950 average.
8. When did the world reach 2 billion people?
In 1927, according to historical estimates compiled by Worldometer, 123 years after the first billion in 1804. The UN’s 2024 revision puts 3 billion in 1960. The 1900 total of about 1.65 billion was roughly 80% of the way to 2 billion. See the world population milestone tracker for the full list.
9. How big were the US, UK and Germany in 1900?
On modern borders, the United States had 76.3 million people, Germany 54.4 million, the United Kingdom 41.2 million and France 40.6 million, according to the Maddison Project 2023 figures. By 2022, the US had 333 million people and Germany 84 million, which is 4.4 and 1.5 times their 1900 levels.
10. What share of the world lived in Europe in 1900?
About a quarter: 429 million people, or 25.7%, in Johnston’s compilation, and 27.9% in Maddison’s two European regions. Europe holds 9.0% of the world in 2026 (743 million people), because it grew 1.7 times while the world grew about five times.
Sources
- Wikipedia. Estimates of historical world population (tables of estimates by source, Maddison 2023 regional and country series, 1900 range).
- Bolt, Jutta and Jan Luiten van Zanden (2025). Maddison-style estimates of the evolution of the world economy: A new 2023 update. Journal of Economic Surveys 39: 631 to 671. doi:10.1111/joes.12618 (data used as tabulated in the Wikipedia compilation above)
- Johnston’s Archive. Historical world population data by continent (1900).
- Wikipedia. List of countries by population in 1900 (colonial-empire basis).
- Our World in Data. Life expectancy (Riley 2005, Zijdeman et al. 2015, Human Mortality Database, UN WPP 2024).
- United Nations, Department of Economic and Social Affairs, Population Division. World Population Prospects 2024, medium variant, as tabulated by StatisticsTimes.