Earth population 2027 is projected at 8.37 billion, up 68.4 million, with Africa supplying 51% of the growth and 63 countries and areas shrinking.
Key Takeaways
- The UN projects population on Earth 2027 at 8,369,094,344 on 1 July 2027, up 68.4 million (0.82%) from 8.30 billion in 2026.
- India (1.49 billion) and China (1.41 billion) hold 34.6% of Earth’s people in 2027, India’s lead over China widens to about 79.5 million, and Nigeria, Pakistan, DR Congo and Ethiopia add the most people after India.
- Africa supplies 50.8% of the 2027 increase, and 63 of the 237 countries and areas, including China, Japan, Russia and Germany, lose population.
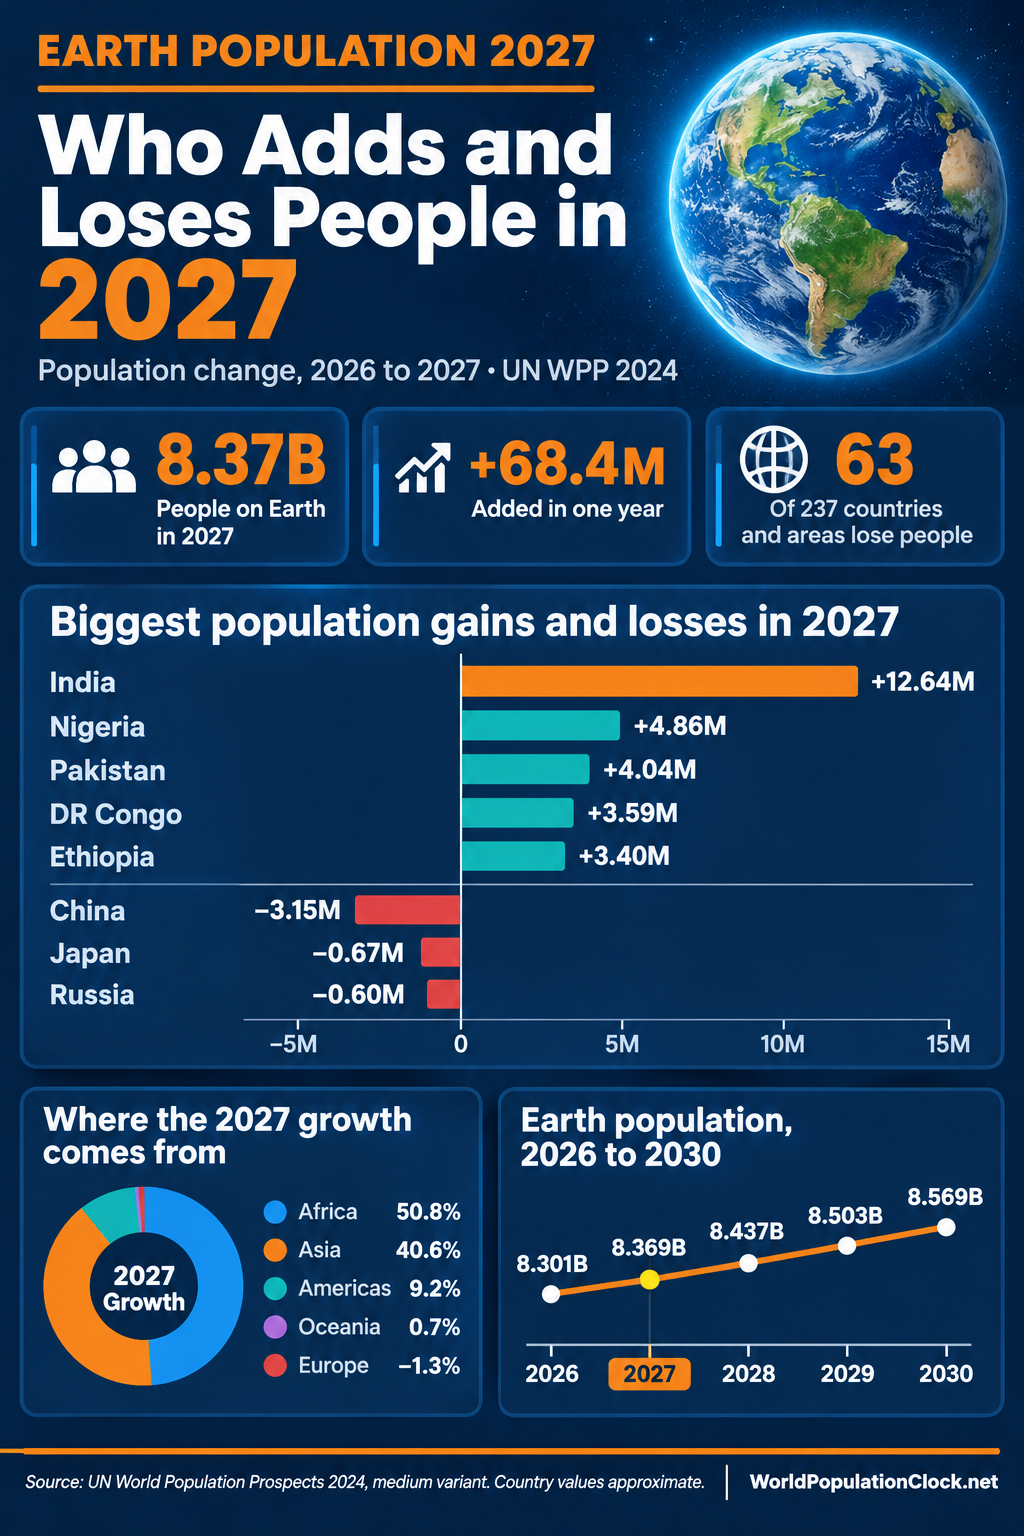
Earth population 2027 is projected at 8,369,094,344 people on 1 July 2027, according to the United Nations’ World Population Prospects 2024. That is 68.4 million more than the 8.30 billion of mid-2026, a gain of 0.82% against 0.84% a year earlier, or about 187,000 people a day. The population on Earth 2027 is the second step in a slowing climb that reaches 9 billion in 2037. The previous year is covered in world population in 2026.
The totals hide a wide spread between countries. India adds 12.6 million people in 2027, Nigeria 4.9 million and Pakistan 4.0 million, while China loses 3.2 million and Japan 0.7 million. This article gives the world and regional totals, the ten largest countries, the biggest gains and losses, and an approximate 2027 population for every one of the 237 countries and areas in the UN data.
The world total is the UN medium-variant figure for 1 July 2027. Country values are approximations: each is the UN mid-2026 estimate plus that country’s 2026 net change, scaled by 0.9906 so the yearly gain matches the UN’s world increase for 2027. The 237 values add up to the UN world total within 8 people. The method was tested on the 22 largest countries, for which a UN 2027 figure could be found. The average error was 0.05%, and the worst was Germany at 0.27% below the UN figure. Smaller countries and territories carry more relative uncertainty because migration can swing their totals.
Earth Population 2027 at a Glance
| Metric | Figure | Year |
|---|---|---|
| Population | 8,369,094,344 | 2027 |
| Yearly change | +68,415,948 (+0.82%) | 2027 |
| Yearly change in the previous year | +69,065,326 (+0.84%) | 2026 |
| Net gain per day (calculated) | About 187,000 | 2027 |
| Countries and areas in the UN data | 237 | 2027 |
| Countries and areas losing population (approximate) | 63 | 2027 |
| Year the world reaches 9 billion (projected) | 2037 | n/a |
The UN series shows Earth adding slightly fewer people each year, a pattern visible in the five-year path below.
| Year | Population (billions) | Net change (millions) | Growth rate (%) |
|---|---|---|---|
| 2026 | 8.301 | 69.1 | 0.84 |
| 2027 | 8.369 | 68.4 | 0.82 |
| 2028 | 8.437 | 67.5 | 0.81 |
| 2029 | 8.503 | 66.7 | 0.79 |
| 2030 | 8.569 | 65.8 | 0.77 |
Between 2026 and 2030 Earth adds 268 million people, but the yearly gain falls by 3.3 million. The 2028 and 2030 pictures are set out in world population in 2028 and the later pages of the series. The long-run view reaches a peak near 10.29 billion in 2084, according to the UN.
Population on Earth 2027 by Region
Regional figures are approximations built the same way as the country values: the 2026 UN estimate plus the 2026 net change, scaled to the 2027 world gain.
| Region | Population 2026 (millions) | Approx. population 2027 (millions) | Approx. change (millions) | Change (%) | Share of Earth 2027 (%) | Share of world change (%) |
|---|---|---|---|---|---|---|
| Asia | 4,863.3 | 4,891.1 | +27.7 | +0.57 | 58.4 | 40.6 |
| Africa | 1,585.0 | 1,619.8 | +34.8 | +2.19 | 19.4 | 50.8 |
| Americas | 1,061.8 | 1,068.1 | +6.3 | +0.59 | 12.8 | 9.2 |
| Europe | 743.5 | 742.6 | -0.9 | -0.12 | 8.9 | -1.3 |
| Oceania | 47.1 | 47.6 | +0.5 | +1.07 | 0.6 | 0.7 |
| Earth | 8,300.7 | 8,369.1 | +68.4 | +0.82 | 100.0 | 100.0 |
Africa adds about 34.8 million people in 2027, a 2.19% rise, and supplies 50.8% of Earth’s net gain with 19.4% of its people. Asia adds 27.7 million, which is 40.6% of the gain, and still holds 58.4% of the total. Europe shrinks by about 0.9 million. Africa’s share of humanity rises from 19.1% to 19.4% in one year, and the differences in fertility behind this are tracked on the world fertility rate page. A regional view with all five continents is on the continents population page.
The Ten Largest Countries in 2027
The top ten hold 56.5% of Earth’s people in 2027, almost unchanged from 56.6% in 2026.
| Rank | Country | Approx. population 2027 (millions) | Share of Earth (%) | Cumulative share (%) | Change vs 2026 (millions) | Growth (%) | Fertility rate | Median age |
|---|---|---|---|---|---|---|---|---|
| 1 | 🇮🇳 India | 1,489.3 | 17.79 | 17.79 | +12.64 | +0.86 | 1.93 | 29.2 |
| 2 | 🇨🇳 China | 1,409.8 | 16.84 | 34.64 | -3.15 | -0.22 | 1.03 | 40.6 |
| 3 | 🇺🇸 United States | 350.8 | 4.19 | 38.83 | +1.74 | +0.50 | 1.62 | 38.7 |
| 4 | 🇮🇩 Indonesia | 290.0 | 3.47 | 42.30 | +2.15 | +0.75 | 2.08 | 30.7 |
| 5 | 🇵🇰 Pakistan | 263.3 | 3.15 | 45.44 | +4.04 | +1.56 | 3.44 | 20.8 |
| 6 | 🇳🇬 Nigeria | 247.3 | 2.95 | 48.40 | +4.86 | +2.00 | 4.20 | 18.3 |
| 7 | 🇧🇷 Brazil | 214.3 | 2.56 | 50.96 | +0.74 | +0.35 | 1.59 | 35.2 |
| 8 | 🇧🇩 Bangladesh | 179.9 | 2.15 | 53.11 | +2.11 | +1.19 | 2.09 | 26.3 |
| 9 | 🇷🇺 Russia | 142.8 | 1.71 | 54.81 | -0.60 | -0.42 | 1.47 | 40.7 |
| 10 | 🇪🇹 Ethiopia | 142.3 | 1.70 | 56.52 | +3.40 | +2.45 | 3.72 | 19.3 |
Fertility rates and median ages are the UN’s 2026 values. India’s lead over China widens from 63.7 million in 2026 to about 79.5 million in 2027, a gap examined in the India vs China population comparison. Nigeria and Ethiopia grow fastest of the ten, at 2.00% and 2.45%, while Russia and China shrink. Ethiopia is within about 0.5 million of Russia in this approximation, so ninth place is close. Sixteen countries have more than 100 million people in 2027, and the top 20 hold 69.2% of Earth. The wider ranking sits on the largest population country page.
Who Adds the Most People in 2027, and Who Loses Them
India alone supplies 18.5% of the world’s net gain. Five countries, India, Nigeria, Pakistan, DR Congo and Ethiopia, supply 41.7% between them.
| Rank | Country | Approx. change in 2027 (millions) | Growth (%) | Share of Earth’s gain (%) |
|---|---|---|---|---|
| 1 | India | +12.64 | +0.86 | 18.5 |
| 2 | Nigeria | +4.86 | +2.00 | 7.1 |
| 3 | Pakistan | +4.04 | +1.56 | 5.9 |
| 4 | DR Congo | +3.59 | +3.08 | 5.2 |
| 5 | Ethiopia | +3.40 | +2.45 | 5.0 |
| 6 | Indonesia | +2.15 | +0.75 | 3.1 |
| 7 | Bangladesh | +2.11 | +1.19 | 3.1 |
| 8 | Tanzania | +2.00 | +2.75 | 2.9 |
| 9 | United States | +1.74 | +0.50 | 2.5 |
| 10 | Egypt | +1.72 | +1.43 | 2.5 |
| Rank | Country or area | Approx. change in 2027 (thousands) | Change (%) |
|---|---|---|---|
| 1 | China | -3,152 | -0.22 |
| 2 | Japan | -669 | -0.55 |
| 3 | Russia | -597 | -0.42 |
| 4 | Germany | -427 | -0.51 |
| 5 | Poland | -295 | -0.78 |
| 6 | Italy | -218 | -0.37 |
| 7 | Romania | -107 | -0.57 |
| 8 | Taiwan | -101 | -0.44 |
| 9 | Czechia | -81 | -0.77 |
| 10 | South Korea | -66 | -0.13 |
On this approximation 63 of the 237 countries and areas lose population in 2027, and 39 of those have more than 1 million people. China’s 3.2 million loss is more than four times the next largest. Among countries with more than 1 million people the fastest growth is in the Central African Republic (+3.23%), Syria (+3.19%), Somalia (+3.18%), Oman (+3.09%), Niger (+3.08%) and DR Congo (+3.08%). The fastest declines are in Moldova (-1.17%), Lithuania (-1.16%), Estonia (-0.98%), Latvia (-0.95%) and Bosnia and Herzegovina (-0.82%). The wider rankings are on the fastest-growing populations and countries with declining populations pages.
Rank Changes Between 2026 and 2027
Faster-growing countries overtake slower ones every year. Egypt and DR Congo overtake Japan and the Philippines in the UN’s own 2027 figures, and the other changes are approximate.
| Country | Rank 2026 | Rank 2027 | Overtakes |
|---|---|---|---|
| Egypt | 13 | 12 | Japan |
| DR Congo | 15 | 14 | Philippines |
| Kenya | 26 | 25 | Italy |
| Sudan | 29 | 28 | Colombia |
| Iraq | 33 | 32 | Algeria |
| Afghanistan | 36 | 35 | Argentina |
| Angola | 39 | 38 | Canada |
| Uzbekistan | 43 | 42 | Poland |
| Mozambique | 44 | 43 | Poland |
| United Arab Emirates | 86 | 83 | Jordan, Dominican Republic, Belgium |
Approximate Population of Every Country in 2027
The tables below list all 237 countries and areas in the UN data, ranked by approximate population on 1 July 2027. Values are rounded to the nearest thousand for countries above 100,000 people, to the nearest hundred for those between 10,000 and 100,000, and to the nearest ten for the smallest. The 2026 column is the UN mid-2026 estimate on the same rounding. The same data is available as a spreadsheet file. The world population by country page carries the live country counters.
Ranks 1 to 50
| Rank 2027 | Country or area | Population 2026 | Approx. population 2027 | Approx. change (%) |
|---|---|---|---|---|
| 1 | India | 1,476,626,000 | 1,489,266,000 | +0.86 |
| 2 | China | 1,412,914,000 | 1,409,762,000 | -0.22 |
| 3 | United States | 349,035,000 | 350,779,000 | +0.50 |
| 4 | Indonesia | 287,887,000 | 290,032,000 | +0.75 |
| 5 | Pakistan | 259,300,000 | 263,342,000 | +1.56 |
| 6 | Nigeria | 242,432,000 | 247,290,000 | +2.00 |
| 7 | Brazil | 213,563,000 | 214,306,000 | +0.35 |
| 8 | Bangladesh | 177,818,000 | 179,929,000 | +1.19 |
| 9 | Russia | 143,394,000 | 142,797,000 | -0.42 |
| 10 | Ethiopia | 138,902,000 | 142,300,000 | +2.45 |
| 11 | Mexico | 132,998,000 | 134,039,000 | +0.78 |
| 12 | Egypt | 120,101,000 | 121,820,000 | +1.43 |
| 13 | Japan | 122,428,000 | 121,758,000 | -0.55 |
| 14 | DR Congo | 116,452,000 | 120,038,000 | +3.08 |
| 15 | Philippines | 117,724,000 | 118,653,000 | +0.79 |
| 16 | Vietnam | 102,177,000 | 102,751,000 | +0.56 |
| 17 | Iran | 93,168,000 | 93,912,000 | +0.80 |
| 18 | Türkiye | 87,926,000 | 88,164,000 | +0.27 |
| 19 | Germany | 83,644,000 | 83,217,000 | -0.51 |
| 20 | Tanzania | 72,564,000 | 74,563,000 | +2.75 |
| 21 | Thailand | 71,560,000 | 71,500,000 | -0.08 |
| 22 | United Kingdom | 69,932,000 | 70,308,000 | +0.54 |
| 23 | France | 66,746,000 | 66,841,000 | +0.14 |
| 24 | South Africa | 65,453,000 | 66,152,000 | +1.07 |
| 25 | Kenya | 58,636,000 | 59,730,000 | +1.86 |
| 26 | Italy | 58,926,000 | 58,708,000 | -0.37 |
| 27 | Myanmar | 55,185,000 | 55,516,000 | +0.60 |
| 28 | Sudan | 53,283,000 | 54,888,000 | +3.01 |
| 29 | Colombia | 53,936,000 | 54,442,000 | +0.94 |
| 30 | Uganda | 52,761,000 | 54,125,000 | +2.58 |
| 31 | South Korea | 51,600,000 | 51,534,000 | -0.13 |
| 32 | Iraq | 48,007,000 | 48,985,000 | +2.04 |
| 33 | Algeria | 48,028,000 | 48,616,000 | +1.22 |
| 34 | Spain | 47,851,000 | 47,812,000 | -0.08 |
| 35 | Afghanistan | 45,047,000 | 46,239,000 | +2.65 |
| 36 | Argentina | 46,004,000 | 46,155,000 | +0.33 |
| 37 | Yemen | 42,962,000 | 44,138,000 | +2.74 |
| 38 | Angola | 40,215,000 | 41,379,000 | +2.89 |
| 39 | Canada | 40,468,000 | 40,806,000 | +0.83 |
| 40 | Ukraine | 39,536,000 | 40,086,000 | +1.39 |
| 41 | Morocco | 38,762,000 | 39,091,000 | +0.85 |
| 42 | Uzbekistan | 37,724,000 | 38,389,000 | +1.76 |
| 43 | Mozambique | 36,640,000 | 37,639,000 | +2.73 |
| 44 | Poland | 37,843,000 | 37,548,000 | -0.78 |
| 45 | Malaysia | 36,385,000 | 36,789,000 | +1.11 |
| 46 | Ghana | 35,698,000 | 36,325,000 | +1.76 |
| 47 | Saudi Arabia | 35,166,000 | 35,760,000 | +1.69 |
| 48 | Peru | 34,922,000 | 35,264,000 | +0.98 |
| 49 | Madagascar | 33,522,000 | 34,296,000 | +2.31 |
| 50 | Côte d’Ivoire | 33,494,000 | 34,270,000 | +2.32 |
Ranks 51 to 100
| Rank 2027 | Country or area | Population 2026 | Approx. population 2027 | Approx. change (%) |
|---|---|---|---|---|
| 51 | Cameroon | 30,641,000 | 31,395,000 | +2.46 |
| 52 | Niger | 28,815,000 | 29,703,000 | +3.08 |
| 53 | Nepal | 29,629,000 | 29,641,000 | +0.04 |
| 54 | Venezuela | 28,634,000 | 28,749,000 | +0.40 |
| 55 | Australia | 27,227,000 | 27,478,000 | +0.92 |
| 56 | Syria | 26,472,000 | 27,317,000 | +3.19 |
| 57 | North Korea | 26,634,000 | 26,696,000 | +0.23 |
| 58 | Mali | 25,932,000 | 26,659,000 | +2.80 |
| 59 | Burkina Faso | 24,602,000 | 25,124,000 | +2.12 |
| 60 | Sri Lanka | 23,348,000 | 23,466,000 | +0.50 |
| 61 | Malawi | 22,786,000 | 23,350,000 | +2.48 |
| 62 | Zambia | 22,522,000 | 23,124,000 | +2.67 |
| 63 | Taiwan | 23,011,000 | 22,911,000 | -0.44 |
| 64 | Chad | 21,560,000 | 22,112,000 | +2.56 |
| 65 | Kazakhstan | 21,084,000 | 21,321,000 | +1.13 |
| 66 | Somalia | 20,306,000 | 20,951,000 | +3.18 |
| 67 | Chile | 19,946,000 | 20,031,000 | +0.43 |
| 68 | Senegal | 19,367,000 | 19,797,000 | +2.22 |
| 69 | Guatemala | 18,968,000 | 19,245,000 | +1.46 |
| 70 | Romania | 18,801,000 | 18,694,000 | -0.57 |
| 71 | Ecuador | 18,445,000 | 18,598,000 | +0.83 |
| 72 | Netherlands | 18,449,000 | 18,550,000 | +0.55 |
| 73 | Cambodia | 18,051,000 | 18,253,000 | +1.12 |
| 74 | Zimbabwe | 17,274,000 | 17,593,000 | +1.85 |
| 75 | Guinea | 15,442,000 | 15,781,000 | +2.20 |
| 76 | Benin | 15,170,000 | 15,523,000 | +2.32 |
| 77 | Rwanda | 14,890,000 | 15,207,000 | +2.13 |
| 78 | Burundi | 14,729,000 | 15,065,000 | +2.28 |
| 79 | Bolivia | 12,749,000 | 12,915,000 | +1.30 |
| 80 | South Sudan | 12,436,000 | 12,681,000 | +1.97 |
| 81 | Tunisia | 12,415,000 | 12,481,000 | +0.53 |
| 82 | Haiti | 12,038,000 | 12,168,000 | +1.08 |
| 83 | United Arab Emirates | 11,575,000 | 11,801,000 | +1.96 |
| 84 | Belgium | 11,775,000 | 11,791,000 | +0.13 |
| 85 | Dominican Republic | 11,610,000 | 11,698,000 | +0.76 |
| 86 | Jordan | 11,590,000 | 11,658,000 | +0.59 |
| 87 | Honduras | 11,185,000 | 11,362,000 | +1.58 |
| 88 | Tajikistan | 10,979,000 | 11,169,000 | +1.73 |
| 89 | Papua New Guinea | 10,948,000 | 11,131,000 | +1.67 |
| 90 | Cuba | 10,893,000 | 10,849,000 | -0.41 |
| 91 | Sweden | 10,701,000 | 10,745,000 | +0.41 |
| 92 | Azerbaijan | 10,455,000 | 10,511,000 | +0.54 |
| 93 | Czechia | 10,528,000 | 10,447,000 | -0.77 |
| 94 | Portugal | 10,395,000 | 10,379,000 | -0.16 |
| 95 | Togo | 9,931,000 | 10,138,000 | +2.09 |
| 96 | Greece | 9,897,000 | 9,856,000 | -0.42 |
| 97 | Israel | 9,648,000 | 9,777,000 | +1.34 |
| 98 | Hungary | 9,586,000 | 9,540,000 | -0.48 |
| 99 | Sierra Leone | 8,997,000 | 9,172,000 | +1.95 |
| 100 | Austria | 9,107,000 | 9,101,000 | -0.07 |
Ranks 101 to 150
| Rank 2027 | Country or area | Population 2026 | Approx. population 2027 | Approx. change (%) |
|---|---|---|---|---|
| 101 | Switzerland | 9,008,000 | 9,048,000 | +0.44 |
| 102 | Belarus | 8,937,000 | 8,877,000 | -0.67 |
| 103 | Laos | 7,974,000 | 8,074,000 | +1.25 |
| 104 | Turkmenistan | 7,737,000 | 7,853,000 | +1.51 |
| 105 | Libya | 7,540,000 | 7,620,000 | +1.07 |
| 106 | Kyrgyzstan | 7,400,000 | 7,505,000 | +1.41 |
| 107 | Hong Kong | 7,379,000 | 7,361,000 | -0.23 |
| 108 | Nicaragua | 7,097,000 | 7,186,000 | +1.25 |
| 109 | Paraguay | 7,095,000 | 7,177,000 | +1.15 |
| 110 | Republic of the Congo | 6,638,000 | 6,790,000 | +2.29 |
| 111 | Bulgaria | 6,668,000 | 6,621,000 | -0.70 |
| 112 | Serbia | 6,642,000 | 6,595,000 | -0.70 |
| 113 | El Salvador | 6,391,000 | 6,417,000 | +0.40 |
| 114 | Denmark | 6,024,000 | 6,044,000 | +0.35 |
| 115 | Liberia | 5,854,000 | 5,976,000 | +2.08 |
| 116 | Lebanon | 5,897,000 | 5,945,000 | +0.81 |
| 117 | Singapore | 5,906,000 | 5,940,000 | +0.59 |
| 118 | Central African Republic | 5,699,000 | 5,883,000 | +3.23 |
| 119 | Oman | 5,671,000 | 5,847,000 | +3.09 |
| 120 | State of Palestine | 5,693,000 | 5,795,000 | +1.80 |
| 121 | Norway | 5,653,000 | 5,683,000 | +0.52 |
| 122 | Finland | 5,622,000 | 5,620,000 | -0.03 |
| 123 | Mauritania | 5,461,000 | 5,606,000 | +2.65 |
| 124 | Slovakia | 5,451,000 | 5,428,000 | -0.43 |
| 125 | Ireland | 5,357,000 | 5,405,000 | +0.90 |
| 126 | New Zealand | 5,287,000 | 5,323,000 | +0.67 |
| 127 | Costa Rica | 5,175,000 | 5,196,000 | +0.42 |
| 128 | Kuwait | 5,103,000 | 5,179,000 | +1.49 |
| 129 | Panama | 4,626,000 | 4,680,000 | +1.17 |
| 130 | Georgia | 3,805,000 | 3,803,000 | -0.05 |
| 131 | Croatia | 3,822,000 | 3,797,000 | -0.67 |
| 132 | Eritrea | 3,683,000 | 3,758,000 | +2.04 |
| 133 | Mongolia | 3,557,000 | 3,596,000 | +1.11 |
| 134 | Uruguay | 3,383,000 | 3,380,000 | -0.06 |
| 135 | Qatar | 3,174,000 | 3,231,000 | +1.80 |
| 136 | Namibia | 3,153,000 | 3,213,000 | +1.90 |
| 137 | Puerto Rico | 3,223,000 | 3,210,000 | -0.39 |
| 138 | Bosnia and Herzegovina | 3,114,000 | 3,089,000 | -0.82 |
| 139 | Gambia | 2,884,000 | 2,945,000 | +2.13 |
| 140 | Moldova | 2,961,000 | 2,927,000 | -1.17 |
| 141 | Armenia | 2,931,000 | 2,910,000 | -0.72 |
| 142 | Jamaica | 2,833,000 | 2,830,000 | -0.13 |
| 143 | Lithuania | 2,797,000 | 2,765,000 | -1.16 |
| 144 | Albania | 2,751,000 | 2,731,000 | -0.74 |
| 145 | Gabon | 2,647,000 | 2,701,000 | +2.03 |
| 146 | Botswana | 2,603,000 | 2,644,000 | +1.57 |
| 147 | Lesotho | 2,389,000 | 2,415,000 | +1.08 |
| 148 | Guinea-Bissau | 2,298,000 | 2,346,000 | +2.08 |
| 149 | Slovenia | 2,115,000 | 2,112,000 | -0.12 |
| 150 | Equatorial Guinea | 1,984,000 | 2,030,000 | +2.30 |
Ranks 151 to 200
| Rank 2027 | Country or area | Population 2026 | Approx. population 2027 | Approx. change (%) |
|---|---|---|---|---|
| 151 | Latvia | 1,836,000 | 1,818,000 | -0.95 |
| 152 | North Macedonia | 1,804,000 | 1,794,000 | -0.53 |
| 153 | Bahrain | 1,676,000 | 1,708,000 | +1.91 |
| 154 | Kosovo | 1,667,000 | 1,660,000 | -0.42 |
| 155 | Trinidad and Tobago | 1,513,000 | 1,515,000 | +0.14 |
| 156 | Timor-Leste | 1,437,000 | 1,455,000 | +1.27 |
| 157 | Cyprus | 1,382,000 | 1,394,000 | +0.83 |
| 158 | Estonia | 1,331,000 | 1,318,000 | -0.98 |
| 159 | Eswatini | 1,270,000 | 1,283,000 | +1.07 |
| 160 | Mauritius | 1,265,000 | 1,262,000 | -0.25 |
| 161 | Djibouti | 1,199,000 | 1,215,000 | +1.27 |
| 162 | Fiji | 937,000 | 941,000 | +0.44 |
| 163 | Comoros | 899,000 | 915,000 | +1.78 |
| 164 | Réunion | 886,000 | 890,000 | +0.44 |
| 165 | Solomon Islands | 858,000 | 878,000 | +2.27 |
| 166 | Guyana | 841,000 | 846,000 | +0.58 |
| 167 | Bhutan | 802,000 | 808,000 | +0.68 |
| 168 | Macao | 723,000 | 724,000 | +0.16 |
| 169 | Luxembourg | 687,000 | 694,000 | +1.01 |
| 170 | Suriname | 645,000 | 651,000 | +0.83 |
| 171 | Western Sahara | 611,000 | 621,000 | +1.61 |
| 172 | Montenegro | 626,000 | 620,000 | -1.03 |
| 173 | Malta | 549,000 | 553,000 | +0.65 |
| 174 | Maldives | 532,000 | 533,000 | +0.34 |
| 175 | Cabo Verde | 530,000 | 532,000 | +0.43 |
| 176 | Brunei | 470,000 | 473,000 | +0.73 |
| 177 | Belize | 429,000 | 434,000 | +1.32 |
| 178 | Iceland | 402,000 | 406,000 | +1.00 |
| 179 | Bahamas | 405,000 | 406,000 | +0.39 |
| 180 | Guadeloupe | 372,000 | 371,000 | -0.36 |
| 181 | Mayotte | 348,000 | 358,000 | +3.00 |
| 182 | Vanuatu | 343,000 | 350,000 | +2.14 |
| 183 | Martinique | 338,000 | 335,000 | -0.80 |
| 184 | French Guiana | 319,000 | 324,000 | +1.62 |
| 185 | New Caledonia | 298,000 | 300,000 | +0.85 |
| 186 | French Polynesia | 283,000 | 284,000 | +0.21 |
| 187 | Barbados | 283,000 | 283,000 | +0.04 |
| 188 | São Tomé and Príncipe | 245,000 | 250,000 | +1.92 |
| 189 | Samoa | 221,000 | 222,000 | +0.55 |
| 190 | Curaçao | 185,000 | 185,000 | -0.03 |
| 191 | Saint Lucia | 180,000 | 181,000 | +0.19 |
| 192 | Guam | 170,000 | 171,000 | +0.69 |
| 193 | Kiribati | 138,000 | 140,000 | +1.40 |
| 194 | Seychelles | 135,000 | 137,000 | +1.60 |
| 195 | Grenada | 117,000 | 117,000 | +0.05 |
| 196 | Micronesia | 114,000 | 115,000 | +0.43 |
| 197 | Aruba | 108,000 | 108,000 | +0.02 |
| 198 | Jersey | 104,000 | 104,000 | +0.11 |
| 199 | Tonga | 103,000 | 103,000 | -0.43 |
| 200 | Saint Vincent and the Grenadines | 99,200 | 98,600 | -0.68 |
Ranks 201 to 237
| Rank 2027 | Country or area | Population 2026 | Approx. population 2027 | Approx. change (%) |
|---|---|---|---|---|
| 201 | Antigua and Barbuda | 94,600 | 95,000 | +0.44 |
| 202 | Andorra | 83,800 | 84,600 | +1.00 |
| 203 | Isle of Man | 84,100 | 84,000 | -0.08 |
| 204 | U.S. Virgin Islands | 83,400 | 82,700 | -0.88 |
| 205 | Cayman Islands | 77,200 | 78,500 | +1.73 |
| 206 | Dominica | 65,500 | 65,200 | -0.55 |
| 207 | Guernsey | 64,600 | 64,700 | +0.21 |
| 208 | Bermuda | 64,500 | 64,400 | -0.15 |
| 209 | Faroe Islands | 56,500 | 57,000 | +0.92 |
| 210 | Greenland | 55,600 | 55,500 | -0.21 |
| 211 | Turks and Caicos Islands | 47,100 | 47,400 | +0.62 |
| 212 | Saint Kitts and Nevis | 47,000 | 47,100 | +0.15 |
| 213 | Sint Maarten | 44,400 | 45,000 | +1.17 |
| 214 | American Samoa | 45,300 | 44,600 | -1.55 |
| 215 | Northern Mariana Islands | 42,900 | 42,300 | -1.45 |
| 216 | Gibraltar | 40,900 | 41,600 | +1.80 |
| 217 | Liechtenstein | 40,400 | 40,600 | +0.59 |
| 218 | British Virgin Islands | 39,900 | 40,100 | +0.51 |
| 219 | Monaco | 38,100 | 37,800 | -0.66 |
| 220 | Marshall Islands | 35,100 | 33,900 | -3.41 |
| 221 | San Marino | 33,600 | 33,600 | +0.10 |
| 222 | Caribbean Netherlands | 31,900 | 32,500 | +1.78 |
| 223 | Saint Martin (French part) | 23,900 | 22,900 | -4.32 |
| 224 | Palau | 17,600 | 17,600 | -0.28 |
| 225 | Anguilla | 14,800 | 14,900 | +0.60 |
| 226 | Cook Islands | 12,800 | 12,400 | -3.38 |
| 227 | Nauru | 12,100 | 12,200 | +0.62 |
| 228 | Saint-Barthélemy | 11,600 | 11,700 | +1.17 |
| 229 | Wallis and Futuna | 11,100 | 11,000 | -0.72 |
| 230 | Tuvalu | 9,360 | 9,230 | -1.38 |
| 231 | Saint Pierre and Miquelon | 5,510 | 5,450 | -1.10 |
| 232 | Saint Helena, Ascension and Tristan da Cunha | 5,150 | 5,100 | -0.94 |
| 233 | Montserrat | 4,330 | 4,300 | -0.71 |
| 234 | Falkland Islands | 3,460 | 3,460 | -0.11 |
| 235 | Tokelau | 2,690 | 2,770 | +3.06 |
| 236 | Niue | 1,820 | 1,820 | +0.11 |
| 237 | Holy See | 510 | 510 | +0.98 |
The list includes sovereign countries and other UN-listed areas such as Hong Kong, Puerto Rico and Guam. Togo’s 2026 figure is the one carried by most data providers, but an interim UN update in January 2026 cut its estimate to about 8.78 million from 9.93 million, so the 2027 value for Togo is probably overstated by about 1.1 million. Treat all small-territory values as indicative.
Why Population on Earth 2027 Figures Differ Between Sources
India’s next census counts everyone as of 1 March 2027, so the UN projection of about 1.49 billion will soon meet a real count. China’s official estimate for the end of 2025 was 1.405 billion, below the UN’s 1.413 billion for mid-2026, and Russia’s, Germany’s and Japan’s national estimates also differ from UN values. Some pages still quote about 8.1 billion for 2027, far below the UN’s 2024 series, which points to older data. Live counters extend the UN trend to the current day, so they sit above the mid-year figure after July. The accuracy of live population clocks is covered separately.
What the 2027 Count Shows
Earth’s population in 2027 is 8.37 billion, and the pattern that matters is not the total but who supplies the gain. India and China hold 34.6% of people, India’s lead grows to about 79.5 million, Africa supplies 50.8% of the 68.4 million people added, and 63 countries and areas shrink. Growth of 0.82% is slower than 0.84% the year before and continues slowing toward the peak. The firmest findings are the world and regional totals and the ten largest countries, which move slowly. The least certain are individual rankings between close neighbours and small territories, where a revision or a census can shift a country several places. The country table here is an approximation and should be read within its stated error. What it shows clearly is a world that adds people mostly in Africa and South Asia while a growing group of countries, mostly in East Asia and Europe, declines. That divergence widens until the world reaches 9 billion in 2037, a trajectory set out in the future of world population.
Frequently Asked Questions
1. What will Earth’s population be in 2027?
The UN medium projection puts it at 8,369,094,344 on 1 July 2027, about 8.37 billion. That is 68.4 million more than the 8.30 billion estimated for mid-2026, a rise of 0.82%. The UN also publishes low and high variants, but the medium variant is the standard reference.
2. How many people will be added to Earth in 2027?
About 68.4 million, or roughly 187,000 a day, down from 69.1 million in 2026. Africa supplies 50.8% of the gain and Asia 40.6%, while Europe loses about 0.9 million. The yearly addition keeps shrinking, reaching 65.8 million in 2030.
3. Which countries have the largest populations in 2027?
India (1,489 million), China (1,410 million), the United States (351 million), Indonesia (290 million), Pakistan (263 million), Nigeria (247 million), Brazil (214 million), Bangladesh (180 million), Russia (143 million) and Ethiopia (142 million). Together they hold 56.5% of Earth’s people.
4. How many countries have more than 100 million people in 2027?
Sixteen, according to the approximation, and two of them, India and China, exceed 1 billion. Vietnam is the 16th at about 102.7 million. Japan (121.8 million) and Egypt (121.8 million) are close together, and Egypt moves ahead of Japan in the UN’s 2027 figures.
5. Which country adds the most people in 2027?
India, with about 12.6 million more people, or 18.5% of Earth’s total gain. Nigeria follows with 4.9 million, Pakistan with 4.0 million, DR Congo with 3.6 million and Ethiopia with 3.4 million. Those five supply 41.7% of the world’s increase.
6. Which countries lose population in 2027?
On this approximation, 63 of the 237 countries and areas shrink, 39 of them with more than 1 million people. The biggest absolute losses are China (3.2 million), Japan (0.7 million), Russia (0.6 million) and Germany (0.4 million). Moldova and Lithuania fall fastest in percentage terms, at about 1.2%.
7. How many people live in Africa in 2027?
About 1,620 million, or 19.4% of Earth, up from 1,585 million and 19.1% in 2026. Africa adds roughly 34.8 million people, a 2.19% rise and the fastest of any continent apart from Oceania’s small base. It supplies 50.8% of the world’s net gain.
8. When will Earth’s population reach 9 billion?
In 2037, ten years after 2027, according to the UN medium variant. The world then reaches 10 billion around 2060 to 2061 and peaks near 10.29 billion in 2084. Each billion takes longer than the last. The details are in when the world population will peak.
9. How accurate is the approximate population table?
The approximation matched the UN’s own 2027 figure to within 0.05% on average for the 22 largest countries, and within 0.27% at worst, for Germany. The 237 values add up to the UN world total within 8 people. Small territories, and countries with volatile migration, carry more uncertainty.
10. Will India’s census change the 2027 figure?
It could change India’s figure, not the UN’s world method. The census reference date is 1 March 2027, and the UN projects about 1.489 billion for 1 July 2027. A large gap would lead the UN to revise India in a future edition, which would also move the world total and the ranking by a small amount.
Sources
- United Nations, Department of Economic and Social Affairs, Population Division. World Population Prospects 2024: Summary of Results (2024).
- United Nations, Population Division. World Population Prospects 2024: Ten Key Messages (2024).
- Wikipedia. List of countries and dependencies by population (China official estimate, 31 December 2025).