September 9 is the most common US birthday, Tuesday the busiest weekday and August the biggest month, while December 25 is the quietest date.
Key Takeaways
- September 9 is the most common US birthday, averaging 12,344 births a year in 1994–2014 data, 10.5% above the average day, while December 25 is the least common at 6,601, about 41% below it.
- Tuesday is the most common birth weekday at 12,842 births a day against 7,635 on Sunday, so Tuesday births run 68% higher.
- August is the biggest birth month, with about 322,000 births in 2023 (10,387 a day), though September had the most births per day in the 1994–2014 series (11,811).
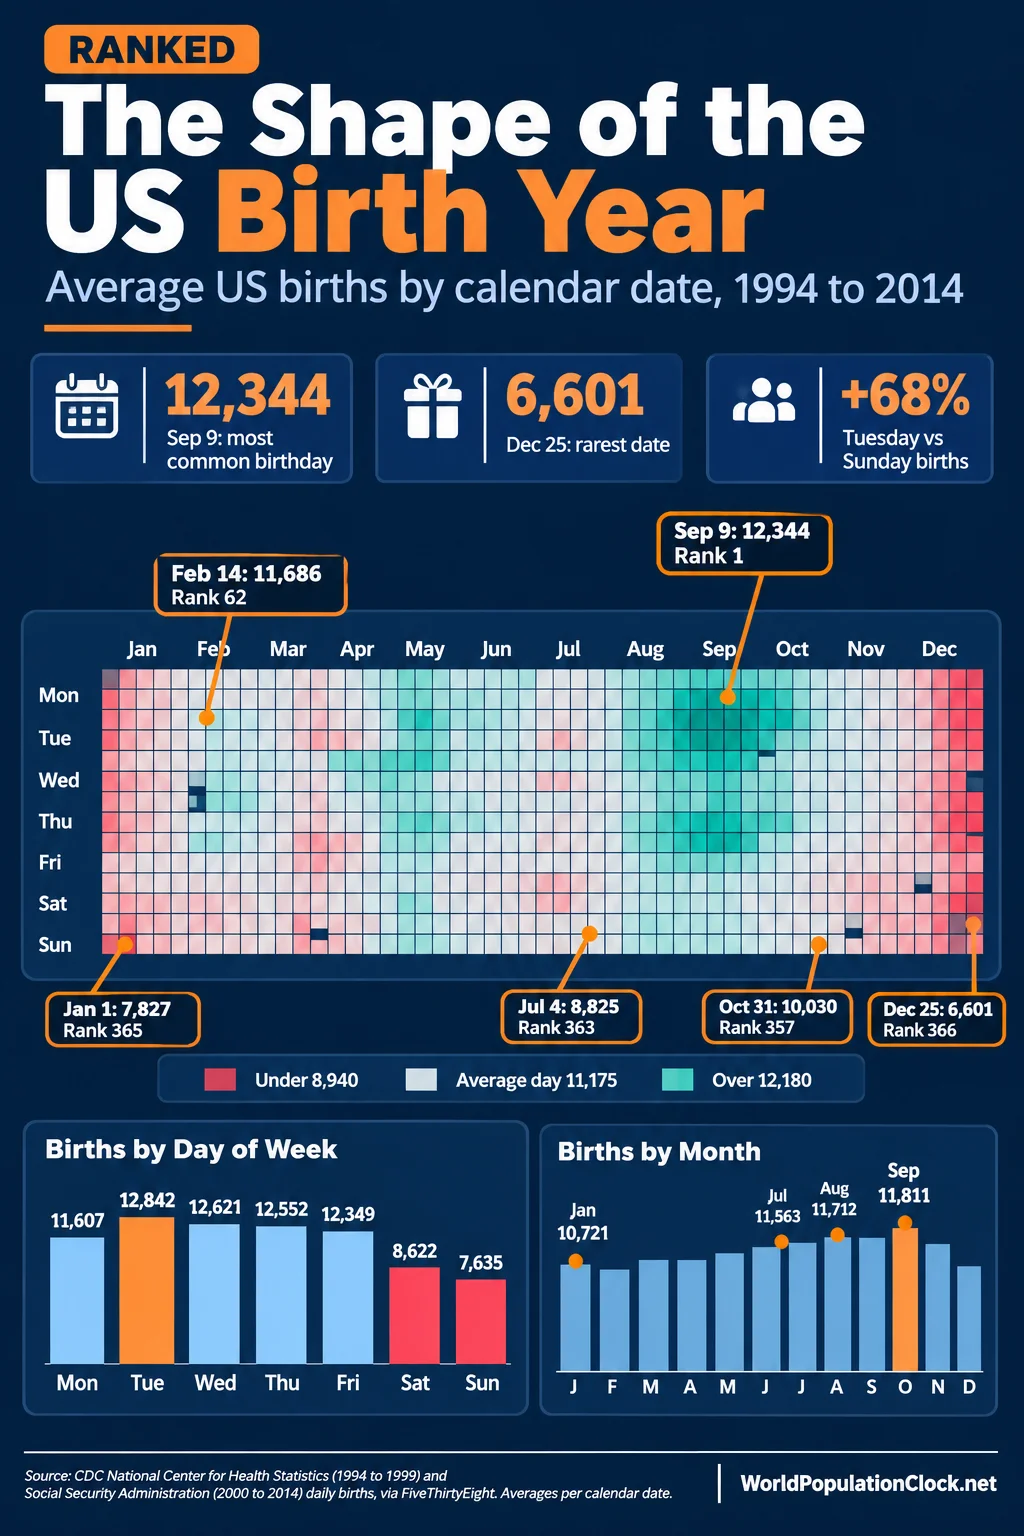
The most common birthday in the United States is September 9. Between 1994 and 2014, an average of 12,344 babies were born on that date each year, compared with 6,601 on December 25, the rarest date. The gap is 5,743 births a year, a ratio of 1.87 to 1. Nine of the ten busiest dates fall in September, and the quietest ones cluster around Christmas, New Year’s Day and July 4.
Those are the date-level facts. The calendar has two other layers. Births follow a weekly rhythm in which Tuesday leads and Sunday trails by a wide margin, and a seasonal one in which late summer outpaces winter. Each layer has the same root: when babies are conceived, and when deliveries can be scheduled. To see how your own date compares, the how many people share your birthday tool covers the global count.
The date and weekday figures come from the daily US birth counts that FiveThirtyEight published from two government sources, the CDC’s National Center for Health Statistics (1994–1999) and the Social Security Administration (2000–2014). That is 7,670 days and 85.7 million births, recomputed here as averages per calendar date.
Published versions differ slightly: some outlets cite 12,301 for September 9 and others 12,344, depending on how the two series are combined. The 2000–2014 Social Security series on its own puts September 12 first. The 2023 monthly totals are CDC counts as reported by the secondary sources listed below, and the 2024 delivery and fertility figures come from the National Center for Health Statistics. Daily counts after 2014 were not available for this article, so the date rankings describe the 1994–2014 period.
September 9 Leads a Cluster of Mid-September Birthdays
Mid-September is the peak of the year. The ten most common dates in the 1994–2014 series are shown below, with each date compared with the average day of 11,175 births.
| Rank | Date | Average births per year | Versus average day (%) |
|---|---|---|---|
| 1 | September 9 | 12,344 | +10.5 |
| 2 | September 19 | 12,285 | +9.9 |
| 3 | September 12 | 12,282 | +9.9 |
| 4 | September 17 | 12,201 | +9.2 |
| 5 | September 10 | 12,190 | +9.1 |
| 6 | September 20 | 12,162 | +8.8 |
| 7 | July 7 | 12,147 | +8.7 |
| 8 | September 15 | 12,126 | +8.5 |
| 9 | September 16 | 12,114 | +8.4 |
| 10 | September 18 | 12,112 | +8.4 |
Nine of the top ten dates are in September, and 13 of the top 20 are. The only outsiders in the top ten are July 7 (seventh) and, a little lower, December 20 (11th, 12,064 births). The most cited explanation is timing: births in mid-September trace back to conceptions in mid-December, around the winter holidays. This dataset records when babies were born, not when they were conceived, so the link is an inference rather than a measured result.
The top date is also not far ahead of the pack. September 9 beats the second-placed September 19 by only 59 births a year, which is why different data vintages sometimes crown a neighbouring date.
Christmas, New Year’s Day and July 4 Are the Quietest Dates
The bottom of the ranking is far more distinct than the top. December 25 sits 40.9% below an average day.
| Rank (of 366) | Date | Average births per year | Versus average day (%) |
|---|---|---|---|
| 366 | December 25 | 6,601 | -40.9 |
| 365 | January 1 | 7,827 | -30.0 |
| 364 | December 24 | 8,103 | -27.5 |
| 363 | July 4 | 8,825 | -21.0 |
| 362 | January 2 | 9,356 | -16.3 |
| 361 | December 26 | 9,599 | -14.1 |
| 360 | November 27 | 9,770 | -12.6 |
| 359 | November 23 | 9,919 | -11.2 |
| 358 | November 25 | 10,001 | -10.5 |
| 357 | October 31 | 10,030 | -10.2 |
Christmas Day, New Year’s Day, Christmas Eve, and July 4 take the four lowest places, and the Thanksgiving window (November 23 to 27) fills three of the ten slots. The explanation usually offered is scheduling, since inductions and planned cesareans tend to avoid holidays. The national figures are consistent with that: in 2024, 33.9% of US births followed induction of labor and 32.4% were cesarean deliveries, according to the National Center for Health Statistics.
Better-known dates land in different places on the calendar, as the next table shows.
| Date | Average births per year | Rank (of 366) | Versus average day (%) |
|---|---|---|---|
| July 7 | 12,147 | 7 | +8.7 |
| December 20 | 12,064 | 11 | +8.0 |
| February 14 | 11,686 | 62 | +4.6 |
| February 29 | 10,512 | 347 | -5.9 |
| December 31 | 10,433 | 349 | -6.6 |
| April 1 | 10,335 | 353 | -7.5 |
| October 31 | 10,030 | 357 | -10.2 |
| July 4 | 8,825 | 363 | -21.0 |
| January 1 | 7,827 | 365 | -30.0 |
| December 25 | 6,601 | 366 | -40.9 |
February 29 is the rarest date on the calendar because it occurs only every four years, yet by births per occurrence it ranks 347th, well above Christmas. Friday the 13th shows a smaller effect: across 35 such Fridays in the series, births averaged 11,744, which is 5.1% below the 12,369 average for all other Fridays. To see how many people are alive at your birth moment, try the world population on your birthday calculator.
Tuesday Is the Most Common Day of the Week to Be Born
The weekly pattern is steeper than the seasonal one. Births are about 52% more frequent on a weekday than on a weekend day, 12,394 against 8,129.
| Day of week | Average births per day | Versus average day (%) |
|---|---|---|
| Monday | 11,607 | +3.9 |
| Tuesday | 12,842 | +14.9 |
| Wednesday | 12,621 | +12.9 |
| Thursday | 12,552 | +12.3 |
| Friday | 12,349 | +10.5 |
| Saturday | 8,622 | -22.8 |
| Sunday | 7,635 | -31.7 |
Tuesday leads, followed by Wednesday and Thursday, and Sunday is the quietest day at 31.7% below average. Saturday and Sunday together hold 20.8% of all births, where an even spread would give them 28.6%. Scheduled deliveries explain most of that shortfall.
Inductions and cesareans can be booked for weekday slots, while spontaneous labor does not follow the working week. The mean age of mothers at first birth reached a record 27.6 years in 2024, and the average age of mothers worldwide page shows how that compares across countries.
August Is the Biggest Month and September the Busiest Per Day
Month rankings depend on how they are measured. Total births favor long months, while births per day correct for length. The table uses the 1994–2014 series.
| Month | Average births per day | Average births per month | Busiest date (rank of 366) |
|---|---|---|---|
| January | 10,721 | 332,349 | January 24 (200) |
| February | 10,981 | 310,081 | February 14 (62) |
| March | 10,979 | 340,351 | March 21 (149) |
| April | 10,874 | 326,225 | April 4 (143) |
| May | 11,022 | 341,684 | May 23 (89) |
| June | 11,306 | 339,171 | June 27 (71) |
| July | 11,563 | 358,442 | July 7 (7) |
| August | 11,712 | 363,077 | August 8 (15) |
| September | 11,811 | 354,317 | September 9 (1) |
| October | 11,204 | 347,325 | October 1 (47) |
| November | 10,927 | 327,818 | November 21 (76) |
| December | 10,991 | 340,719 | December 20 (11) |
August had the most births in total, 363,077 a month, ahead of July and September. September led per day at 11,811, 10.2% above January’s 10,721, the lowest of the year. February’s 310,081 is the smallest monthly total because it has the fewest days.
More recent counts shift the peak toward August. CDC data for 2023, when 3,596,017 births were registered, put August on top both ways.
| Month (2023) | Births | Births per day (calculated) |
|---|---|---|
| August | 322,000 | 10,387 |
| July | 312,000 | 10,065 |
| October | 309,000 | 9,968 |
| September | 305,000 | 10,167 |
| December | 297,000 | 9,581 |
| April | 279,000 | 9,300 |
| February | 271,000 | 9,679 |
August’s 10,387 births a day is 5.4% above the 2023 average of 9,852. An analysis of CDC WONDER records for 2016 to 2023 found August was the peak month in 45 of the 50 states. Monthly counts here are rounded figures as reported by the sources listed below, and the remaining months were not published in the sources used.
Fewer Births Every Day Than a Generation Ago
The average day brought 11,175 births in the 1994–2014 series. In 2024, the United States registered 3,628,934 births, about 9,915 a day, which is 11.3% fewer. That 2024 total rose 1% from 2023, but the total fertility rate fell to a record low of 1,599.5 births per 1,000 women, according to the National Center for Health Statistics. Every date in the rankings above is therefore quieter today in absolute terms.
Births in 2024 equal 10.7 per 1,000 residents, a different measure from the 53.8 births per 1,000 women aged 15 to 44, as the birth rate vs fertility rate explainer details. The longer decline is charted in US fertility rate trends. People born in the 1994–2014 window are now aged roughly 12 to 32, and their numbers appear in the US population by age group.
What the Birth Calendar Shows About Timing
The US birth calendar is shaped far more by timing than by chance. September 9 leads at 12,344 births a year, Christmas trails at 6,601, Tuesday outruns Sunday by 68%, and August holds the largest monthly total in recent CDC counts. Each of those gaps points to the same two forces: when conceptions cluster, and how many deliveries are booked in advance, with induction and cesarean births each accounting for roughly a third of the 2024 total. The firmest finding is the weekend and holiday trough, which fits a scheduling mechanism.
The seasonal peak is less certain, since the best date-level series stops in 2014 while births have drifted down to 3.63 million a year with fertility at a record low of 1,599.5 per 1,000 women. If obstetric practice keeps moving toward planned deliveries, the weekday and holiday gaps could widen further, while the September peak depends on conception habits that are harder to predict. The wider forces behind these totals are laid out in the US population growth rate analysis.
Frequently Asked Questions
1. What is the most common birthday in the US?
September 9. It averaged 12,344 births a year between 1994 and 2014 in the combined CDC and Social Security series, 10.5% above the average day. Some published versions give 12,301 for the same date, depending on how the two data series are merged.
2. What is the least common birthday in the US?
December 25 is the least common, at 6,601 births a year, 40.9% below an average day. February 29 occurs only every fourth year, but by births per occurrence, it ranks 347th of 366 dates, at 10,512, far above Christmas.
3. Which month has the most births in the US?
August. The CDC counted about 322,000 births in August 2023, or 10,387 a day. In the 1994–2014 series August also had the most births in total (363,077 a month), although September led per day at 11,811.
4. Which day of the week do most babies get born?
Tuesday, with an average of 12,842 births a day in the 1994–2014 series. Wednesday (12,621) and Thursday (12,552) follow. Sunday is the lowest at 7,635, so Tuesday births run about 68% higher than Sunday births.
5. Why are so many US birthdays in September?
The most cited reason is conception around the winter holidays, which places births about nine months later. In the 1994–2014 series, 9 of the 10 most common dates fall in September. The data records birth dates only, so the holiday link is an inference and not a measured result.
6. Why is December 25 the rarest birthday?
Scheduled deliveries mostly avoid holidays. December 25 averages 6,601 births against 11,175 for an average day, and January 1 (7,827) and December 24 (8,103) follow. In 2024, 33.9% of births followed induction and 32.4% were cesareans, the two types of delivery that can be planned.
7. Are fewer babies born on Friday the 13th?
Slightly. Across 35 Fridays that fell on the 13th, births averaged 11,744, which is 5.1% lower than the 12,369 average for other Fridays in the series. The effect is much smaller than the 40.9% dip on Christmas Day.
8. How many babies are born in the US each day?
About 9,915 in 2024, based on 3,628,934 births over 366 days. The 1994–2014 series averaged 11,175 a day. A running estimate for the current year appears on the USA live population clock.
9. How likely is it that two people share a birthday?
In a group of 23 people, the chance that at least two share a birthday is 50.7%, assuming all 365 dates are equally likely. Real birthdays are uneven, with September heavy and Christmas light, which nudges the true probability slightly higher.
10. Are these date rankings still current?
They describe 1994–2014, the latest period with published daily counts used here. The CDC’s public natality files report the month and weekday of birth, and total births have since fallen to 3,628,934 in 2024. Fresh date-level counts could shift individual ranks, as the first and second dates are only 59 births apart.
Sources
- FiveThirtyEight. US births data, CDC National Center for Health Statistics 1994–2003 (used for 1994–1999) and Social Security Administration 2000–2014.
- National Center for Health Statistics. Births: Final Data for 2024. National Vital Statistics Reports, Vol. 75, No. 2 (June 9, 2026).
- National Center for Health Statistics. Births in the United States, 2024. NCHS Data Brief No. 535 (July 2025).
- CDC WONDER. Natality documentation (month and weekday fields).
- The Mother Baby Center. Most popular birth months in the U.S., citing 2023 CDC data (January 2026).
- The Bump. What’s the most common birth month? (2023 CDC monthly counts).
- Kremp. Most common birth month and year in each state (CDC WONDER 2016–2023).
- HowStuffWorks. What is the most popular birthday in the US? (12,301 figure).
- AgeFinder. The most common birthdays and the rarest ones, ranked (12,344 cross-check).