Every few months, a headline declares that some country is facing a demographic crisis, or conversely, that its population is booming out of control. The numbers cited, whether a national birth rate or a plummeting fertility rate, shape immigration policy, retirement systems, school construction budgets, and healthcare infrastructure.
Yet the two metrics behind these headlines are routinely conflated, even in policy discussions where precision genuinely matters. The birth rate and the fertility rate are not synonyms. They measure fundamentally different phenomena, and using one when you mean the other produces badly distorted conclusions.
Japan is a case that illustrates this vividly. Its crude birth rate has hovered around 6 to 7 births per 1,000 people in recent years, which sounds merely low. Its total fertility rate, however, hit 1.20 in 2023, the lowest recorded in the country’s modern history according to Japan’s Ministry of Health, Labour and Welfare, a figure so far below the replacement threshold of 2.1 that demographers describe it as a structural emergency. These two numbers tell the same story from different angles, but they are not interchangeable, and treating them as such leads to misreading the severity of what Japan is experiencing.
The birth rate vs fertility rate distinction matters far beyond academic demographics. Policymakers designing pension systems, urban planners projecting school enrollment, and public health officials forecasting hospital capacity all rely on knowing exactly which metric they are working with.
Getting this wrong does not just produce an imprecise answer; it can produce policy that works in the opposite direction from what was intended. The pages that follow break down both measures with the precision the subject demands.
What the Crude Birth Rate Actually Measures
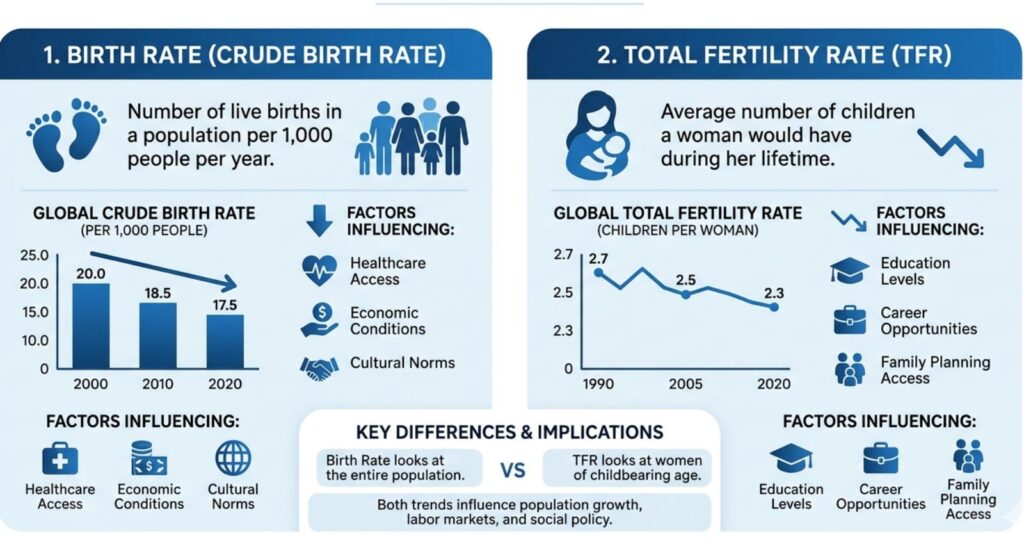
The crude birth rate (CBR) is one of the oldest demographic indicators in use. It is calculated as the number of live births in a given year divided by the total midyear population of a country or region, multiplied by 1,000. The result is expressed as births per 1,000 people.
The word “crude” is not pejorative; it means the rate uses the total population as its base without adjusting for age or sex composition. That simplicity is both its strength and its primary limitation.
The CBR can be calculated quickly from basic civil registration data, which makes it useful for tracking trends over time and comparing countries at a broad level. The World Bank and United Nations Population Division publish CBR data for virtually every country annually, making it one of the most accessible demographic figures in existence.
Why Age Structure Distorts the Birth Rate
Here is where the crude birth rate runs into trouble. A country with a large proportion of people aged 20 to 35, the prime reproductive years, will record a higher CBR than a demographically older country, even if women in both countries are having the same number of children on average.
An aging population has fewer people in reproductive age groups, which mechanically pushes the CBR down regardless of whether individual women’s childbearing decisions have changed at all.
Germany’s crude birth rate was approximately 8.5 births per 1,000 in 2022. Uganda’s rate was approximately 41 per 1,000. These numbers look worlds apart.
But a significant portion of that gap reflects the fact that Germany’s population has a much older age structure, a larger share of its people are past reproductive age. The CBR does not control for that. The total fertility rate does.
What the Total Fertility Rate Actually Measures
The total fertility rate (TFR) is the demographic world’s attempt to answer a more precise question: if a woman were to live through her entire reproductive lifespan (defined as ages 15 to 49) and experience current age-specific fertility rates at each year of age, how many children would she have in total?
The TFR is calculated by summing age-specific fertility rates across all reproductive age groups.
Because it controls for age structure by focusing specifically on women in their childbearing years, the TFR is a far more reliable indicator of actual reproductive behavior than the CBR. It answers the question that demographers and planners most often need answered: Are women having more or fewer children than the previous generation?
The Replacement Rate and Why 2.1 Matters
The widely cited replacement-level fertility rate of 2.1 children per woman is not arbitrary. It accounts for the fact that not every child born will survive to reproductive age, and that slightly more boys are born than girls.
In high-income countries with low infant and child mortality, 2.1 is the approximate TFR at which a population neither grows nor shrinks over the long term. In countries with higher child mortality, the replacement rate is higher, sometimes reaching 3.0 or above.
A TFR consistently below 2.1 does not trigger an immediate population decline. Population momentum, the continued growth driven by a large existing cohort of young adults having children, can sustain growth for decades even as the TFR falls below replacement.
South Korea’s TFR dropped below 1.0 in 2023, according to Statistics Korea, a level that has no historical precedent among major economies. Yet South Korea’s total population has not collapsed overnight, precisely because of this lag effect. The crisis is structural and slow-moving, not sudden.
Where the Two Metrics Diverge and Why It Matters
The table above captures the core structural differences between the CBR and TFR. But the real-world divergence between the two figures has produced some genuinely counterintuitive situations worth examining.
Consider a rapidly aging country with a declining TFR. Its CBR may still look relatively stable for years because the large cohorts of people born during higher-fertility decades are still alive and still part of the denominator. Now consider a young, high-growth nation where a massive youth bulge is entering reproductive age.
Even if each woman is having fewer children than her mother did, the sheer number of women entering peak childbearing years can drive the CBR upward. Both scenarios, the aging country and the young one, can show misleading CBR signals that the TFR quickly corrects.
Population Momentum and the Hidden Time Bomb
Demographers call this phenomenon population momentum, and it is one of the most misunderstood dynamics in the field. A 2006 study by Wolfgang Lutz, Warren Sanderson, and Sergei Scherbov published in the journal Nature modeled the demographic trajectories of low-fertility nations and found that even with immediate recovery to replacement-level fertility, many European countries would still experience decades of population aging due to the momentum already built into their age structures. The CBR alone would not have predicted this. The TFR, combined with age-structure modeling, does.
This is exactly why the United Nations Population Division relies on TFR projections, not CBR data, when producing its World Population Prospects, the authoritative source of long-range demographic forecasting used by governments, international development agencies, and financial institutions worldwide.
How Countries Use Each Metric in Practice
Different institutional contexts call for different measures. Public health planners tracking maternal health services, obstetric care capacity, and newborn nutrition programs often work with the CBR because it tells them how many births to expect in a given population in the near term. The CBR is practical, current, and directly translatable into resource allocation decisions.
Urban planners and education ministries, by contrast, need the TFR. Building a school takes years; the students who will fill it are not yet born. Projecting how many children will be school-aged in a given district in a decade requires understanding not just how many babies are being born today, but how many women of childbearing age will be living in that area over the next several years and how many children they are likely to have.
Pension system architects rely on TFR data most heavily of all. The ratio of working-age contributors to pension-drawing retirees, what economists call the support ratio, is driven by long-term fertility trends, not by year-to-year birth counts. Japan’s pension system began its structural reform process in the early 2000s, partly in response to TFR data that made the trajectory of its support ratio mathematically inevitable decades in advance.
Regional Variation Within Countries
One underappreciated complication is that both metrics vary significantly within countries, not just between them. The United States national TFR was approximately 1.62 in 2023, according to the CDC’s National Center for Health Statistics.
But state-level variation is substantial: South Dakota and Utah have consistently recorded TFRs well above the national average, while California and Massachusetts sit significantly below it. Urban-rural divides within single countries often exceed the fertility differences between neighboring nations.
Global Patterns: High-Fertility and Low-Fertility Worlds
The world today is effectively split into two demographic realities. Sub-Saharan Africa remains the region with the highest fertility rates globally, with the United Nations Population Division’s 2022 World Population Prospects estimating a regional TFR of approximately 4.6.
Niger, consistently among the highest in the world, recorded an estimated TFR of 6.8 in recent years. These are not solely the product of a lack of contraceptive access; they also reflect social and economic structures in which large families serve as economic assets and old-age security mechanisms.
At the other end of the spectrum, East Asia has emerged as the epicenter of the global low-fertility trend. South Korea’s TFR of 0.72 in 2023 made it the lowest ever recorded for any country. Taiwan and Hong Kong are similarly positioned below 1.0. These are not merely demographic curiosities; they represent a fundamental change in the economics of child-rearing in highly urbanized, high-cost, credentialist economies, where the financial and time cost of raising a child has become prohibitive for many younger adults.
Europe’s situation is more varied. France has maintained a relatively higher TFR among Western European nations, approximately 1.7, partly through explicit pronatalist policies including generous parental leave, subsidized childcare, and family tax benefits.
Scandinavian countries have similarly deployed policy levers to moderate their fertility declines, though none have managed to return to replacement level. Eastern Europe, particularly Bulgaria, Latvia, and Moldova, has experienced some of the steepest declines, compounded by the outmigration of young adults.
The Role of Migration in the Birth Rate Picture
Any discussion of birth rate and fertility rate data that ignores migration is incomplete. Immigration can raise a country’s CBR independently of any change in its TFR, because immigrants, especially economic migrants, tend to be younger and disproportionately concentrated in reproductive age groups. The United States maintained a CBR above what its domestic TFR alone would predict for much of the 2000s and 2010s, partly because of the age structure of its immigrant population.
This creates a politically sensitive but demographically significant nuance. Countries like Canada, Australia, and Germany have explicitly leveraged immigration policy as a demographic management tool, partly to compensate for low domestic TFRs. Whether this constitutes a genuine solution to demographic aging or merely delays the reckoning is a question demographers debate actively. The TFR of immigrant populations typically converges toward host-country levels within one to two generations, which means that sustained immigration can moderate but not permanently offset structural low fertility.
Closing Perspective
The birth rate and fertility rate are not competing measures; they are complementary lenses trained on different aspects of the same underlying reality. The crude birth rate captures what is happening now, how many children are being born relative to the existing population, which makes it useful for immediate resource planning and short-term public health work.
The total fertility rate captures what is likely to happen over a generation, the childbearing behavior of women across their reproductive lifespan, which makes it an indispensable tool for structural policy planning, from pension design to housing supply to school infrastructure.
The stakes attached to reading these numbers correctly are high. Demographic miscalculation has produced pension crises, unexpected labor shortages, school systems built in the wrong places, and healthcare systems under-resourced for the populations they serve.
A country that mistakes a temporarily stable CBR for evidence that its fertility situation is under control, while its TFR continues to fall, is setting itself up for a structural adjustment that will arrive with compounding force. The numbers, read carefully and in full context, rarely lie; the problem is almost always in how they are interpreted.
FAQ
What is the difference between birth rate and fertility rate?
The birth rate (crude birth rate) measures the number of live births per 1,000 people in the total population per year. The fertility rate (total fertility rate) measures the average number of children a woman would have over her entire reproductive lifetime at current age-specific rates. The key difference is the denominator: the birth rate uses the whole population, while the fertility rate focuses specifically on women in reproductive age groups.
What is a normal birth rate for a country?
Crude birth rates vary enormously by region and development level. High-income countries typically range from 7 to 13 births per 1,000 people per year, while some Sub-Saharan African nations record rates of 35 to 50 per 1,000. A rate below roughly 14 to 15 per 1,000 in a country without significant immigration tends to produce long-term population decline, though the exact threshold depends heavily on the age structure.
What does a fertility rate of 2.1 mean?
A total fertility rate of 2.1 is known as the replacement-level fertility rate. It means each generation is producing just enough children to replace itself in the population, accounting for the fact that some children will not survive to reproductive age and that slightly more boys are born than girls. Countries with sustained TFRs below 2.1 will eventually see their populations shrink, barring offsetting immigration.
Why can a country’s birth rate rise while its fertility rate falls?
This happens because of changes in age structure. If a large cohort of young adults born during a high-fertility decade enters reproductive age simultaneously, total births rise even if each woman is having fewer children than her mother did. The birth rate reflects the absolute number of births, while the fertility rate reflects individual childbearing behavior, and the two can move in opposite directions during generational transitions.
Which metric is more useful for policy planning?
It depends on the planning horizon. The crude birth rate is more useful for short-term resource allocation, estimating how many hospital maternity beds, newborn care units, or infant nutrition programs a region needs in the near future. The total fertility rate is more useful for long-range structural planning, such as pension system design, school construction, and immigration policy, because it reflects underlying generational trends rather than the current age composition of the population.
What country has the lowest fertility rate in the world?
As of 2023, South Korea recorded a total fertility rate of approximately 0.72, the lowest ever measured for a major national economy, according to Statistics Korea. Several other East Asian economies, including Hong Kong, Taiwan, and Singapore, have also recorded TFRs below 1.0 in recent years, a level with no modern historical precedent.
Does immigration affect birth and fertility rates?
Immigration affects the crude birth rate more directly than the total fertility rate, because immigrants, particularly economic migrants, tend to be younger and concentrated in reproductive age groups, which mechanically increases births relative to the total population. The total fertility rate of immigrant groups typically converges toward host-country levels within one or two generations, limiting immigration’s long-term demographic impact on the TFR.
What causes a country’s fertility rate to decline?
Fertility rate declines are associated with a cluster of interconnected factors: urbanization, increased female educational attainment and labor force participation, rising cost of housing and childcare, delayed marriage, and expanded access to contraception. Economic uncertainty, particularly housing unaffordability among young adults, has emerged as a significant proximate driver in high-income East Asian and European economies over the past two decades.
Can governments increase fertility rates through policy?
Policy interventions have a modest but measurable impact. France, Scandinavia, and Hungary have all deployed pronatalist policies, including subsidized childcare, extended parental leave, and financial incentives for larger families. The evidence suggests these measures can slow fertility decline and, in some cases, produce small recoveries, but no high-income country has succeeded in returning its TFR to replacement level through policy intervention alone. Cultural, economic, and urban structural factors appear to exert a stronger long-term influence.
How does infant mortality affect fertility rate calculations?
Infant and child mortality rates affect the replacement-level TFR rather than the TFR calculation itself. In low-mortality high-income countries, replacement fertility is approximately 2.1 children per woman. In countries with higher child mortality, the replacement level rises, sometimes to 3.0 or higher, because a greater number of births are required to ensure two children survive to adulthood. This is why high-TFR regions and high child mortality regions overlap significantly on a global map.