
August is the most common US birthday month, with about 322,000 births in 2023, while February has the fewest births and April the fewest per day.
Key Takeaways
- August is the most common birthday month in the US, with about 322,000 births in 2023 (9.0% of the year), followed by July (312,000) and October (309,000).
- February has the fewest births in total at 271,000, but after adjusting for month length April is the quietest month at 9,300 births a day, 5.5% below the 2023 average day.
- July to September delivered 26.1% of 2023 births, and September led the per-day ranking in 1994–2014 (11,811 a day) before August took over.
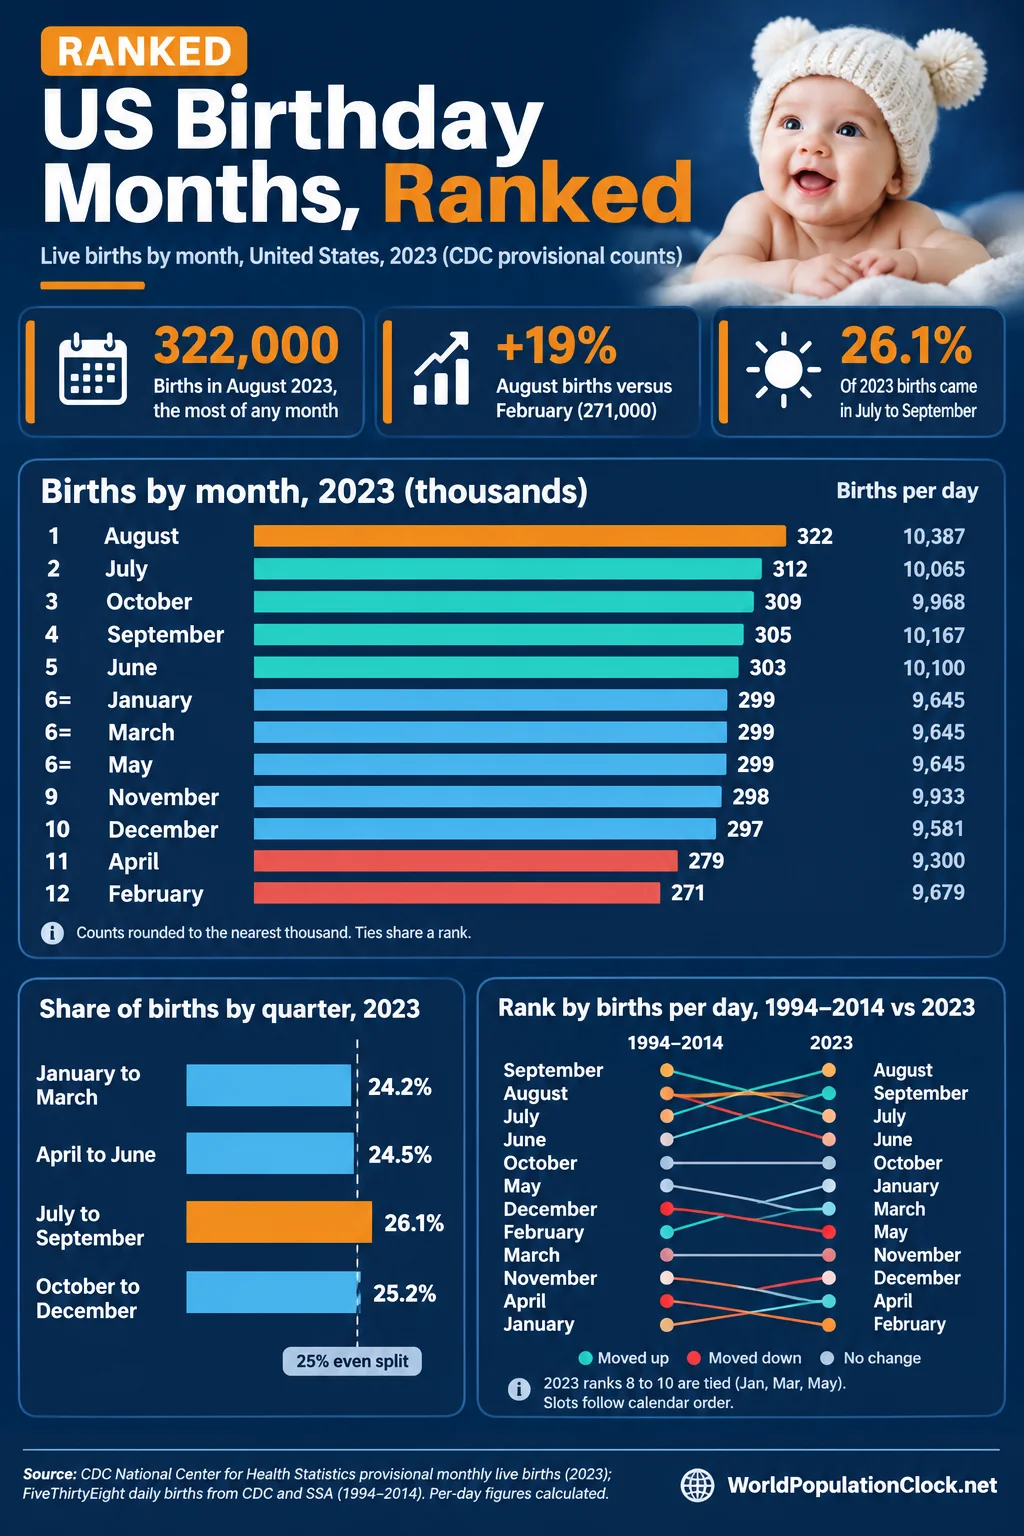
August births outnumber every other month’s in the most recent complete CDC monthly counts, about 322,000 in 2023 against 271,000 in February, a gap of 19%. The ranking is tighter than the headline suggests, though. The five busiest months sit within about 6% of each other, and three months tie at 299,000, so small shifts in the data reorder the middle of the table.
Two measures matter. Total births favor 31-day months, while births per day correct for month length. They give different answers for February, which has the smallest total but is not the quietest month once its 28 days are counted. This article ranks all 12 months both ways, compares 2023 with the 1994–2014 pattern, and checks the result against state and Canadian data. To see how your own birth date compares, the how many people share your birthday tool covers dates.
The 2023 counts are provisional monthly live births published by the National Center for Health Statistics on data.cdc.gov, rounded to the nearest thousand. They sum to 3.593 million, slightly below the 3,596,017 final count for the year. The 1994–2014 figures are averages recomputed from daily counts published by FiveThirtyEight from CDC (1994–1999) and Social Security Administration (2000–2014) records. The two sources count births at different levels, so ranks are compared rather than raw numbers. Per-day figures and shares are calculated from the monthly counts.
August Tops the Ranking by Total Births
The table ranks the 12 months by births in 2023. Months with the same count share a rank.
| Rank | Month | Births (2023) | Share of year (%) | Births per day | Versus average day (%) |
|---|---|---|---|---|---|
| 1 | August | 322,000 | 9.0 | 10,387 | +5.5 |
| 2 | July | 312,000 | 8.7 | 10,065 | +2.2 |
| 3 | October | 309,000 | 8.6 | 9,968 | +1.3 |
| 4 | September | 305,000 | 8.5 | 10,167 | +3.3 |
| 5 | June | 303,000 | 8.4 | 10,100 | +2.6 |
| 6= | January | 299,000 | 8.3 | 9,645 | -2.0 |
| 6= | March | 299,000 | 8.3 | 9,645 | -2.0 |
| 6= | May | 299,000 | 8.3 | 9,645 | -2.0 |
| 9 | November | 298,000 | 8.3 | 9,933 | +0.9 |
| 10 | December | 297,000 | 8.3 | 9,581 | -2.7 |
| 11 | April | 279,000 | 7.8 | 9,300 | -5.5 |
| 12 | February | 271,000 | 7.5 | 9,679 | -1.7 |
August’s 322,000 births equal 9.0% of the year, against 7.5% for February. Per day the gap narrows to 7.3%, from 10,387 births in August to 9,679 in February. Five summer and early autumn months, June through October, take the top five places by per-day rate, so the seasonal peak is real even after allowing for month length.
The ranking therefore holds whichever way it is measured: the same five months lead on totals and on daily rates, and February is the biggest mover between the two measures, from last to seventh. The three-way tie reflects rounding to thousands, not identical months.
Adjusting for Month Length Moves February Up and April Down
A month’s raw total says little about how busy its days were. The table below ranks the months by births per day in 2023 and sets the result beside the 1994–2014 ranking.
| Month | Births per day (2023) | Rank (2023) | Births per day (1994–2014) | Rank (1994–2014) |
|---|---|---|---|---|
| August | 10,387 | 1 | 11,712 | 2 |
| September | 10,167 | 2 | 11,811 | 1 |
| June | 10,100 | 3 | 11,306 | 4 |
| July | 10,065 | 4 | 11,563 | 3 |
| October | 9,968 | 5 | 11,204 | 5 |
| November | 9,933 | 6 | 10,927 | 10 |
| February | 9,679 | 7 | 10,981 | 8 |
| January | 9,645 | 8= | 10,721 | 12 |
| March | 9,645 | 8= | 10,979 | 9 |
| May | 9,645 | 8= | 11,022 | 6 |
| December | 9,581 | 11 | 10,991 | 7 |
| April | 9,300 | 12 | 10,874 | 11 |
Three results stand out. April is the quietest month per day in 2023, at 9,300 births, not February. September led the older series at 11,811 births a day, with August second, and the two have since swapped places. The top five months by per-day rate, August, September, June, July and October, are the same five months as in 1994–2014, only in a different order.
The biggest movers are January (12th to a tie for 8th), November (10th to 6th) and December (7th to 11th). The per-day levels are lower in 2023 across the board because the number of births has fallen. The 1994–2014 average day was 11,175 births, and in 2023 it was about 9,844.
The seasonal swing has not shrunk with them. In 2023, the best month per day (August, 10,387) beat the worst (April, 9,300) by 11.7%. In 1994–2014, the gap between September (11,811) and January (10,721) was 10.2%. A smaller population has not flattened the year, which points to timing patterns that are structural and not tied to the size of each birth cohort.
Late Summer Delivers One Birth in Four
Grouping months into quarters smooths the rounding. July to September holds the largest share of births in both periods.
| Quarter | Births (2023) | Share (2023, %) | Share (1994–2014, %) |
|---|---|---|---|
| January to March | 869,000 | 24.2 | 24.1 |
| April to June | 881,000 | 24.5 | 24.7 |
| July to September | 939,000 | 26.1 | 26.4 |
| October to December | 904,000 | 25.2 | 24.9 |
The third quarter’s 26.1% share in 2023 is 1.1 percentage points above an even 25% split, and the first quarter is the lowest at 24.2%. The shares barely moved between the two periods, which suggests the seasonal shape is stable even as total births fell. The most cited explanation is that births in August and September follow conceptions in November and December, around the winter holidays. These figures record birth months only, so the conception link is an inference, not a measured result.
State and Country Data Back the Late-Summer Peak
Indiana publishes monthly birth counts by year, and its official figures show the same pattern. August was the top month in 7 of the 10 years from 2008 to 2017, with July leading in 2009 and 2015 and September in 2010. In 2016, for example, Indiana recorded 7,565 births in August against 6,408 in February. An analysis of CDC WONDER records for 2016 to 2023 found August was the peak birth month in 45 of 50 states. For state-level population and daily birth counts, see the US live population clock by state.
Canada shows a similar but not identical pattern. In 2014, July had the most hospital births at 26,488 and February the fewest at 21,531, according to the Public Health Agency of Canada’s Health Infobase. The peak is not the same month everywhere, which is one reason the US ranking should not be read as a world ranking.
Early 2024 Months Shift the Order Again
The CDC’s provisional series also covers the first half of 2024. Births in January to June 2024 were 1.76 million, 0.6% above the same months of 2023.
| Month | Births (2023) | Births (2024) | Change in total (%) | Change per day (%) |
|---|---|---|---|---|
| January | 299,000 | 297,000 | -0.7 | -0.7 |
| February | 271,000 | 283,000 | +4.4 | +0.8 |
| March | 299,000 | 298,000 | -0.3 | -0.3 |
| April | 279,000 | 289,000 | +3.6 | +3.6 |
| May | 299,000 | 302,000 | +1.0 | +1.0 |
| June | 303,000 | 291,000 | -4.0 | -4.0 |
May 2024 was the busiest month of that half-year, at 302,000, while June fell 4.0% from the year before. February’s 4.4% rise in total mostly reflects the leap day, since the per-day change is 0.8%. For the full year, the National Center for Health Statistics counted 3,628,934 births in 2024, an average of about 302,400 a month, up 1% from 2023 even as fertility fell to a record low. The wider decline is charted in US fertility rate trends, and the gap between a birth rate and a fertility rate is explained in birth rate vs fertility rate. Second-half 2024 monthly counts were not available in the sources used.
Why the Ranking Favors Late Summer
The calendar of US births rewards late summer. August leads the 2023 ranking at about 322,000 births and 10,387 a day; July and October follow, and the third quarter takes 26.1% of the year. February finishes last in total only because it is the shortest month, while April is the quietest per day. The ordering has shifted at the edges since 1994–2014, with August overtaking September and January climbing, yet the top five months are unchanged.
The firmest conclusion is the late-summer peak, which appears in national counts, in Indiana’s official tables and in Canadian hospital data. The weakest part is the explanation: conception timing fits the pattern but is not measured in these counts.
The data also change slowly while volumes fall, with 3.63 million births in 2024 and a record-low fertility rate. Smaller annual totals make single-month rankings less stable, so the margins between months matter less than the shape of the year. The wider forces behind that decline are covered in the US population growth rate analysis.
Frequently Asked Questions
1. What is the most common birthday month in the US?
August. The CDC’s provisional count shows about 322,000 births in August 2023, 9.0% of the year and the most of any month. July (312,000) and October (309,000) follow. In the 1994–2014 series, August also had the most births in total, at 363,077 a month.
2. What is the least common birthday month in the US?
February has the fewest births, at 271,000 in 2023, because it has only 28 days. After adjusting for length, April is the quietest month, at 9,300 births a day in 2023, 5.5% below the average day of about 9,844.
3. Which birthday month has the most births per day?
August in 2023, at 10,387 births a day, followed by September (10,167). In the 1994–2014 series, the order was reversed, with September at 11,811 a day and August at 11,712. The two months are close, and which one leads has changed.
4. Which season has the most birthdays?
Late summer. July to September accounted for 939,000 births in 2023, or 26.1%, compared with 24.2% for January to March. In the 1994–2014 series, the third quarter’s share was 26.4%, so the seasonal shape has barely changed.
5. Why are so many US birthdays in August and September?
The most cited explanation is conception around the winter holidays, which places births eight to nine months later. The data records only birth dates, so the link is an inference. Seasonal patterns in births have held across both the 1994–2014 and 2023 data.
6. Is August the top birthday month in every state?
Nearly. An analysis of CDC WONDER records for 2016 to 2023 found August was the peak month in 45 of 50 states. In Indiana’s official counts, August led in 7 of the 10 years from 2008 to 2017, with July and September each winning some years.
7. How many babies are born in the US each month?
The average is about 302,400 a month, based on the 3,628,934 births registered in 2024. In 2023 the range ran from 271,000 in February to 322,000 in August. Estimates for the current year appear on the USA live population clock.
8. Is the most common birth month the same in other countries?
Not always. In Canada, July had the most hospital births in 2014 (26,488) and February the fewest (21,531). That resembles the US pattern, but the peak month differs, and the sources used here did not cover countries in the Southern Hemisphere.
9. Did the busiest month change between 1994–2014 and 2023?
Slightly. By births per day, September led 1994–2014, and August leads 2023. The top five months by per-day rate are the same five in both periods, only reordered: August and September swapped first and second, and June and July swapped third and fourth. January rose from 12th to a tie for 8th.
10. How reliable are the monthly counts?
The 2023 figures are provisional and rounded to the nearest thousand, which is why January, March and May tie at 299,000. They sum to 3.593 million against a final count of 3,596,017. Differences of a few thousand births between months should be treated as ties, not rankings.
Sources
- National Center for Health Statistics, CDC. Provisional monthly counts of live births, United States, 2023 to June 2024 (data.cdc.gov dataset hmz2-vwda).
- National Center for Health Statistics. Births: Final Data for 2024. National Vital Statistics Reports, Vol. 75, No. 2 (June 2026).
- FiveThirtyEight. US births data, CDC National Center for Health Statistics 1994–2003 (used for 1994–1999) and Social Security Administration 2000–2014.
- Indiana Department of Health. Indiana Natality Report 2017, Table 4: Number and Percent of Live Births by Month, 2008–2017.
- Public Health Agency of Canada. Hospital Births in Canada (Health Infobase data blog, 2014 data).
- Kremp. Most common birth month and year in each state (CDC WONDER 2016–2023).
- CDC WONDER. Natality documentation.