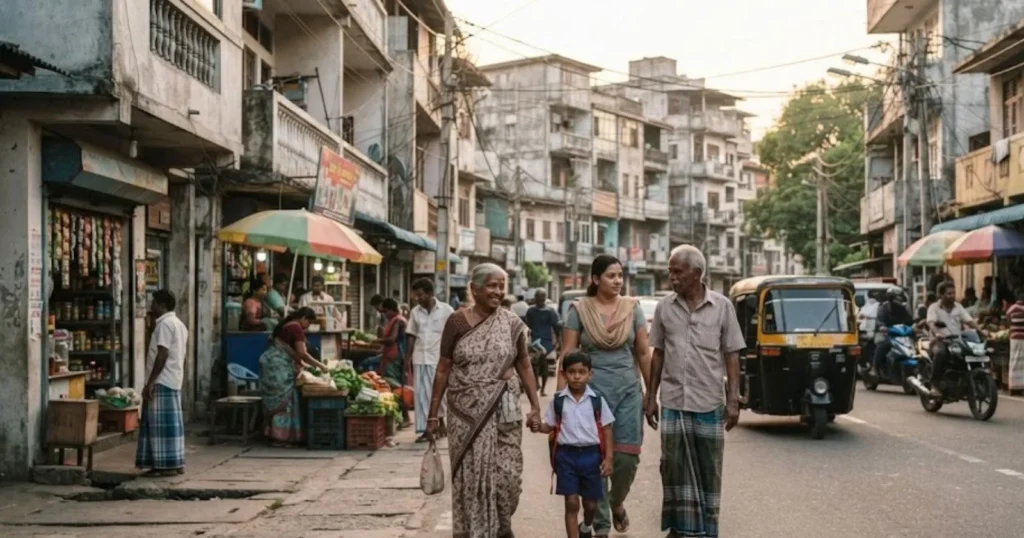
Sri Lanka entered its 2022 economic crisis already demographically older than most of its income peers. The country had completed a fertility transition decades earlier, life expectancy was high, and the share of older people was rising steadily. The crisis, which brought a sovereign default in April 2022, a sharp contraction in output, very high inflation and shortages of fuel and medicine, added a new factor: a surge in people leaving to work abroad.
The 2024 Census of Population and Housing, conducted from December 19, 2024 and released in final form on October 30, 2025, gives the clearest picture so far. It counted 21,781,800 people, growth of only 0.5 percent a year, 18 percent aged 60 and above and a median age of 35.
This article separates long running demographic change from effects that can be attributed to the crisis, explains the evidence on emigration, fertility and workforce change, and presents official projections with their uncertainty. Sources include the Department of Census and Statistics, the Registrar General, the Department of Immigration and Emigration, the Central Bank of Sri Lanka, the Sri Lanka Bureau of Foreign Employment, the World Bank, the International Organization for Migration (IOM) and UNFPA.
Sri Lanka’s Demographic Position Before and After the Crisis
The census and annual estimates differ in method. A census counts people on a reference date. Annual mid year estimates update the last census count using births, deaths and recorded arrivals and departures. Both are used below, labeled.
| Indicator | 2012 census | 2024 census | Change |
|---|---|---|---|
| Population | 20,359,439 | 21,781,800 | Plus 1,437,310 (some sources differ slightly) |
| Annual growth | About 0.7% | About 0.5% | Slower |
| Aged 0 to 14 | 25.2% | 20.7% | Down 4.5 points |
| Aged 15 to 64 | 66.9% | 66.7% | Roughly flat |
| Aged 65 and above | 7.9% | 12.6% | Up 4.7 points |
| Aged 60 and above | About 6.6% (1981) to 18% (2024) | 18% (3,921,124) | Nearly tripled over four decades |
| Median age | About 30 | 35 | Up about five years |
| Dependency ratio | Lower | 49.8% | Rising |
The crisis timeline matters for interpretation. Sri Lanka suspended external debt payments in April 2022, output fell sharply that year, inflation peaked above 60 percent in late 2022, and an International Monetary Fund program was approved in March 2023. Economic indicators have since stabilized, though household finances recovered unevenly. Demographic effects of the crisis therefore sit on top of a long trend, and the periods before and after 2022 should be compared with care.
Is Sri Lanka’s Population Growth Slowing or Reversing?
Growth is slowing, and in some recent periods the population has declined. The Department of Census and Statistics reports average annual growth falling from about 2.8 percent in the 1950s to 0.5 percent in 2012 to 2024. Recent vital statistics show births below 230,000 a year, compared with more than 350,000 in the early 2000s. The AsiaNews report on a policy dialogue cited 228,091 births in 2024.
The mid year population estimate for 2025 gives a sharp illustration. For the period from December 19, 2024 to June 30, 2025, provisional data show 110,652 births and 95,181 deaths, a natural increase of 15,471, against net migration of minus 41,002. The result was a population change of minus 25,531 over six months. Population decline in this period was therefore caused by migration, not by natural decrease.
| Component | Dec 2024 to June 2025 (provisional) |
|---|---|
| Births | 110,652 |
| Deaths | 95,181 |
| Natural increase | 15,471 |
| Net migration | Minus 41,002 |
| Population change | Minus 25,531 |
A six month figure is not a trend, since migration varies by period and the data cover only recorded departures and arrivals. Natural decrease, where deaths exceed births, has not yet occurred nationally, but narrowing natural increase makes migration the swing factor. United Nations projections from the 2022 revision suggested growth would end around 2035 and be followed by decline.
Fertility Decline and the Changing Age Structure
Sri Lanka’s total fertility rate fell from about 5.3 in 1953 to about 1.97 in 2023, below replacement. The country reached near replacement fertility in the 1990s, and it has hovered around 2 for decades. The recent drop in births to about 228,000 reflects fewer women in prime childbearing ages, later marriage and smaller family preferences, with economic uncertainty possibly adding to delay.
| Fertility factor | Evidence | Caution |
|---|---|---|
| Education and female participation | High female literacy | Long running, not crisis related |
| Later marriage | Rising age at marriage | Data on family formation limited |
| Economic uncertainty | Plausible short term effect | Not proven as a cause |
| Smaller cohorts of women | Past fertility decline | Structural |
| Migration of young adults | Reduces births in country | Counted partly in net migration |
Long term fertility trends should not be inferred from a single crisis period. Births may rebound modestly or continue falling, and evidence that the crisis changed fertility intentions needs survey data that are only beginning to appear.
Emigration, Brain Drain, and the Loss of Working Age Residents
Departures for foreign employment rose to record levels after 2022. The Sri Lanka Bureau of Foreign Employment recorded roughly 300,000 to 315,000 departures a year in 2022, 2023 and 2024, with many going to Gulf states and other destinations. Remittances climbed from about US$3.8 billion in 2022 to roughly US$6 billion in 2023 and higher in 2024, according to Central Bank data.
Official records need careful reading. Foreign employment departures are mostly temporary contracts, so they are not the same as permanent emigration. Departure data from the Department of Immigration and Emigration count crossings, not residence status. Migration approvals and visas issued by destination countries do not provide an exact count of permanent emigrants.
| Migration type | Description | Data source | Limit |
|---|---|---|---|
| Temporary labor migration | Contract work abroad | Bureau of Foreign Employment | Return dates not tracked fully |
| Permanent emigration | Settlement abroad | Destination country data, estimates | Hard to measure |
| Skilled emigration | Doctors, engineers, teachers, IT workers | Professional council data, press | Incomplete |
| Student migration | Study abroad, some stay | Visa data | Mixed |
| Net migration | Arrivals minus departures | Immigration department | Includes tourists and short trips |
Professional departures drew attention. Reports and professional bodies described significant exits among doctors, nurses and other skilled workers, and shortages in some hospital departments. Systematic data on the number who left and the number who will return are limited.
Effects on labor supply depend on who leaves and whether they come back. Remittances support households and the balance of payments, while loss of skilled workers can reduce capacity in health, education and technology.
The Economic Crisis and Household Demographic Decisions
Households responded to the crisis in several ways. Surveys by the World Bank, UNICEF and the World Food Programme documented reduced food consumption, borrowing, selling assets and cutting back on health and education spending. Migration of working age members was one coping strategy.
| Household response | Evidence | Demographic link |
|---|---|---|
| Sending a member abroad | Large rise in departures | Net migration |
| Delaying marriage or births | Plausible, limited direct data | Fertility |
| Reducing health spending | Survey reports | Health outcomes |
| Withdrawing children from school | Reported in some groups | Human capital |
| Seeking informal work | Labor surveys | Employment structure |
Documented effects should be distinguished from plausible behavioral responses. The strongest evidence is for migration and consumption cuts. Evidence on fertility intentions and long run human capital effects is weaker and should be updated as data arrive.
Sri Lanka’s Aging Population and Social Protection
Eighteen percent of residents were 60 or older in 2024, up from 6.6 percent in 1981, and the population aged 65 and above reached 12.6 percent. UNFPA and others have said that about one in four Sri Lankans will be over 60 by 2041. The shrinking relative size of younger cohorts means fewer workers per older person.
Social protection includes public sector pensions, the Employees’ Provident Fund and Employees’ Trust Fund (lump sum, not annuity), elderly allowances and Samurdhi welfare transfers. Many informal workers have no pension. Healthcare is publicly provided, which is a strength, but demand for chronic care is rising and the crisis strained supplies and staffing. Family caregiving is the main source of support, and it weakens when adult children migrate.
| Issue | Condition | Pressure |
|---|---|---|
| Pension coverage | Gaps for informal workers | Old age poverty |
| Healthcare | Free public care, supply shortages | Chronic disease burden |
| Caregiving | Family based | Migration of caregivers |
| Fiscal space | Debt restructuring, tight budgets | Limits expansion |
| Dependency ratio | 49.8 percent | Rising |
The Future of Sri Lanka’s Workforce
Working age (15 to 64) is about two thirds of the population, but cohort entry is slowing and the group will shrink as larger cohorts age. The labor force participation rate is just under half of the working age population, with female participation near 30 percent, far below the male rate. Raising female participation and productivity is a significant lever. Return migration could help if skilled workers come back, while continued departures would reduce domestic supply.
| Workforce factor | Direction | Notes |
|---|---|---|
| Working age population | Stable then declining | Aging |
| Female participation | Low | Barriers in care and jobs |
| Skills | Strong education base | Mismatch, emigration of skilled |
| Productivity | Needs growth | Investment, trade |
| Return migration | Uncertain | Depends on recovery |
Regional and Urban Differences
Western Province is the most populous and urbanized. Gampaha was reported as the most populous district at about 2.43 million in an early census release, and Colombo district showed some of the largest declines in growth. The 2024 census recorded a migrant population, meaning people living outside their district of birth or previous residence, of 3,167,263. Estate sector communities in the central highlands have distinct demographic and economic conditions, and the Northern and Eastern provinces continue to recover from the long civil conflict.
| Area | Feature |
|---|---|
| Western Province | Largest population, Colombo, Gampaha, urban growth |
| Central Province | Estate communities, older tea sector workforce |
| Northern and Eastern provinces | Post conflict recovery, outmigration |
| Southern and Uva | Agriculture, labor migration |
Can Economic Recovery Change Sri Lanka’s Demographic Trajectory?
Recovery may influence migration, employment, household confidence and public service capacity, but it will not reverse aging. Age structure reflects decades of fertility and mortality, so short term recovery cannot restore a young population. Better jobs and wages at home could reduce emigration and raise births slightly, but evidence from other countries suggests that fertility rarely rebounds strongly after reaching low levels.
| Recovery channel | Possible effect | Limit |
|---|---|---|
| Higher wages and jobs | Less emigration | Global wage gaps |
| Stable prices | Confidence in family formation | Slow to change behavior |
| Restored public services | Better health and education | Fiscal constraints |
| Return migration | Skills regained | Depends on opportunity |
Sri Lanka’s Population Outlook Through 2050
United Nations projections from the 2022 revision suggest population growth ending around 2035 and decline after that, with the 60 plus share rising toward a quarter by the early 2040s. National projections prepared by the Department of Census and Statistics use different assumptions, and the 2024 census will lead to revised estimates.
| Scenario | Fertility | Migration | Result |
|---|---|---|---|
| Low | Around 1.7 | High emigration | Earlier decline, faster aging |
| Medium | About 1.9 to 2.0 | Moderate | Peak near mid 2030s, slow decline |
| High | Slight rebound | Low emigration | Later peak |
Uncertainty arises from migration, fertility and mortality, so these scenarios should be updated as new data appear.
Frequently Asked Questions
1. Is Sri Lanka’s population declining? It is still slightly higher than in 2012, with growth of 0.5 percent a year, and recent provisional data show a small decline in one half year because of net emigration.
2. Did the economic crisis cause more Sri Lankans to leave? Departures rose to record levels after 2022, which is consistent with a crisis effect, though pre-existing migration trends and global demand also played roles.
3. How is Sri Lanka’s aging population changing its economy? It reduces labor supply growth and raises healthcare, pension and care demands.
4. Will economic recovery reverse Sri Lanka’s population aging? No. Recovery may affect migration, but age structure changes slowly.
5. What could Sri Lanka’s population look like by 2050? UN projections suggest peak around the mid 2030s followed by decline, with about one in four people aged 60 and above by 2041.
6. What was Sri Lanka’s 2024 census population? 21,781,800.
7. What share is elderly? 18 percent are aged 60 and above, and 12.6 percent are 65 and above.
8. What is the fertility rate? About 1.97 in 2023, below replacement.
9. How many births occurred in 2024? About 228,000.
10. Is foreign employment the same as emigration? No. Most is temporary contract work, while permanent emigration is harder to measure.
Sources and Data Notes
- Department of Census and Statistics Sri Lanka, Census of Population and Housing 2024 final report and press release (October 30, 2025); Estimated Mid-Year Population 2025.
- Registrar General’s Department; Department of Immigration and Emigration; Sri Lanka Bureau of Foreign Employment.
- Central Bank of Sri Lanka; World Bank; IOM; UNFPA Sri Lanka.
- United Nations, World Population Prospects 2022 and 2024.
- Data note: the 2025 half year migration figure is provisional. Verify migration and remittance numbers against the latest releases.