The religious makeup of the United Kingdom has changed more in the last twenty years than in the previous century. Christianity, once the default identity of the overwhelming majority, dropped below 50 percent of the population in England and Wales for the first time in the 2021 Census. At the same time, the share of people reporting no religion has climbed steadily since 2001, while Islam, Hinduism, and Sikhism have grown in both absolute numbers and percentage share.
This article brings together historical census data, the most recent decade of survey evidence, and forward-looking projections to give a full picture of how religious identity in the UK has shifted, where it stands today, and where it is likely headed by the middle of this century.
How Religion Is Measured in the UK
Before looking at the numbers, it helps to understand how this data is collected, since the figures quoted in the press do not all come from the same source.
- The Census in England and Wales asks a voluntary question, “What is your religion?” It has been included since 2001 and is answered by roughly 94 percent of respondents.
- Scotland’s Census asks a similarly worded voluntary question but was conducted a year later than England and Wales, in March 2022 rather than March 2021.
- Northern Ireland’s Census makes the religion question compulsory and asks two separate questions, one on current religion and one on religion of upbringing, with categories broken down into specific Christian denominations.
- The British Social Attitudes survey, run annually since 1983 by the National Centre for Social Research, asks a more neutral question, “Do you regard yourself as belonging to any particular religion?” This tends to produce a higher share of “no religion” responses than the census because it does not prompt people to think about the faith they were raised in.
Because of these differences, this article draws primarily on Census data for headline historical and current figures, and on British Social Attitudes data to fill in the years between censuses.
Past Trends in the UK Population by Religion
Religious identity in England and Wales, home to the large majority of the UK population, has moved in one clear direction since the religion question was introduced. The table below tracks the three census points where full data is available.
Past Trends (England and Wales Census, 2001 to 2021)
| Religion | 2001 Population | 2001 Percent | 2011 Population | 2011 Percent | 2021 Population | 2021 Percent |
|---|---|---|---|---|---|---|
| Christian | 37,300,000 | 71.7% | 33,200,000 | 59.3% | 27,500,000 | 46.2% |
| No religion | 7,700,000 | 14.8% | 14,100,000 | 25.2% | 22,200,000 | 37.2% |
| Muslim | 1,550,000 | 3.0% | 2,710,000 | 4.9% | 3,900,000 | 6.5% |
| Hindu | 560,000 | 1.1% | 818,000 | 1.5% | 1,000,000 | 1.7% |
| Sikh | 340,000 | 0.6% | 420,000 | 0.8% | 520,000 | 0.9% |
| Jewish | 270,000 | 0.5% | 260,000 | 0.5% | 270,000 | 0.5% |
| Buddhist | 150,000 | 0.3% | 250,000 | 0.4% | 270,000 | 0.5% |
| Other religion | 150,000 | 0.3% | 240,000 | 0.4% | 350,000 | 0.6% |
| Not stated | 4,010,000 | 7.7% | 4,030,000 | 7.2% | 3,700,000 | 6.0% |
A few patterns stand out from this table:
- The Christian share fell by 25.5 percentage points across just two decades, a decline of roughly 9.8 million people in relative share terms, even as the overall population grew.
- No religion rose from being a minority position held by 1 in 7 people in 2001 to the second largest single category in 2021, held by more than 1 in 3 people.
- Islam roughly doubled its share of the population between 2001 and 2021, growing faster in percentage terms than any other major group.
- Hinduism and Sikhism grew steadily but at a slower pace than Islam, while Judaism remained almost flat in absolute numbers across the full twenty-year period.
Religion Across the Four Nations of the UK
The UK is not religiously uniform. Scotland, Wales, Northern Ireland, and England each show a distinct pattern, and this matters for understanding both the current snapshot and future projections.
- England recorded 46.3 percent Christian and 36.7 percent no religion in the 2021 Census, broadly in line with the England and Wales average.
- Wales showed a sharper decline in Christian identity than England, falling from 57.6 percent in 2011 to 43.6 percent in 2021, alongside a rise in no religion to 46.5 percent.
- Scotland’s 2022 Census recorded no religion as the largest single category for the first time at 51.1 percent, with Christian identity at 38.8 percent.
- Northern Ireland remains the most religious part of the UK by a wide margin. Christianity accounted for around 79.7 percent of the population in the 2021 Census, made up of 42.3 percent Catholic and roughly 37 percent Protestant and other Christian denominations, with only 17.4 percent reporting no religion.
- London stands out as the most religiously diverse region in England, with over a quarter of residents reporting a religion other than Christianity, compared with under 5 percent in the North East and South West of England.
The Last Ten Years, Year by Year
Because the Census only runs once a decade, annual religious composition is tracked through the British Social Attitudes survey, which uses a different and more neutral question wording. The table below compiles the most recent decade of published data points across census and survey sources, giving a year-by-year view of the underlying trend, even though the exact wording and sample size differ by year.
Last 10 Years Table (Great Britain, Survey and Census Estimates)
| Year | Source | Christian | No Religion | Other Religions |
|---|---|---|---|---|
| 2016 | British Social Attitudes | 41% | 53% | 6% |
| 2018 | British Social Attitudes | 38% | 52% | 9% |
| 2019 | British Social Attitudes | 37% | 53% | 9% |
| 2021 | Census, England and Wales | 46.2% | 37.2% | 10.7% |
| 2022 | Census, Scotland | 38.8% | 51.1% | 3.6% |
| 2022 | Census, Northern Ireland | 79.7% | 17.4% | 1.3% |
| 2023 | British Social Attitudes | 38% | 52% | 8% |
| 2024 | British Social Attitudes | 40% | 49% | 8% |
A note on reading this table: the census figures sit noticeably higher for Christian identity than the survey figures from the same period. This is a known and well-documented gap, and researchers attribute it largely to question wording. The census asks “What is your religion?” directly after a question on ethnicity, which tends to prompt people toward the faith of their upbringing or the school they attended, even if they do not practise or believe. The British Social Attitudes survey instead asks whether someone regards themselves as currently belonging to a religion, which captures active identity rather than background. Both are valid measures, but they answer slightly different questions, and that is why this table presents them side by side rather than blending them into a single number.
Within this decade, a few developments are worth highlighting:
- No religion has been recorded as the position of roughly half of Great Britain’s population in every British Social Attitudes survey since 2009, which means the 2021 census milestone was, in the words of researchers who track this data, old news by the time it made headlines.
- Anglican identification within British Social Attitudes data fell from 17 percent in 2014 to around 11 to 12 percent by 2024, continuing a decline that has been running since the 1980s.
- Among adults aged 18 to 24 in recent British Social Attitudes surveys, as few as 1 percent identify as Church of England, compared with well over a third of those aged 65 and over.
- A widely reported 2024 claim of a “quiet revival” in Christian identity and church attendance, based on YouGov polling for the Bible Society, was formally retracted in March 2026 after fraudulent survey responses were identified. Subsequent analysis by the National Centre for Social Research found no evidence of a genuine revival in either identity or attendance.
Current Snapshot, UK Wide
Combining the most recent census results from all four nations gives the following current picture of the United Kingdom as a whole.
- Christian: 46.5 percent of the population
- No religion: 37.8 percent
- Islam: 6.0 percent
- Hinduism: 1.6 percent
- Sikhism: 0.8 percent
- Buddhism: 0.4 percent
- Judaism: 0.4 percent
- Other religion: 0.6 percent
- Not stated or no response: 5.9 percent
Within these totals, several demographic patterns are important for understanding both the present and the likely future:
- People reporting no religion have a noticeably younger age profile. Only 8.8 percent of this group in England and Wales are aged 65 or over, compared with 18.6 percent of the population as a whole.
- Muslims form the youngest large religious group in the UK, with the highest proportion of children and under 18s of any category.
- Christians now have an average age above 50 in England and Wales for the first time on record, reflecting both an ageing existing membership and low rates of new affiliation among the young.
- Roughly a third of British Muslims live in London, and the West Midlands is home to the largest concentration of British Sikhs at around 32 percent of the national total.
- Hindus have the highest rate of economic activity of any religious group tracked in UK data, and Greater London is home to over half of British Jews.
Why the Numbers Are Changing
A combination of demographic and social factors explains the shift documented above.
- Generational replacement. Each successive birth cohort in Britain has been identified with no religion at a higher rate than the one before it. Among English respondents born in the 1900s, only 16 percent reported no religion, compared with 58 percent among those born in the 1980s.
- Differential fertility. Muslim women in the UK have historically had noticeably higher average fertility than the national average, contributing to faster population growth within that group, independent of migration.
- Migration patterns. The UK has been a leading European destination for migrants from Muslim-majority countries over the past two decades, which has added to natural growth within the Muslim population.
- Weak retention among the non-religious. Survey data shows that people raised without religion rarely adopt one later in life. Among 16 to 34-year-olds raised as non-religious, roughly 94 percent still report no religion as adults, indicating this is a stable identity rather than a temporary phase.
- Declining transmission of Christian identity. Fewer parents who identify loosely as Christian are passing that identity on to their children compared with previous generations, accelerating the generational shift.
Future Projected Population by Religion
Because the UK does not have annual religion census data, projections beyond the current decade rely on demographic modelling rather than direct measurement. The most widely cited projections come from independent researchers and academic modelling using Office for National Statistics population data as an input, since the ONS itself has not published a single official long-range religion forecast. The estimates below should be read as modelled scenarios rather than guaranteed outcomes, since they depend on assumptions about fertility, migration, and the pace at which younger people continue to move away from religious identification.
Future Projected Table (2031, 2041, 2050)
| Religion | 2031 Projected | 2041 Projected | 2050 Projected |
|---|---|---|---|
| Christian | 33% | 36% | 38% |
| No religion | 50% | 47% | 44% |
| Muslim | 7% | 9% | 11% |
| Hindu | 2% | 2% | 2.5% |
| Sikh | 1% | 1% | 1.3% |
| Jewish | 1% | 1% | 0.5% |
| Buddhist | 1% | 1% | 0.7% |
| Other or not stated | 5% | 3% | 1% |
Key points behind these projections:
- Independent demographic modelling that extends the trend from the last three censuses suggests no religion overtook Christianity as the single most common position in the UK around 2024, and that by the 2031 Census, Christian identity could fall to roughly a third of the population while no religion rises to around half.
- Northern Ireland is projected to remain majority Christian throughout this period, even as change accelerates among younger urban residents there.
- Scotland was already majority non-religious as of its 2022 Census and is expected to see nearly all of its local areas reach that same status by the early 2030s, with the Outer Hebrides likely to be the last region to retain a Christian majority.
- Pew Research Center modelling on Muslim population growth in the UK produces a range depending on migration assumptions, from around 9.7 percent under a zero migration scenario to between 16.7 and 17.2 percent under medium and high migration scenarios, with roughly 11 percent commonly cited as a mid-range estimate for 2050.
- England and Wales are projected to remain more of a patchwork than Scotland or Northern Ireland, with cities and diverse urban areas moving further and faster toward secularism and religious plurality than rural areas.
Combined Table, Past, Current, and Future
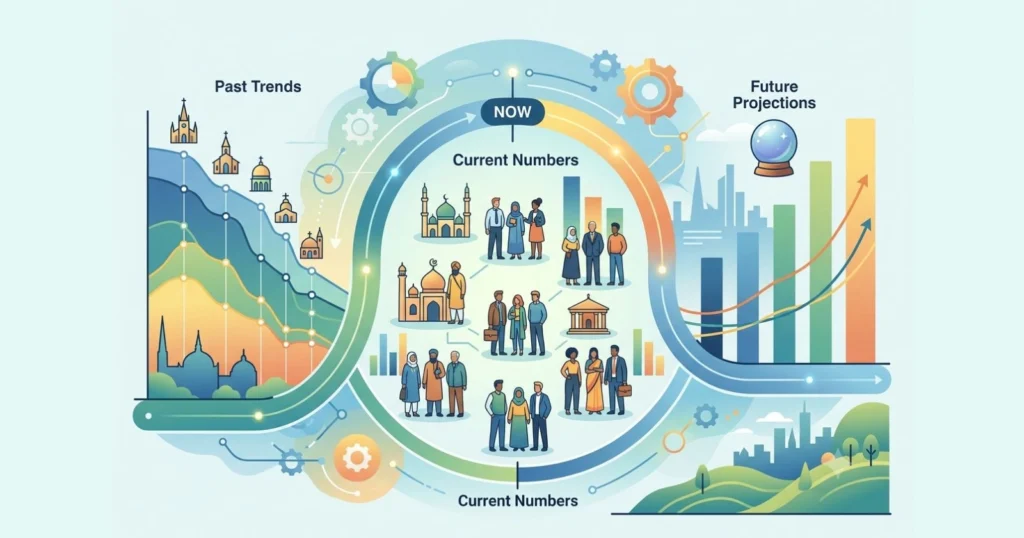
The table showcases historical, current, and projected figures for the United Kingdom side by side, giving a single view of the full arc of change from 2001 through to the middle of this century. Figures from 2001 to 2021 are Census data for England and Wales, adjusted references to Scotland and Northern Ireland are noted in the sections above, and 2031 through 2050 figures are modelled projections rather than official statistics.
Combined Table (2001 to 2050)
| Religion | 2001 | 2011 | 2021 | 2031 Projected | 2041 Projected | 2050 Projected |
|---|---|---|---|---|---|---|
| Christian | 71.7% | 59.3% | 46.2% | 33% | 36% | 38% |
| No religion | 14.8% | 25.2% | 37.2% | 50% | 47% | 44% |
| Muslim | 3.0% | 4.9% | 6.5% | 7% | 9% | 11% |
| Hindu | 1.1% | 1.5% | 1.7% | 2% | 2% | 2.5% |
| Sikh | 0.6% | 0.8% | 0.9% | 1% | 1% | 1.3% |
| Jewish | 0.5% | 0.5% | 0.5% | 1% | 1% | 0.5% |
| Buddhist | 0.3% | 0.4% | 0.5% | 1% | 1% | 0.7% |
| Other or not stated | 8.0% | 7.6% | 6.6% | 5% | 3% | 1% |
Read across any row of this table, and the direction of travel becomes clear. Christian identity has fallen every decade since data collection began and is projected to keep falling, though at a slower rate than the drop seen between 2001 and 2021. No religion shows the mirror image, rising sharply through the last two decades, before the pace of growth is expected to level off somewhat after 2031. Islam shows the most consistent upward trajectory of any religious minority, projected to roughly double again between 2021 and 2050 on top of the doubling that already occurred between 2001 and 2021.
Regional and Demographic Variation to Watch
A national average hides considerable local variation, and this is likely to become more pronounced rather than less over the coming decades.
- Urban centres, particularly London, Birmingham, and Manchester, are projected to retain higher shares of religious minority populations than rural England and Wales.
- Younger cohorts across every nation of the UK are consistently less religious than older ones, meaning the national percentages will continue shifting even without any change in individual behaviour, simply through generational turnover.
- Faith schools, currently accounting for around a third of state schools in England and Wales, sit at the centre of ongoing policy debate given that the share of parents identifying as Christian is now smaller than the share of schools with a Christian designation.
- The Church of England’s own attendance records show average Sunday attendance at roughly a third of 1968 levels and around half of 2002 levels, a decline consistent with the identity data in this article rather than contradicting it.
Conclusion
The story of the UK population by religion over the past two decades is one of consistent, measurable secularisation alongside steady growth among non-Christian faiths, particularly Islam. What was a Christian majority nation as recently as 2011 has become a country where no single category holds a majority, and where “no religion” competes directly with Christianity for the largest share.
Looking ahead, the direction of travel appears well established, even if the exact pace remains uncertain. Generational replacement, differing fertility rates, and continued migration all point toward a UK by 2050 that is more religiously diverse and more secular than it is today, with Christianity likely to remain the largest single identity even as its overall share continues to shrink.
Frequently Asked Questions
What percentage of the UK population is Christian today
Based on the most recent full census data across all four nations, Christianity accounts for approximately 46.5 percent of the UK population, remaining the largest single religious category even though it is no longer a majority.
When did no religion overtake Christianity in the UK?
In the England and Wales Census, Christianity remained the largest category in 2021, though only narrowly ahead of no religion. Independent survey data using different question wording put no religion ahead of Christianity as early as 2009, and demographic modelling projects that no religion will be the largest category in the next full census, expected in 2031.
Which religion is growing fastest in the UK
In percentage point terms, no religion has grown the fastest since 2001. Among religious groups specifically, Islam has shown the fastest sustained percentage growth, roughly doubling its population share between 2001 and 2021.
Is Scotland less religious than England?
Yes. Scotland’s 2022 Census recorded 51.1 percent of the population with no religion, compared with 36.7 percent in England, making Scotland the most secular of the four UK nations by this measure.
Will Christianity remain the largest single religion in the UK
Under most current demographic projections, Christianity is expected to remain the single largest religious category through at least 2050, even though it is projected to keep losing ground as a share of the total population, and no religion is expected to be the largest overall category.