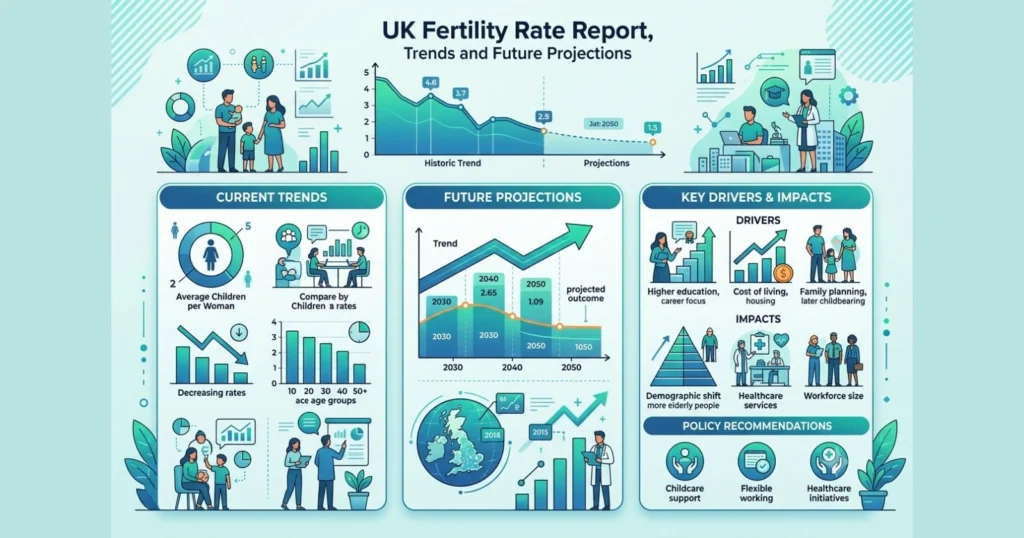
The United Kingdom is in the middle of one of the most significant demographic shifts in its modern history. The total fertility rate (TFR), the average number of children a woman would have across her childbearing years based on the birth patterns of a given year, has fallen to the lowest levels ever recorded. In 2024, the TFR for England and Wales stood at 1.41 children per woman, the third year in a row that the figure has hit a record low. Across the whole of the UK, the rate was 1.40 in 2024, well below the 2.08 children per woman needed for the population to replace itself without migration.
This article walks through the long-term history of UK fertility, the detailed trend of the last ten years, and where the Office for National Statistics (ONS) expects the rate to go through 2049. Four separate data tables are included below, covering the historical past, the last decade, future projections, and a single combined view spanning more than 60 years.
What Is the Total Fertility Rate and Why Does It Matter
The total fertility rate is not simply a count of babies born. It is a standardized measure that estimates how many children a woman would have over her lifetime if she experienced the exact age-specific birth rates recorded in a particular year. This makes it possible to compare fertility across different years and countries, even when the size and age structure of the female population changes.
A TFR of 2.08 is generally treated as the replacement level for a low-mortality country like the UK. At that rate, the population would hold steady in the long run, assuming no net migration. The UK last recorded a TFR at or above that threshold in 1973. Every year since then, the rate has stayed below replacement level, and the gap has widened considerably since 2010.
Fertility rates matter well beyond the birth statistics themselves. They shape future demand for schools, maternity services, housing, and eventually the size of the working-age population that supports pensions and public services. A sustained low fertility rate combined with rising life expectancy tends to produce an aging population structure, which is exactly the pattern now unfolding across the UK.
Historical Past Trends in UK Fertility
UK fertility has moved through several distinct phases since the mid twentieth century.
- The post-war baby boom: Fertility jumped sharply after both world wars, most notably following the Second World War, as delayed births were made up and optimism about the future encouraged larger families.
- The 1960s peak: The TFR climbed to its highest point of the modern era in the mid 1960s, driven by younger marriage ages, a strong economy, and a cultural expectation of larger families.
- The 1970s decline: The introduction of the contraceptive pill, the Abortion Act 1967, and rising numbers of women entering higher education and employment combined to push fertility down sharply through the 1970s. The rate fell below replacement level for the first time in 1973 and has not returned above it since.
- Stabilization in the 1980s and 1990s: After the sharp fall of the 1970s, the TFR leveled out in a narrower band, generally between 1.7 and 1.9, as women continued to have children but increasingly later in life.
- A modest recovery from 2001 to 2012: Fertility rose steadily for over a decade, helped by rising births among women born outside the UK, improved fertility treatment, and a period of relative economic stability before the 2008 financial crisis fully affected household decisions. The TFR peaked at 1.93 in 2012.
- Sustained decline since 2012: Since that 2012 peak, the TFR has fallen almost every single year, accelerating notably from 2020 onward.
Past Fertility Rate Trends
| Year | UK or England and Wales TFR (children per woman) | Notable Context |
|---|---|---|
| 1939 | 1.73 | Pre-war low point, later reversed by the baby boom |
| 1946 | 2.47 | Post Second World War baby boom begins |
| 1964 | 2.93 | The peak of the 1960s baby boom, the highest rate of the modern era |
| 1973 | 2.04 | In the first year, the TFR fell below the replacement level of 2.08 |
| 1977 | 1.69 | Post-boom low point following the introduction of the contraceptive pill |
| 1990 | 1.83 | Stabilization period, rate holding in a narrow band |
| 2001 | 1.63 | The lowest point of that era, before a decade of recovery began |
| 2012 | 1.93 | Most recent peak, before a sustained downward trend set in |
Figures for England and Wales are drawn from the Office for National Statistics birth statistics. Earlier figures are rounded to reflect the lower precision of population estimates before 1981.
The Last Ten Years of UK Fertility Data
The last decade tells a clear and consistent story of decline. Since the 2012 peak of 1.93, the TFR for England and Wales has fallen in nearly every year, with the drop becoming steeper from 2020 onward. Several factors have been cited by demographers and the ONS itself, including rising housing costs, the increasing average age at first birth, greater participation of women in higher education and the workforce, childcare costs, and broader economic uncertainty following the 2008 financial crisis and the coronavirus pandemic.
Some notable points from the last ten years:
- The TFR has fallen every year from 2016 to 2024 without a single annual increase.
- 2020 marked the first time the rate fell to 1.58, a record low at the time, driven partly by the early effects of the coronavirus pandemic on family planning decisions.
- The standardized mean age of mothers has climbed steadily, reaching 31.0 years in 2024, up from around 30.0 a decade earlier.
- Wales has recorded lower fertility than England throughout the decade, with several Welsh local authorities posting the lowest TFRs on record.
- London and the West Midlands were the only two English regions to see a TFR increase in 2024, both coming off a low base.
Last 10 Years Table (England and Wales)
| Year | Total Fertility Rate | Annual Change |
|---|---|---|
| 2015 | 1.82 | Baseline year |
| 2016 | 1.81 | Down 0.01 |
| 2017 | 1.76 | Down 0.05 |
| 2018 | 1.70 | Down 0.06 |
| 2019 | 1.65 | Down 0.05 |
| 2020 | 1.58 | Down 0.07 |
| 2021 | 1.55 | Down 0.03 |
| 2022 | 1.49 | Down 0.06 |
| 2023 | 1.42 | Down 0.07 |
| 2024 | 1.41 | Down 0.01 |
Source: Office for National Statistics, Births in England and Wales annual bulletins, using the most recently refreshed population estimates.
Over this single decade, the TFR fell by 0.41 children per woman, a decline of roughly 23 percent. This is one of the fastest sustained falls in fertility recorded in England and Wales since data collection began in 1938.
Regional and Demographic Patterns Behind the Numbers
The national figures mask meaningful variation across the UK. London has consistently recorded one of the lowest regional TFRs, at 1.35 in 2024, reflecting high housing costs and a younger, more mobile population. The West Midlands has tended to sit at the higher end among English regions, reaching 1.59 in 2024. Wales has recorded some of the lowest local authority rates in the country, with several areas falling below the 1.40 mark.
Age-specific patterns are just as revealing. Fertility among women under 30 has fallen to the lowest level since records began in 1938, while the rate for women aged 40 and over has been comparatively stable and even rose in some recent years before easing slightly. This reflects a broader pattern of delayed childbearing rather than an outright decline in the desire to have children among many women. The average age of a mother at first birth has climbed to around 29 to 30 years, up from roughly 25.5 in 1990.
Completed family size figures add useful context. Women born in 1979, now past the end of their typical childbearing years, had an average completed family size of 1.95 children. Women born in 2008 are projected to have a smaller completed family size of around 1.48 children, and a baby girl born in 2026 is projected to have an average completed family size of just 1.43 by the time she reaches the end of her own childbearing years. This suggests the decline in period fertility is not solely about timing and may reflect genuine reductions in the number of children women ultimately have.
Future Projections for UK Fertility Through 2049
The ONS produces national population projections roughly every two years, and the most recent 2024-based round has set lower fertility assumptions than any previous round. The principal projection assumes the UK TFR will fall further in the short term before edging back up slightly over a 25-year horizon, though it remains well below replacement level throughout.
Key assumptions from the 2024-based projections include the following points.
- The UK TFR is projected to fall to 1.38 children per woman by 2029, the short-term assumption set five years from the 2024 base year.
- In the long term, 25 years from the base year, the principal projection sets the UK TFR at 1.42 children per woman by 2049.
- A low fertility variant projects a long-term TFR of just 1.22 children per woman, while a high fertility variant projects 1.62.
- Every round of national population projections since the mid 2010s has set a lower fertility assumption than the round before it, reflecting the persistence of the downward trend.
- The ONS also models a theoretical replacement fertility variant of 2.075, used purely as a benchmark rather than a realistic forecast.
These projections are not predictions in the strict sense. They are demographic assumptions built from observed trends, expert consultation, and comparison with other low-fertility countries, and they are revised as new data becomes available. Even so, the consistent downward revision across successive projection rounds signals that demographers see little evidence of an imminent rebound.
Future Projected Table (UK, ONS 2024 Based Principal Projection)
| Year | Projected TFR | Projection Basis |
|---|---|---|
| 2025 | 1.39 | Short-term decline continuing from the 2024 base |
| 2029 | 1.38 | Official short-term assumption, five years from the base year |
| 2034 | 1.39 | Gradual stabilization begins |
| 2039 | 1.40 | Midpoint of the long-term recovery path |
| 2044 | 1.41 | Continued gradual increase |
| 2049 | 1.42 | Official long-term assumption, 25 years from the base year |
Source: Office for National Statistics, National population projections, fertility assumptions, 2024 based. Interim years between the official short-term and long-term assumption points are interpolated for illustration.
Combined Table, Past, Current, and Future UK Fertility Rate
The table below brings together historical, current, and projected figures into a single view, illustrating the full arc from the 1960s baby boom to the ONS long-term projection for the middle of the century.
| Year | Total Fertility Rate | Period |
|---|---|---|
| 1964 | 2.93 | Historical, baby boom peak |
| 1977 | 1.69 | Historical, post-boom low |
| 1990 | 1.83 | Historical, stabilization |
| 2001 | 1.63 | Historical, pre-recovery low |
| 2012 | 1.93 | Historically, the most recent peak |
| 2020 | 1.58 | Historical, pandemic-era record low |
| 2024 | 1.41 | Current, latest recorded figure |
| 2029 | 1.38 | Projected, short-term ONS assumption |
| 2039 | 1.40 | Projected, long-term path |
| 2049 | 1.42 | Projected, long-term ONS assumption |
This combined view highlights just how far the UK has traveled from the fertility levels of the 1960s. The current rate of 1.41 is less than half the 1964 peak of 2.93, and even the ONS long-term projection of 1.42 for 2049 would still sit far below the levels recorded throughout most of the twentieth century.
Why the UK Fertility Rate Has Been Falling
Demographers and the ONS point to a combination of overlapping factors rather than any single cause.
- Delayed childbearing. More women are having their first child in their late twenties or early thirties rather than their early twenties, which lowers period fertility even if lifetime family size does not fall by the same margin.
- Cost of housing and childcare. Rising housing costs and the expense of formal childcare are frequently cited by younger adults as reasons for postponing or limiting family size.
- Higher education and workforce participation. Increased participation of women in higher education and full time employment has shifted the typical timeline for starting a family later into adulthood.
- Economic uncertainty. Two major shocks within 15 years, the 2008 financial crisis and the coronavirus pandemic, have both been linked to temporary and, in some cases, lasting effects on fertility decisions.
- Changing social norms. A growing share of women, around one in five in some birth cohorts, are choosing not to have children at all, reflecting broader shifts in family formation and life priorities.
- Global pattern. The UK is not unique. Similar or steeper declines have been recorded across much of Europe, as well as in countries such as South Korea, Japan, and increasingly China, suggesting the drivers extend well beyond UK-specific policy.
What a Sustained Low Fertility Rate Means for the UK
A TFR persistently below replacement level has long-run consequences that extend across the economy and public services.
- Aging population structure. Fewer births relative to the existing population gradually shifts the balance toward older age groups, increasing the ratio of retirees to working-age adults.
- Pressure on pensions and social care. A smaller working-age population base supporting a growing older population raises questions about the long-term sustainability of pay-as-you-go pension systems and social care funding.
- Slower natural population growth. Without continued net migration, the UK population would eventually begin to shrink, since deaths would outnumber births.
- Shifting demand for services. Falling birth numbers reduce demand for maternity services, primary schools, and children’s products over time, while demand rises for elder care, healthcare, and age-related housing.
- Policy responses under discussion. Some experts have pointed to affordable childcare, more flexible parental leave, and housing affordability as areas where policy could support people who want children but feel unable to have them, while stressing that reproductive choice should remain central to any policy response.
Final Thoughts
The UK fertility rate has fallen from a mid 1960s high of nearly 2.93 children per woman to a record low of 1.41 in 2024, a decline that has accelerated notably over the past decade. Official projections suggest the rate will dip slightly further before edging back up to around 1.42 by 2049, but a return to replacement-level fertility is not expected within the current projection horizon.
The trend carries significant implications for the UK’s future population structure, workforce, and public services, and it places the country firmly within a broader global pattern of declining fertility across advanced economies.
Frequently Asked Questions
What is the current UK fertility rate?
The UK total fertility rate was 1.40 children per woman in 2024, while the figure for England and Wales specifically was 1.41. Both represent the lowest levels recorded in recent history.
Is the UK fertility rate below replacement level?
Yes. The replacement level fertility rate for the UK is estimated at 2.08 children per woman. The UK has been below this level continuously since 1973.
When was UK fertility at its highest?
The modern peak came in the mid 1960s, during the post war baby boom, when the total fertility rate reached close to 2.93 children per woman in 1964.
Will the UK fertility rate recover?
Official ONS projections do not anticipate a return to replacement-level fertility. The principal 2024-based projection expects the rate to dip further to 1.38 by 2029 before rising only slightly to 1.42 by 2049, still well below the level needed for the population to replace itself.
Why is the UK fertility rate falling?
Analysts point to a mix of delayed childbearing, high housing and childcare costs, increased education and workforce participation among women, and broader economic uncertainty, alongside changing social attitudes toward family size.
How does the UK compare to other countries?
The UK’s decline mirrors trends across most of Europe. Some countries, including Italy and South Korea, have recorded even lower fertility rates, while the UK’s rate remains close to the average for advanced economies experiencing similar demographic shifts.