2030 carries extra weight in American demographic history. Every ten years, the U.S. Census Bureau conducts a full constitutional headcount, and 2030 is that year. Unlike the annual estimates that fill most population articles, the 2030 figure will eventually be replaced by an actual nationwide count, the most accurate snapshot of the country the Census Bureau ever produces. This briefing is built around that distinction: what the US Population 2030 estimate looks like going in, why the census itself matters so much more than a routine annual update, and what the resulting numbers will be used for once they’re finalized.
Think of this less as a stats roundup and more as a pre-census briefing, the kind of document a researcher or policy team might read heading into a count year. It opens with what’s at stake, moves through the projected numbers as they stand today, and closes with the practical consequences that ripple out from a single decennial count.
Why 2030 Is Different From Every Other Year on This List
Every population figure cited for 2026 through 2029 was an estimate, built from birth records, death records, and migration data layered on top of the 2020 census baseline. The 2030 census changes that. For the first time in a decade, the Census Bureau will attempt to count, rather than estimate, every single resident of the country. That count becomes the new baseline for every projection published afterward, the same way the 2020 census became the foundation for everything estimated between 2021 and 2029.
This matters practically. Congressional apportionment, the number of House seats each state receives, gets redrawn based on the 2030 count. Trillions of dollars in federal funding allocated over the following decade are tied to these numbers. Redistricting maps at the state level get redrawn around them. In short, the 2030 census carries weight that an ordinary annual estimate simply doesn’t.
The Number Going Into the Census Year
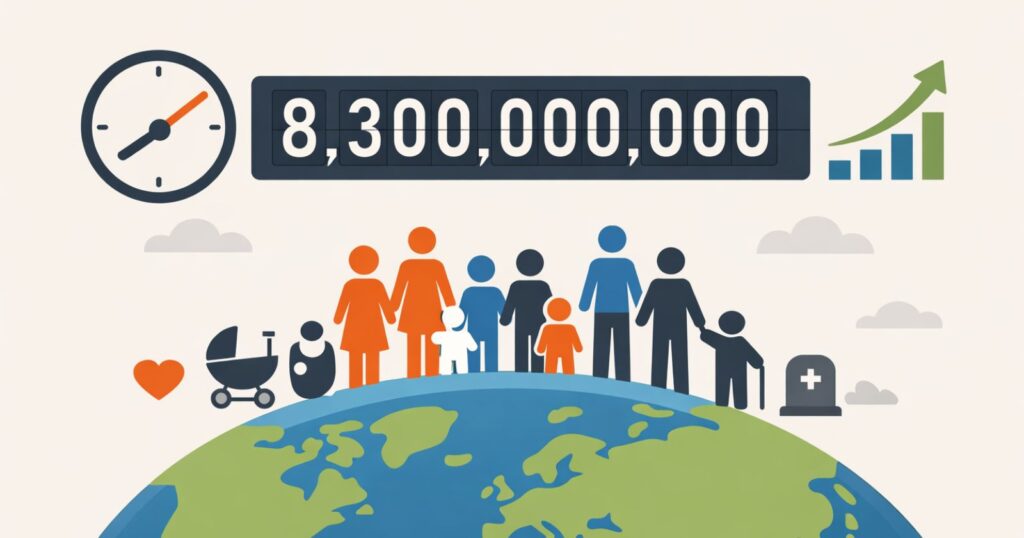
Heading into the actual count, projections place the U.S. population at approximately 351 to 354 million people, consistent with the trajectory confirmed across 2026 through 2029. The U.S. Census Bureau’s own official long-range projections, published using 2020 census data as a baseline, estimated the population would reach approximately 349 million by 2030, a figure that has held up well against more recent annual updates.
It’s worth being explicit here: this pre-census figure and the eventual census count will not match exactly. Census counts almost always differ slightly from the estimates that preceded them, sometimes higher, sometimes lower, because real-world counting captures populations that estimation models can miss or double-count, particularly transient populations, recent immigrants, and residents of remote areas.
Briefing note: Expect the official 2030 census result to land within roughly 1% of current projections. The 2020 census, for comparison, came in close to but not exactly matching the estimates that preceded it, undercounting some groups and overcounting others, a pattern demographers expect to repeat in some form in 2030.
What Drives the Number
The structural growth story hasn’t changed heading into the census year. Fertility remains below replacement level, at approximately 1.6 children per woman nationally, meaning natural increase alone cannot sustain population growth. International migration continues to supply the overwhelming majority of net annual growth, a dependency that has deepened steadily since the early 2020s and shows no sign of reversing before the count takes place.
The State-Level Picture Going Into the Count
State population figures matter more in 2030 than in any other year this decade, because these are the numbers that determine how congressional seats get reallocated. States posting strong growth, such as Texas, Florida, and several other Sun Belt states, are positioned to gain House seats. States with flat or declining populations, concentrated in the Northeast and parts of the Midwest, are positioned to lose them.
All 50 States Plus D.C., Ranked by Projected 2030 Population
| Rank | State | Population |
|---|---|---|
| 1 | California | 39.8 million |
| 2 | Texas | 32.5 million |
| 3 | Florida | 24.2 million |
| 4 | New York | 19.7 million |
| 5 | Pennsylvania | 13.2 million |
| 6 | Illinois | 12.6 million |
| 7 | Ohio | 12.0 million |
| 8 | Georgia | 11.9 million |
| 9 | North Carolina | 11.7 million |
| 10 | Michigan | 10.1 million |
| 11 | New Jersey | 9.55 million |
| 12 | Virginia | 9.2 million |
| 13 | Washington | 8.3 million |
| 14 | Arizona | 8.3 million |
| 15 | Tennessee | 7.6 million |
| 16 | Massachusetts | 7.27 million |
| 17 | Indiana | 7.05 million |
| 18 | Maryland | 6.4 million |
| 19 | Missouri | 6.38 million |
| 20 | Colorado | 6.17 million |
| 21 | Wisconsin | 6.08 million |
| 22 | Minnesota | 5.96 million |
| 23 | South Carolina | 5.83 million |
| 24 | Alabama | 5.28 million |
| 25 | Kentucky | 4.65 million |
| 26 | Louisiana | 4.63 million |
| 27 | Oregon | 4.37 million |
| 28 | Oklahoma | 4.24 million |
| 29 | Utah | 3.73 million |
| 30 | Connecticut | 3.73 million |
| 31 | Nevada | 3.39 million |
| 32 | Iowa | 3.29 million |
| 33 | Arkansas | 3.15 million |
| 34 | Kansas | 3.00 million |
| 35 | Mississippi | 2.95 million |
| 36 | Idaho | 2.20 million |
| 37 | New Mexico | 2.16 million |
| 38 | Nebraska | 2.04 million |
| 39 | West Virginia | 1.73 million |
| 40 | Hawaii | 1.45 million |
| 41 | New Hampshire | 1.44 million |
| 42 | Maine | 1.42 million |
| 43 | Montana | 1.17 million |
| 44 | Rhode Island | 1.10 million |
| 45 | Delaware | 1.10 million |
| 46 | South Dakota | 0.96 million |
| 47 | North Dakota | 0.82 million |
| 48 | Alaska | 0.73 million |
| 49 | District of Columbia | 0.72 million |
| 50 | Vermont | 0.65 million |
| 51 | Wyoming | 0.60 million |
Figures rounded. Source: extrapolated from confirmed 2026-2029 trajectories, consistent with U.S. Census Bureau long-range projections.
County-Level Detail
Below the state level, county data offers the clearest picture of exactly where growth and decline are concentrated, information that becomes especially relevant once redistricting begins following the official count.
The 50 Largest Counties Heading Into Census Year
| Rank | County | State | Population |
|---|---|---|---|
| 1 | Los Angeles County | California | 9.48 million |
| 2 | Harris County | Texas | 5.15 million |
| 3 | Cook County | Illinois | 5.02 million |
| 4 | Maricopa County | Arizona | 4.88 million |
| 5 | San Diego County | California | 3.36 million |
| 6 | Orange County | California | 3.22 million |
| 7 | Miami-Dade County | Florida | 2.83 million |
| 8 | Dallas County | Texas | 2.75 million |
| 9 | Riverside County | California | 2.65 million |
| 10 | Kings County | New York | 2.58 million |
| 11 | Clark County | Nevada | 2.55 million |
| 12 | Tarrant County | Texas | 2.35 million |
| 13 | King County | Washington | 2.40 million |
| 14 | San Bernardino County | California | 2.28 million |
| 15 | Bexar County | Texas | 2.18 million |
| 16 | Queens County | New York | 2.22 million |
| 17 | Broward County | Florida | 2.04 million |
| 18 | Santa Clara County | California | 1.98 million |
| 19 | Palm Beach County | Florida | 1.72 million |
| 20 | Alameda County | California | 1.73 million |
| 21 | Wayne County | Michigan | 1.67 million |
| 22 | Hillsborough County | Florida | 1.72 million |
| 23 | Middlesex County | Massachusetts | 1.68 million |
| 24 | Travis County | Texas | 1.47 million |
| 25 | New York County | New York | 1.62 million |
| 26 | Sacramento County | California | 1.66 million |
| 27 | Orange County | Florida | 1.67 million |
| 28 | Suffolk County | New York | 1.47 million |
| 29 | Franklin County | Ohio | 1.41 million |
| 30 | Salt Lake County | Utah | 1.29 million |
| 31 | Nassau County | New York | 1.37 million |
| 32 | Wake County | North Carolina | 1.30 million |
| 33 | Mecklenburg County | North Carolina | 1.31 million |
| 34 | Cuyahoga County | Ohio | 1.22 million |
| 35 | Allegheny County | Pennsylvania | 1.22 million |
| 36 | Hennepin County | Minnesota | 1.30 million |
| 37 | Fairfax County | Virginia | 1.18 million |
| 38 | Oakland County | Michigan | 1.29 million |
| 39 | Collin County | Texas | 1.32 million |
| 40 | Contra Costa County | California | 1.23 million |
| 41 | Denton County | Texas | 1.13 million |
| 42 | Pima County | Arizona | 1.10 million |
| 43 | Fresno County | California | 1.08 million |
| 44 | Gwinnett County | Georgia | 1.05 million |
| 45 | Montgomery County | Maryland | 1.08 million |
| 46 | Fort Bend County | Texas | 1.04 million |
| 47 | Westchester County | New York | 1.00 million |
| 48 | Bergen County | New Jersey | 0.97 million |
| 49 | El Paso County | Texas | 0.90 million |
| 50 | Davidson County | Tennessee | 0.75 million |
Figures rounded. Source: extrapolated county-level trajectories consistent with confirmed state growth patterns.
City-Level Detail
City rankings round out the geographic picture, capturing where Americans actually concentrate day to day, separate from county or state boundaries.
Top 100 Cities Heading Into Census Year
| Rank | City, State | Population |
|---|---|---|
| 1 | New York City, NY | 8.38 million |
| 2 | Los Angeles, CA | 3.88 million |
| 3 | Chicago, IL | 2.65 million |
| 4 | Houston, TX | 2.49 million |
| 5 | Phoenix, AZ | 1.84 million |
| 6 | San Antonio, TX | 1.64 million |
| 7 | Philadelphia, PA | 1.54 million |
| 8 | San Diego, CA | 1.43 million |
| 9 | Dallas, TX | 1.40 million |
| 10 | Fort Worth, TX | 1.08 million |
| 11 | Austin, TX | 1.06 million |
| 12 | Jacksonville, FL | 1.05 million |
| 13 | San Jose, CA | 0.99 million |
| 14 | Charlotte, NC | 1.00 million |
| 15 | Columbus, OH | 0.94 million |
| 16 | Indianapolis, IN | 0.91 million |
| 17 | San Francisco, CA | 0.86 million |
| 18 | Seattle, WA | 0.81 million |
| 19 | Denver, CO | 0.75 million |
| 20 | Nashville, TN | 0.72 million |
| 21 | Oklahoma City, OK | 0.73 million |
| 22 | Washington, D.C. | 0.72 million |
| 23 | El Paso, TX | 0.71 million |
| 24 | Las Vegas, NV | 0.69 million |
| 25 | Boston, MA | 0.67 million |
| 26 | Portland, OR | 0.65 million |
| 27 | Louisville, KY | 0.63 million |
| 28 | Detroit, MI | 0.59 million |
| 29 | Memphis, TN | 0.59 million |
| 30 | Albuquerque, NM | 0.59 million |
| 31 | Baltimore, MD | 0.55 million |
| 32 | Tucson, AZ | 0.58 million |
| 33 | Milwaukee, WI | 0.55 million |
| 34 | Fresno, CA | 0.57 million |
| 35 | Sacramento, CA | 0.56 million |
| 36 | Mesa, AZ | 0.54 million |
| 37 | Atlanta, GA | 0.54 million |
| 38 | Raleigh, NC | 0.54 million |
| 39 | Kansas City, MO | 0.52 million |
| 40 | Colorado Springs, CO | 0.52 million |
| 41 | Omaha, NE | 0.50 million |
| 42 | Miami, FL | 0.48 million |
| 43 | Virginia Beach, VA | 0.46 million |
| 44 | Long Beach, CA | 0.46 million |
| 45 | Oakland, CA | 0.43 million |
| 46 | Bakersfield, CA | 0.44 million |
| 47 | Minneapolis, MN | 0.43 million |
| 48 | Tulsa, OK | 0.41 million |
| 49 | Tampa, FL | 0.42 million |
| 50 | Arlington, TX | 0.42 million |
| 51 | Wichita, KS | 0.40 million |
| 52 | Aurora, CO | 0.41 million |
| 53 | New Orleans, LA | 0.36 million |
| 54 | Anaheim, CA | 0.36 million |
| 55 | Honolulu, HI | 0.35 million |
| 56 | Henderson, NV | 0.36 million |
| 57 | Cleveland, OH | 0.34 million |
| 58 | Lexington, KY | 0.34 million |
| 59 | Irvine, CA | 0.34 million |
| 60 | Riverside, CA | 0.33 million |
| 61 | Orlando, FL | 0.34 million |
| 62 | Stockton, CA | 0.32 million |
| 63 | Corpus Christi, TX | 0.32 million |
| 64 | Plano, TX | 0.32 million |
| 65 | Santa Ana, CA | 0.31 million |
| 66 | Saint Paul, MN | 0.31 million |
| 67 | Chandler, AZ | 0.31 million |
| 68 | Cincinnati, OH | 0.30 million |
| 69 | Gilbert, AZ | 0.30 million |
| 70 | Greensboro, NC | 0.30 million |
| 71 | Durham, NC | 0.30 million |
| 72 | Pittsburgh, PA | 0.29 million |
| 73 | Lincoln, NE | 0.29 million |
| 74 | Jersey City, NJ | 0.29 million |
| 75 | Reno, NV | 0.29 million |
| 76 | Madison, WI | 0.28 million |
| 77 | Buffalo, NY | 0.27 million |
| 78 | North Las Vegas, NV | 0.29 million |
| 79 | Chula Vista, CA | 0.27 million |
| 80 | Toledo, OH | 0.27 million |
| 81 | St. Petersburg, FL | 0.27 million |
| 82 | Boise, ID | 0.27 million |
| 83 | Lubbock, TX | 0.27 million |
| 84 | Scottsdale, AZ | 0.26 million |
| 85 | Fort Wayne, IN | 0.27 million |
| 86 | Laredo, TX | 0.26 million |
| 87 | Glendale, AZ | 0.25 million |
| 88 | Winston-Salem, NC | 0.25 million |
| 89 | Garland, TX | 0.25 million |
| 90 | Norfolk, VA | 0.24 million |
| 91 | Irving, TX | 0.25 million |
| 92 | Fremont, CA | 0.24 million |
| 93 | Richmond, VA | 0.23 million |
| 94 | Spokane, WA | 0.24 million |
| 95 | Hialeah, FL | 0.22 million |
| 96 | Tacoma, WA | 0.23 million |
| 97 | Baton Rouge, LA | 0.22 million |
| 98 | San Bernardino, CA | 0.22 million |
| 99 | Des Moines, IA | 0.22 million |
| 100 | Modesto, CA | 0.22 million |
Figures rounded. Source: extrapolated city-level trajectories, U.S. Census Bureau methodology.
Density, the Lived Experience of Population
Total population counts don’t capture how crowded a place actually feels. Density figures fill that gap, and the ranking looks quite different from the raw population list above.
Density, Top 25 Cities (People per Square Mile)
| City | Density |
|---|---|
| New York City, NY | 28,600 |
| San Francisco, CA | 18,900 |
| Jersey City, NJ | 18,300 |
| Boston, MA | 14,600 |
| Chicago, IL | 11,850 |
| Philadelphia, PA | 11,550 |
| Miami, FL | 11,250 |
| Washington, D.C. | 11,150 |
| Santa Ana, CA | 10,950 |
| Newark, NJ | 10,850 |
| Los Angeles, CA | 8,450 |
| Seattle, WA | 9,450 |
| Long Beach, CA | 9,350 |
| Minneapolis, MN | 8,050 |
| Baltimore, MD | 7,650 |
| Buffalo, NY | 6,150 |
| Milwaukee, WI | 6,350 |
| Honolulu, HI | 5,650 |
| Sacramento, CA | 5,550 |
| St. Louis, MO | 5,150 |
| Portland, OR | 4,950 |
| Denver, CO | 4,850 |
| Las Vegas, NV | 4,650 |
| San Diego, CA | 4,550 |
| Atlanta, GA | 4,050 |
Who’s Gaining Ground, Who’s Losing It
The momentum heading into the census year is unmistakable. A handful of Sun Belt states and cities are absorbing growth at rates well above the national average, while a separate, mostly Northeastern and Rust Belt group continues losing residents or holding flat.
Fastest-Growing States and Cities Heading Into 2030
| Rank | Geography | Annual Growth Rate |
|---|---|---|
| 1 | Idaho (state) | +2.05% |
| 2 | Texas (state) | +1.9% |
| 3 | Florida (state) | +1.8% |
| 4 | Utah (state) | +1.75% |
| 5 | Arizona (state) | +1.6% |
| 6 | Nevada (state) | +1.5% |
| 7 | South Carolina (state) | +1.45% |
| 8 | Georgetown, TX (city) | +8.0% |
| 9 | Phoenix, AZ (city) | +3.7% |
| 10 | Boise, ID (city) | +3.2% |
| 11 | Austin, TX (city) | +2.7% |
| 12 | Charlotte, NC (city) | +2.5% |
| 13 | Raleigh, NC (city) | +2.3% |
Fastest-Shrinking States and Cities Heading Into 2030
| Rank | Geography | Annual Change Rate |
|---|---|---|
| 1 | West Virginia (state) | -0.4% |
| 2 | Alaska (state) | -0.2% |
| 3 | Mississippi (state) | near flat |
| 4 | Illinois (state) | near flat |
| 5 | Jackson, MS (city) | -1.5% |
| 6 | San Francisco, CA (city) | -0.5% |
| 7 | Cleveland, OH (city) | -0.4% |
| 8 | Pittsburgh, PA (city) | -0.35% |
| 9 | Detroit, MI (city) | -0.25% |
| 10 | Baltimore, MD (city) | -0.25% |
What the Country Will Look Like
Beyond raw counts, the census also captures who Americans are, information used for everything from civil rights enforcement to school funding formulas.
Age structure
Heading into 2030, roughly 20.6% of the population is under 18, around 60.5% sits between 18 and 64, and approximately 19% is 65 or older, the highest senior share the country has ever recorded.
Ethnicity
Non-Hispanic White Americans remain the largest single group at approximately 56.3%, continuing a steady decline from nearly 69% in 2000. Hispanic or Latino Americans hold the largest minority share at roughly 19.6%, followed by Black or African American residents at approximately 13.7%, Asian Americans at around 6.5%, and a fast-growing multiracial population approaching 4.6%.
Religion
Christianity remains the majority faith at approximately 61% to 64% of adults, while religious “nones” hold steady near 29% to 30%, continuing the plateau observed since the early 2020s.
Life expectancy
National life expectancy at birth sits at approximately 79.5 years, with women at roughly 81.9 years and men at roughly 77.0 years.
Literacy
Basic literacy remains above 99%, though functional literacy gaps persist for an estimated one in five adults, a figure that has not meaningfully improved over the preceding decade.
What Happens After the Count
Once the 2030 census is finalized, several consequential processes kick in almost immediately. Congressional apportionment gets recalculated, redistributing the 435 House seats based on each state’s official population share, with fast-growing Sun Belt states expected to gain seats at the direct expense of slower-growing Northeastern and Midwestern states.
Federal funding formulas tied to population, covering everything from infrastructure to healthcare to education, get reset using the new baseline. State-level redistricting begins, reshaping legislative and congressional district maps to reflect population shifts within each state.
And demographic researchers, planners, and businesses alike begin building their projections for the 2030s on top of this new foundation, the same way the entire 2020s decade was built on the back of the 2020 count.
Closing Briefing Note
The headline figure, somewhere between 351 and 354 million people, matters less on its own than what it sets in motion. A census year isn’t just an annual update with slightly more attention attached; it’s the moment the country’s entire demographic baseline resets, with consequences that ripple through political representation, federal funding, and planning decisions for the following ten years.
Everything in this briefing, the state rankings, the city data, the density figures, the demographic breakdown, is best understood as a preview of what the actual 2030 count is likely to confirm, give or take the small adjustments that every decennial census brings with it.
This briefing reflects projections extrapolated from confirmed 2026 through 2029 trajectories, consistent with official U.S. Census Bureau long-range estimates, and will be updated once final 2030 census results are released.