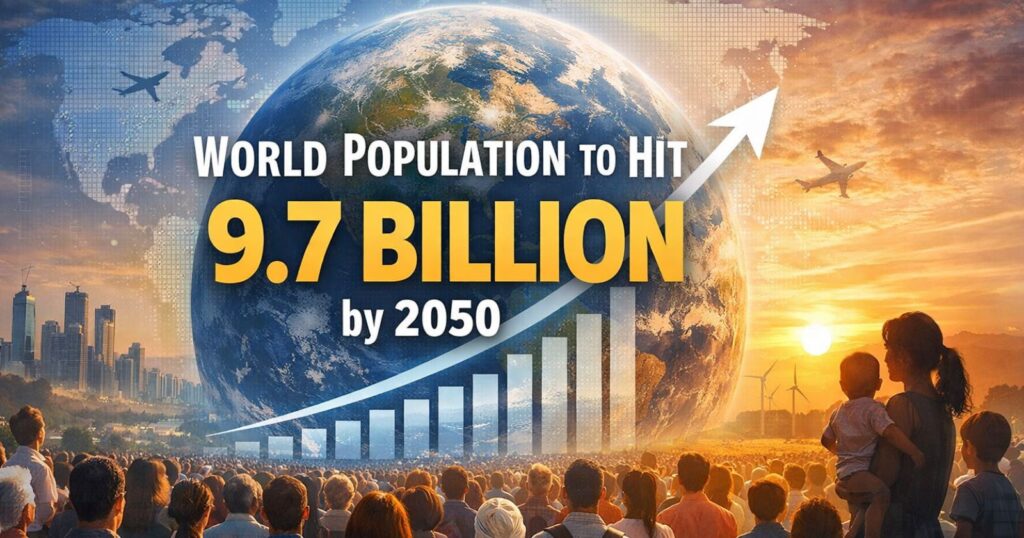
The average resident of the United States emits roughly 14-15 tonnes of carbon dioxide a year. The average resident of Nigeria, a country with one of the fastest-growing populations on Earth, emits under 1 tonne. That gap, more than a factor of fifteen between two countries with very different population growth trajectories, is the clearest evidence that population size and growth are only one input into global emissions, and often not the decisive one.
The Short Answer:
Population matters to climate change, but it does not tell the whole story. The relationship is best understood through a simple multiplicative framework used widely in climate research: total emissions equal population multiplied by GDP per capita, multiplied by energy intensity, multiplied by carbon intensity of that energy. Two of those four factors, income and the carbon intensity of the energy system, have historically driven far larger swings in emissions than population growth alone.
How Population Growth Affects Emissions
The IPCC’s Sixth Assessment Report identifies GDP per capita growth and population growth as the two main drivers that have pushed fossil fuel CO2 emissions upward historically, while improvements in energy intensity (energy used per unit of GDP) and, to a lesser degree, reductions in carbon intensity (emissions per unit of energy) have partially offset that growth. Critically, the IPCC’s own analysis finds that income growth has been the larger of the two upward drivers globally, even though population growth has also contributed meaningfully, particularly in earlier decades.
Population Growth vs Consumption Growth
Because per-capita emissions vary so enormously by country, and even by income group within countries, two additional people born in a high-income, energy-intensive economy will, all else equal, add far more to global emissions over their lifetimes than ten additional people born in a low-income, low-energy-consumption economy. This is why climate researchers generally treat consumption patterns, shaped by income and energy systems, as more decisive for future emissions trajectories than population size on its own.
Which Countries and Regions Have the Highest Emissions
Separating total emissions from per-capita emissions produces very different rankings. China leads the world in total annual CO2 emissions, reflecting both its large population and its heavily industrialized, coal-dependent energy system, while the United States, with a much smaller population, ranks second in total emissions but far higher in per-capita terms.
Gulf states such as Qatar and the United Arab Emirates post some of the highest per-capita emissions in the world, driven by energy-intensive economies and small populations, illustrating how weakly population size predicts per-capita emissions.
| Measure | Leading Countries/Groupings (approx.) | Key Driver |
|---|---|---|
| Total annual CO2 emissions | China, United States, India | Population size combined with energy system and industrial base |
| Per-capita CO2 emissions | Qatar, UAE, other Gulf states, United States, Australia | Energy-intensive economies and consumption patterns |
| Historical cumulative emissions | United States, European Union, United Kingdom | Early industrialization, long historical emitting period |
| Consumption-based emissions | Wealthy, high-import economies (adjusts for traded goods) | Reflects goods consumed, not just produced domestically |
Rankings are illustrative of well-established patterns in emissions data compiled by sources such as the Global Carbon Project and Our World in Data; exact rankings shift year to year with energy mix and economic activity.
Why Income Matters So Much
Higher income drives larger homes, more vehicle ownership and longer average travel distances, higher meat and dairy consumption, and greater overall consumption of goods and services, nearly all of which carry a larger carbon footprint than lower-income lifestyles.
This is a core reason the IPCC and most climate researchers treat rising affluence as one of the two dominant historical drivers of emissions growth, alongside population, with income growth generally exerting the larger effect in aggregate.
Population Growth Is Increasingly Concentrated in Lower-Emitting Regions
This is one of the most important and most frequently overlooked nuances in the population-climate relationship. The United Nations has noted that much of future population growth is concentrated in some of the world’s poorest countries, which also have among the lowest per-capita emissions, while those same countries are often disproportionately exposed to the physical impacts of climate change, including extreme heat, drought, and flooding, despite having contributed the least to the emissions causing it. Sub-Saharan Africa, the fastest-growing major region demographically, has among the lowest regional per-capita emissions in the world.
Can Economic Growth Decouple From Emissions
A growing body of evidence shows at least partial decoupling is possible: several wealthy economies, including much of the European Union and, more recently, the United States, have seen GDP continue to grow while absolute emissions fall, driven by improvements in energy efficiency, growth in renewable energy generation, and structural shifts away from heavy manufacturing toward services.
Whether this decoupling can happen fast enough and broadly enough, including in fast-growing developing economies that are still building out energy infrastructure, remains one of the central open questions in climate policy.
How Population Aging Could Affect Emissions
Aging populations could plausibly reduce emissions somewhat through smaller household sizes offset by more households overall, changing mobility patterns as older populations tend to travel less for work, and a shrinking labor force potentially slowing industrial output growth in some sectors, though the evidence here is considerably less settled than for the population-income-emissions relationship, and some research suggests smaller households can actually increase per-capita energy use due to less shared consumption of heating, appliances, and living space.
Historical Responsibility vs Future Population Growth
Cumulative historical emissions, which matter enormously for how much warming has already occurred, are overwhelmingly attributable to countries that industrialized early, primarily the United States and Western Europe, rather than to the countries where population growth is now concentrated.
This distinction, between historical responsibility for existing warming and future population growth in low-emitting regions, is central to international climate negotiations and to fair characterizations of who is driving climate change.
What Matters Most for Future Climate Outcomes
Most climate scientists and the IPCC’s own assessment point to the trajectory of energy systems, meaning how quickly the world shifts from fossil fuels to low-carbon energy sources, and the trajectory of consumption growth in both wealthy and rapidly developing economies, as more decisive for future climate outcomes than population growth trends, which are already largely locked in for the next few decades due to population momentum from people already alive today.
What the Population Question Gets Right and Wrong
It is correct that a larger global population means more total resource demand and, all else equal, higher total emissions than a smaller population would produce. It is incorrect to treat population growth as the primary driver of climate change or to suggest that slowing population growth in high-fertility, low-emitting regions would meaningfully reduce global emissions, since those regions contribute a small fraction of both current and cumulative historical emissions. The more consequential lever, by a wide margin, is the pace at which high-emitting economies and rapidly industrializing ones alike shift toward low-carbon energy systems.
Key Findings
- The IPCC identifies GDP per capita growth and population growth as the two main historical drivers of fossil fuel CO2 emissions, with income growth generally the larger of the two.
- Average per-capita emissions in the United States (roughly 14-15 tonnes CO2/year) are more than fifteen times higher than in Nigeria (under 1 tonne/year), despite Nigeria’s much faster population growth.
- China leads in total annual emissions; Gulf states such as Qatar and the UAE lead in per-capita emissions, despite small populations, showing population size poorly predicts per-capita emissions.
- Much of future population growth is concentrated in low-emitting countries, particularly across Sub-Saharan Africa, which also face disproportionate exposure to climate impacts.
- Several wealthy economies, including parts of the EU and, more recently, the US, have shown GDP growth alongside falling absolute emissions, demonstrating at least partial decoupling is achievable.
- Historical cumulative emissions are overwhelmingly attributable to early-industrializing countries, primarily the US and Western Europe, distinct from where population growth is concentrated today.
Frequently Asked Questions
1. Does population growth cause climate change?
Population growth is one contributing factor to rising emissions, but the IPCC identifies income growth as generally the larger historical driver, and future population growth is concentrated mostly in low-emitting countries.
2. Which matters more, population or consumption?
Most climate research points to consumption, shaped by income levels and energy systems, as more decisive for emissions than population size, given how enormously per-capita emissions vary across countries at similar population growth rates.
3. Which countries emit the most per person?
Gulf states including Qatar and the United Arab Emirates, along with the United States and Australia, rank among the highest per-capita emitters, driven by energy-intensive economies rather than large populations.
4. Are future population increases concentrated in high-emitting countries?
No. The United Nations notes that most future population growth is concentrated in lower-income countries with comparatively low per-capita emissions, particularly across Sub-Saharan Africa.
5. Can technology offset population growth’s effect on emissions?
Yes, to a significant degree; improvements in energy intensity and the growing deployment of renewable energy have already partially offset the combined effects of population and income growth on emissions in several economies.
6. What is the relationship between population and CO2 emissions?
Total emissions can be understood as population multiplied by GDP per capita, multiplied by energy intensity, multiplied by carbon intensity of the energy system, with income and energy-system factors historically driving larger swings than population alone.
7. Which country has the highest total emissions?
China currently has the highest total annual CO2 emissions, reflecting its large population combined with a heavily industrialized, coal-dependent energy system.
8. Is population control an effective climate policy?
Most climate researchers and the IPCC’s assessment suggest that reducing population growth in the low-emitting regions where it is concentrated would have a limited effect on global emissions compared with reducing emissions from high-income, high-consumption economies and rapidly transitioning energy systems.
9. Who bears the most historical responsibility for climate change?
Early-industrializing countries, primarily the United States and Western Europe, bear the largest share of cumulative historical emissions, distinct from the countries where population growth is concentrated today.
10. Can economic growth continue without increasing emissions?
Evidence from several wealthy economies shows at least partial decoupling of GDP growth from emissions growth is achievable through efficiency gains and renewable energy deployment, though doing so at the pace and scale needed globally remains a major unresolved challenge.
Sources
- Intergovernmental Panel on Climate Change (IPCC), Sixth Assessment Report, Working Group III, Chapter 2 (ipcc.ch)
- United Nations, “As the world’s population hits 8 billion people…” (un.org)
- Global Carbon Project / Our World in Data, CO2 emissions by country data (ourworldindata.org)
- United Nations, World Population Prospects 2024 (population.un.org)