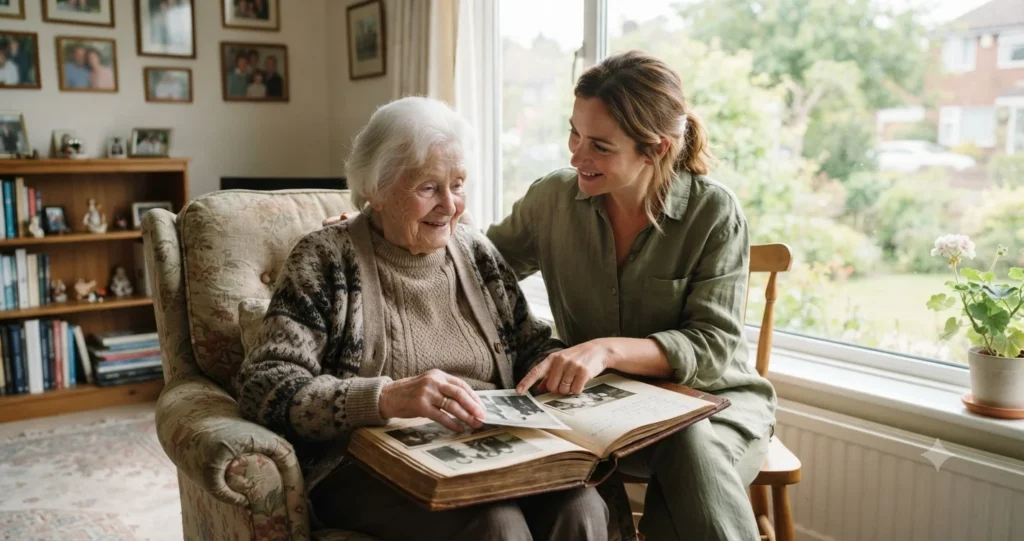
Pew Research Center counted about 23 million members of the Silent Generation in the United States in 2019. Applying seven more years of age-specific death rates puts the surviving total near 13 million in 2026, a drop of roughly 43%. Worldwide, the generation has fallen to an estimated 140 to 150 million people, about 2% of a population of 8.3 billion. Everyone in the cohort is between 81 and 98 years old, an age range in which roughly one in ten people dies each year.
The decline is not a mystery or a crisis. It is the normal life cycle of a birth cohort, driven by a fact demographers have documented for two centuries: mortality risk roughly doubles every eight years of adult age. This article measures how fast the Silent Generation is shrinking, where its survivors are concentrated, how its family and care patterns differ from those of younger groups, and what remains of a generation after most of its members are gone.
Data Snapshot
| Indicator | Figure | Year | Source |
|---|---|---|---|
| Silent Generation birth years (Pew definition) | 1928 to 1945 | n/a | Pew Research Center |
| Age range in 2026 | 81 to 98 | 2026 | Calculated |
| US Silent Generation population | About 23 million | 2019 | Pew Research Center |
| US Silent Generation, rolled forward | About 13 million | 2026 | Editorial estimate |
| Global Silent Generation (approx.) | 140 to 150 million | 2026 | Editorial estimate from UN age data |
| Japanese centenarians | 95,119 | September 2024 | Ministry of Health, Labour and Welfare |
Who Was the Silent Generation?
Pew uses 1928 to 1945 for the Silent Generation, after the “Greatest Generation” (1901 to 1927) and before the baby boomers (1946 to 1964). The cohort was born into the Depression and wartime years, came of age in the 1950s and reached 65 between 1993 and 2010. Boundaries differ by source and country: the British “wartime generation” and the German war-child cohorts do not match the US definition.
The label is cultural. Statistical agencies publish population by single year of age, and a generation is a sum of those years chosen by convention. A person born in 1927 or 1946 has almost the same life history as one born a year later, which is why a count of the “Silent Generation” is always partly a choice.
How Many Members of the Silent Generation Are Still Alive?
The US figure can be rolled forward from Pew’s 2019 count. The cohort’s members were 74 to 91 in 2019. Average annual mortality across those ages is about 7 to 8%, and seven years of that rate leaves roughly 58% alive, which turns 23 million into about 13 million. US births in the cohort window sum to an estimated 45 million, so about three in ten of the original births are still living. The Census Bureau’s single-year age tables for ages 81 to 98 give the exact count and should replace this estimate in any published figure.
| Measure | Silent Generation | Baby Boomers |
|---|---|---|
| US births in cohort window (approx.) | 45 million | 76 million |
| Age in 2026 | 81 to 98 | 62 to 80 |
| US population, 2026 (estimate) | About 13 million | About 65 million |
| Share of US population (approx.) | 4% | 19% |
| Share of world population (approx.) | 2% | 11% |
Counts depend on method. Census counts people enumerated in a given year, while demographic estimates roll forward using births, deaths and migration. At advanced ages, age misreporting and census undercount matter, and national statisticians adjust for both. Global numbers are the least certain, since the UN publishes age groups, not generations.
Why the Silent Generation’s Population Is Declining
The Role of Age-Specific Mortality
Mortality rises steeply with age. US death rates are roughly 1.6% a year for ages 65 to 74, about 4% for 75 to 84 and about 13% for 85 and over (rounded NCHS figures for 2022). Each step of ten years roughly triples the risk. A cohort aged 81 to 98 therefore loses a large fraction every year even in a healthy country.
| Age group | Approximate annual death risk (US, rounded) |
|---|---|
| 65 to 74 | About 1.6% |
| 75 to 84 | About 4% |
| 85 and over | About 13% |
Differences in Life Expectancy
Life expectancy at birth is the wrong measure for survivors. US life expectancy at birth was 78.4 years in 2023, but a person who reaches 85 has on average only 6 to 7 years left, and the figure varies by health and sex. Life expectancy at birth is an average over all ages at death, including infancy. It cannot be used to estimate how long a person already aged 85 will live.
| Age | US life expectancy |
|---|---|
| At birth (2023) | 78.4 years |
| At 65 (2022) | 18.9 years |
| At 85 (approx.) | 6 to 7 years |
Sex Differences in Survival
US life expectancy at birth was 81.1 for women and 75.8 for men in 2023, a gap of 5.3 years. Japan’s gap is about 6 years (87.1 versus 81.1 in 2023). Among very old people the imbalance grows: roughly 88% of Japan’s 95,119 centenarians in September 2024 were women. Men’s higher rates of heart disease, injury and smoking-related disease explain part of the gap, and evidence on the rest is less settled.
Migration and Statistical Coverage
Older cohorts are affected little by migration, though immigrants who arrive later in life can enlarge a national count and return migration can reduce it. Residence definitions also matter, particularly for institutional residents such as those in nursing homes, who are included in most census totals but handled differently in some surveys.
The Historical Population Story of the Silent Generation
The cohort is small in the United States because it was born in lean years. US births fell to roughly 2.3 million in 1933 and rose to about 2.9 million in 1945, compared with a record 4.3 million in 1957. In Europe and the Soviet Union, wartime casualties and collapsed birth rates created gaps in cohort pyramids that are still visible. In Japan, births fell during and immediately after the war and then rose sharply in 1947 to 1949, the start of the boomer period.
National histories differ, so a single global story does not exist. The Silent label describes Western experience most closely, while Asian and African cohorts of the same ages had very different childhoods.
Where Does the Silent Generation Still Have a Significant Population?
| Country | Silent Generation share of population, 2026 (approx.) |
|---|---|
| Japan | 9% |
| Italy | 7% |
| Germany | 7% |
| United States | 4% |
| South Korea | 4% |
| China | 2% |
| India | 1% |
| Nigeria | Under 1% |
Shares are rounded editorial estimates based on UN and national data for ages 81 and over. The cohort is largest where longevity is highest and later fertility lowest. Japan has about 10% of its population aged 80 or older, and its centenarian count has grown from just over 150 in 1963 to 95,119 in 2024.
The Family Structure of the Silent Generation
Widowhood and living alone are common. In the United States, roughly four in ten women aged 75 and over live alone, and the rate is lower for men, according to Census Bureau household tables (rounded). Many are cared for by adult children who are themselves in their fifties and sixties, and roughly 1.2 million Americans live in nursing homes, most of them aged 75 or older. Patterns differ internationally: in much of South and East Asia older adults are more likely to live with adult children, while in Northern Europe most live alone or with a spouse.
The Silent Generation’s Role in an Aging Population
The generation is a small part of a much larger old-age phenomenon. Worldwide, the share of people aged 65 and over is about 10% in 2024 and the UN projects about 16% by 2050, with the 80-and-over group growing about threefold from its early-2020s level of roughly 150 million. Silent Generation members are at the oldest end of that group and account for most of the highest long-term care demand. Aggregate pressure and individual need differ: many people in their eighties live independently, and health varies widely.
What Happens to a Generation as Its Population Declines?
Demographers call the process cohort attrition. A cohort starts at its birth total, adds or loses people through migration, and shrinks through mortality until its last member dies. Three things follow:
- Share of population falls. The Silent Generation’s share of the US population has dropped to about 4%, far below its share in earlier decades.
- Direct memory shrinks. The last US veteran of World War I, Frank Buckles, died in 2011, and the last verified veteran worldwide, Florence Green, died in 2012. Direct memory of World War II is following the same path as Silent Generation members pass 90.
- Legacy persists. Institutions, laws, family records and descendants carry a generation’s effects long after its members are gone.
Demographic disappearance and cultural influence are separate. The cohort will be gone by about 2050, when the youngest members, born in 1945, reach 105, but the legacy of its homes, pensions, savings and political choices will continue.
The Silent Generation Compared With Baby Boomers
Boomers are a far larger cohort (76 million US births against about 45 million) and have lived through a period of longer life. US life expectancy at 65 rose from 13.9 years in 1950 to 17.2 in 1990 and 19.6 in 2019 before dipping to 18.9 in 2022. Silent Generation members, who reached 65 between 1993 and 2010, therefore had remaining life expectancy of roughly 17 to 19 years at that age, while boomers turning 65 now face a similar or slightly higher level.
How Long Will the Silent Generation Remain Part of the Population?
| Year | Cohort age range | What it implies |
|---|---|---|
| 2026 | 81 to 98 | About 13 million in the US; 140 to 150 million worldwide (estimates) |
| 2030 | 85 to 102 | Most survivors in the highest-mortality ages |
| 2035 | 90 to 107 | Cohort reduced to a small fraction of its 2026 size |
| 2045 | 100 to 117 | A very small fraction of today’s total, likely well under a million worldwide |
| 2050 | 105 to 122 | Essentially extinct, apart from a handful of people |
Survival to 105 is rare, and the oldest human age verified is 122. Projections depend on mortality assumptions, and the pace could shift by several years if advanced-age mortality changes.
The Importance of Recording Generational History
Archives and oral histories keep experience after the people are gone. The US Library of Congress started the Veterans History Project in 2000, and the USC Shoah Foundation holds tens of thousands of survivor testimonies. Demographic records, including census returns, birth registers and military files, show who was born, where they lived and when they died. Systematic collection now is the only way to document the cohort’s first-hand experience.
Conclusion
The central number is the 43% fall in the US cohort in just seven years, produced by annual death risks that climb from 4% to 13% across the cohort’s age range. Nothing unusual is driving it. Every birth cohort follows the same curve, and the Silent Generation is simply near the end of it. What outlasts the cohort is documentary: records, testimony and the institutions it built, which will matter more as the last living witnesses to the 1930s and 1940s disappear around 2050.
Key Findings
- The US Silent Generation fell from about 23 million in 2019 to roughly 13 million in 2026, a decline near 43%, according to an editorial roll-forward.
- Death risk is about 13% a year at ages 85 and over, roughly eight times the 65-to-74 rate.
- The cohort is about 2% of the world population but 9% of Japan’s.
- Women outnumber men at the oldest ages: about 88% of Japan’s 95,119 centenarians (2024) were women.
- The cohort is likely to be effectively gone by about 2050, when its youngest members turn 105.
Frequently Asked Questions
1. What years define the Silent Generation?
Pew uses 1928 to 1945. Other sources use 1925 to 1945 or similar ranges.
2. How many Silent Generation members are alive today?
About 13 million in the United States (an editorial roll-forward of Pew’s 2019 count of about 23 million) and roughly 140 to 150 million worldwide. Official single-year age tables give exact national figures.
3. Why is the Silent Generation population shrinking?
Death rates at ages 81 to 98 are high, from about 4% a year in the early eighties to 13% or more over 85, so a cohort loses a large share each year.
4. What is the age of the oldest Silent Generation members?
Those born in 1928 are 98 in 2026, and those born in 1945 are 81.
5. What happens when a generation disappears?
The cohort shrinks through mortality until its last member dies. Cultural and institutional effects continue through descendants, archives and policy.
6. Which generation comes after the Silent Generation?
Baby boomers, born 1946 to 1964. Boundaries overlap in some definitions.
7. How does the Silent Generation compare with Baby Boomers?
It is much smaller: about 45 million US births versus 76 million. In 2026 it is about 4% of the US population against about 19% for boomers.
8. Does life expectancy at birth predict how long Silent Generation members will live?
No. Life expectancy at birth averages deaths at all ages. A person aged 85 has on average 6 to 7 more years, while life expectancy at birth is 78.4 in the United States.
9. Which country has the largest Silent Generation share?
Japan, at about 9% of residents by editorial estimate, followed by Italy and Germany at about 7% each.
10. When will the last Silent Generation member die?
Probably around 2050 or soon after, when the youngest members reach 105. A few exceptional people may live a little longer.
Sources
- Pew Research Center, generation definitions and US generational population analyses. https://www.pewresearch.org
- CDC National Center for Health Statistics, life expectancy and death rates by age. https://www.cdc.gov/nchs/
- US Census Bureau, population estimates by age and household living arrangements. https://www.census.gov
- Ministry of Health, Labour and Welfare, Japan, life tables and centenarian statistics. https://www.mhlw.go.jp
- United Nations Population Division, World Population Prospects 2024.
- Human Mortality Database. https://www.mortality.org
- Social Security Administration, period life tables. https://www.ssa.gov
- Library of Congress, Veterans History Project.
- USC Shoah Foundation. https://sfi.usc.edu