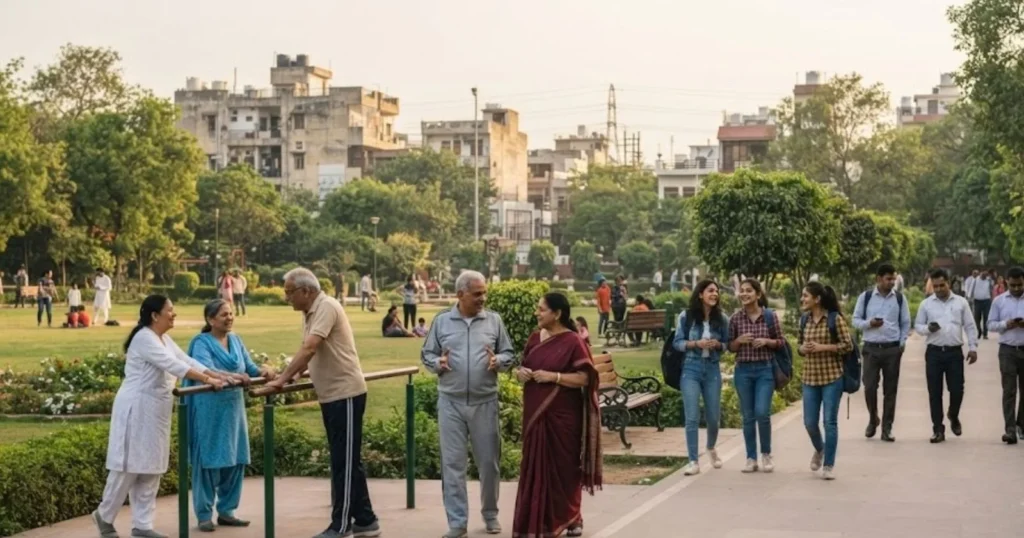
India’s age structure is splitting along a regional line. Kerala has about 15 percent of residents aged 60 and above in the Sample Registration System (SRS) Statistical Report 2023, against a national share of 9.7 percent, while Bihar and Jharkhand have far smaller elderly shares and some of the largest cohorts of children and young adults in the country. In the same report, the total fertility rate was 2.8 in Bihar and 1.5 or below in Kerala, Andhra Pradesh and Tamil Nadu, which explains why the age gap is widening.
The popular description, an aging South and a young North, is a useful shorthand and a misleading map. Punjab, Himachal Pradesh and Delhi have low fertility and aging profiles that resemble the south. Several southern states are migration destinations with young workforces. Both regions need investment, and their immediate priorities differ.
What the Regional Age Divide Looks Like
The comparison uses two explicit groups. The southern five are Andhra Pradesh, Karnataka, Kerala, Tamil Nadu and Telangana. The northern comparison group is Uttar Pradesh, Bihar, Rajasthan and Madhya Pradesh, with other northern states such as Punjab, Haryana, Himachal Pradesh and Delhi noted separately. Reference years are stated.
| Indicator | Southern five | Northern four | Year and source |
|---|---|---|---|
| TFR, selected states | Kerala 1.8, Tamil Nadu 1.8, Karnataka 1.7, Andhra Pradesh 1.7, Telangana 1.8 | Bihar 3.0 (not in group avg), Uttar Pradesh 2.4, Rajasthan 2.0, Madhya Pradesh 2.0 | NFHS-5, 2019 to 21 |
| TFR, SRS | Tamil Nadu 1.3, Kerala 1.5, Andhra Pradesh 1.5 | Bihar 2.8, Uttar Pradesh 2.6, Madhya Pradesh 2.4, Rajasthan 2.3 | SRS 2023 |
| 60 plus share | Kerala about 15% (SRS 2023); Tamil Nadu 13.7%, Andhra Pradesh 12.3% (projected 2021) | Bihar below 8% (projected 2021); others near or below national | SRS 2023; India Ageing Report 2023 |
| Working age trend | Plateau in 2030s to 2040s | Growth into 2040s | Technical Group projections |
The national picture sets the scale: 9.7 percent aged 60 plus in SRS 2023, projected to reach about 15 percent in 2036 and 20.8 percent in 2050 in the India Ageing Report 2023. Within-region variation is large, so state comparisons are better than regional averages. Median age follows the same pattern, with Kerala and Tamil Nadu several years older than Bihar and Uttar Pradesh, though state medians should be taken from the latest census or projection tables.
| State | Aging profile | Notes |
|---|---|---|
| Kerala | Oldest | Low fertility since the 1980s, high survival, Gulf migration |
| Tamil Nadu | Old | Early fertility decline, strong health system |
| Himachal Pradesh | Old | Northern but low fertility |
| Punjab | Old | Northern, out-migration of youth |
| Karnataka, Telangana, Andhra Pradesh | Transitional to old | Large cohorts approaching 60 in the 2030s |
| Madhya Pradesh, Rajasthan | Young to transitional | Fertility near replacement in NFHS-5 |
| Uttar Pradesh | Young | Huge absolute numbers |
| Bihar, Jharkhand | Youngest | Highest fertility, large cohorts |
Why Southern States Are Experiencing Population Aging
Three mechanisms drive southern aging, and they work together.
Fertility decline
Southern fertility fell below replacement earlier than anywhere else. Kerala crossed below 2.1 around the late 1980s and Tamil Nadu in the early 1990s, with Andhra Pradesh and Karnataka following around the turn of the century. Fewer births shrink the youngest cohorts and raise the share of older ones.
Longevity
Child mortality and adult mortality fell sharply. SRS 2023 puts Kerala’s infant mortality rate at 5 per 1,000 live births, the lowest in the country, against 37 in Chhattisgarh, Madhya Pradesh and Uttar Pradesh. Life expectancy in Kerala is the highest among large states.
Age structure inertia
Large cohorts born in the 1960s and 1970s are now in their fifties and sixties. The relative size of older cohorts can rise even when life expectancy does not increase quickly in a particular year, because aging is partly a matter of how many people were born decades ago compared with how many are being born now.
Migration modifies the picture. Kerala’s large Gulf migration removes working age adults and raises the elderly share at home. Tamil Nadu, Karnataka and Telangana attract migrant workers who lower the elderly share of their resident populations.
Why Some Northern States Have Younger Age Structures
Fertility in the Hindi belt remained high for longer. NFHS-3 (2005 to 06) recorded TFRs near 4.0 in Bihar and 3.8 in Uttar Pradesh, against 1.8 to 2.1 in the southern states. Decline has been steady since, with Bihar at 3.0 and Uttar Pradesh at 2.4 in NFHS-5 and at 2.8 and 2.6 in SRS 2023, but the cohorts born in the 1990s and 2000s are very large.
A young age structure is not a guaranteed advantage. It depends on whether the cohort gets education, health care and jobs. Bihar and Uttar Pradesh have large working age growth but lower income per person, thinner industry and low female labor force participation. A young structure also produces demand for schools and maternal health services at a time when budgets are limited.
Northern states are not uniformly young. Punjab, Himachal Pradesh, Delhi and Haryana have fertility near 1.6 to 1.9 and rising elderly shares. West Bengal, in the east, has fertility of 1.6 in NFHS-5 and 1.3 in SRS 2023, as low as Tamil Nadu.
| Cause | Southern effect | Northern effect |
|---|---|---|
| Fertility timing | Early decline, aging sooner | Late decline, momentum |
| Female education | Earlier gains | Later, still catching up |
| Child mortality | Low | Higher, but falling |
| Urbanization | Higher | Lower |
| Cohort size | Smaller recent cohorts | Large recent cohorts |
Different Regional Priorities for Public Services
Healthcare and Long Term Care in Older Regions
Older states need chronic disease management for hypertension, diabetes, heart disease and arthritis, as well as geriatric care, rehabilitation and long term care. The Longitudinal Ageing Study in India Wave 1 found that about three in four older adults had a chronic condition.
Kerala has experimented with community palliative care networks, and Tamil Nadu’s public health system has strong primary care coverage. Pension and social protection also matter: the Indira Gandhi National Old Age Pension has a central contribution of Rs 200 per month for ages 60 to 79 that has not changed since 2012, and several southern states add substantial top ups.
Caregiving is a pressing issue. Adult children migrate for work, households shrink, and women’s unpaid care work is stretched. States with many older adults living alone need home based services and community care.
Education and Employment in Younger Regions
Younger states need schools, teachers, skills training and jobs. Bihar and Uttar Pradesh have large numbers of children and teenagers, and ASER 2023 showed weak foundational skills across many states. Urban infrastructure, including housing, transport and sanitation, must be built ahead of growth in cities and towns. The Economic Survey 2023 to 24 estimated that about 7.85 million non-farm jobs per year are needed nationally until 2030, and a large share of new workers will come from northern and eastern states.
Services Needed Across Both Regions
Some needs are universal: primary healthcare, maternal and reproductive health services, quality schooling, labor market inclusion for women, safe housing and disaster resilience. A south that is aging still has working adults and children who need good schools, and a north that is young still has older residents with chronic illness.
| Service | Older regions | Younger regions | Both |
|---|---|---|---|
| Healthcare | Geriatrics, chronic care | Maternal, child health | Primary care |
| Education | Retraining, school consolidation | Expansion, teachers | Foundational learning |
| Employment | Higher productivity, older workers | Mass job creation | Female participation |
| Social protection | Indexed pensions | Child nutrition, cash support | Insurance |
| Infrastructure | Accessible design | New urban capacity | Transport, water |
Can Interstate Migration Bridge the Regional Divide?
Young workers from the north and east already move to southern and western employment centers. This migration is real, and it brings benefits. Destination states receive labor for construction, manufacturing, hospitality, plantations and domestic work. Origin states receive remittances and relieve pressure on local labor markets.
Migration has limits as a solution to aging. Migrants also age, and fertility is falling in their home states, so the pool of potential young migrants will not grow indefinitely. Migrants need housing, schooling for children and access to health care, which are often tied to home state registration. Integration is easier for some groups than others, and language and social acceptance matter. Origin regions can face labor shortages in specific sectors and an increase in left behind older residents.
| Issue | Destination effect | Origin effect |
|---|---|---|
| Labor supply | Gains workers | Loses workers, gains remittances |
| Housing | Pressure on rental stock | Houses built from remittances |
| Public services | Demand for schools, health | Reduced use, some closures |
| Age structure | Younger workforce | Higher elderly share |
| Social integration | Language, documentation | Family separation |
Census 2011 is the last full source of migration data, and PLFS 2020 to 21 estimated a migration rate near 28.9 percent that is dominated by marriage. Census 2027 will provide updated tables.
The Fiscal and Political Implications of Different Age Structures
Age structure influences spending priorities. Older states face higher health and pension costs and slower growth of the working age tax base. Younger states face education and job creation costs, while their revenue per capita is lower. Fiscal transfers under the Finance Commission formula use income distance, population, area, forest cover, demographic performance and tax effort. The 15th Finance Commission gave population (2011) a 15 percent weight and demographic performance 12.5 percent. The 16th Finance Commission covers 2026 to 2031, and its weights should be checked in the report.
The representation question is separate. Lok Sabha seats among states have been frozen at 1971 census shares. In April 2026, the Constitution (131st Amendment) Bill proposing a larger house of up to 850 seats and delimitation using the latest published census received 298 votes in favor and 230 against, short of the two thirds needed, and related bills were withdrawn. The existing freeze stays until the first census after 2026 is published. Demographic implications and constitutional decisions should be kept distinct, since age structure does not by itself determine what seats or funds a state receives.
| Domain | Demographic input | Decision rule |
|---|---|---|
| Fiscal transfers | Population, demographic performance | Finance Commission formula |
| Lok Sabha seats | Population (frozen at 1971) | Constitution, Articles 81 and 82 |
| Rajya Sabha | Partly population | Fourth Schedule |
| Scheme allocation | Targeting by need | Union and state guidelines |
How Should India Coordinate Regional Demographic Policy?
Coordination should recognize that regional needs differ and that states have more information about local conditions.
State specific planning
Each state needs its own projections and service plans, using district data where possible.
Central support
The Union government can support states with large needs and limited revenue through transfers, centrally sponsored schemes and research.
Portable benefits
Portability of ration cards, health insurance, school records and pensions would help migrants and their families.
Healthcare capacity
Training for geriatric care, nursing and community health work is needed in older states, while maternal and child services remain central in younger states.
Workforce mobility
Skill recognition, rental housing and worker registration reduce frictions.
Human capital investment
Education quality and health in young states yield returns across the country because many of their workers will migrate.
| Policy tool | Aging states | Young states | National role |
|---|---|---|---|
| Health financing | Chronic and long term care | Maternal and child care | PM-JAY coverage, health transfers |
| Pensions | Indexation, coverage | Early savings schemes | Social pension floor |
| Skills | Retraining | Foundational and vocational | Standards, assessment |
| Housing | Age friendly design | Affordable urban housing | Urban programs |
| Data | District projections | District projections | Census, surveys |
How the Regional Age Divide Could Evolve by 2050
Official projections show continued aging in all states, with the south ahead. The India Ageing Report 2023 projects the national 60 plus share at about 20.8 percent in 2050, and state projections to 2036 place Kerala and Tamil Nadu above 20 percent. Northern states will reach those levels later.
| Question | Likely direction | Main uncertainty |
|---|---|---|
| Will the south stay older than the north in 2050? | Yes, by a smaller margin | Pace of northern fertility decline |
| Will northern workforces keep growing? | Into the 2040s, then slowing | Fertility and migration |
| Will the fertility gap close? | Largely by 2040 | Female education, health access |
| Will migration offset southern aging? | Partly | Origin state fertility, wages |
| Will the age gap narrow in absolute terms? | Slowly after 2050 | Convergence |
Scenarios rest on assumptions about fertility, mortality and migration. Census 2027 will replace 2011 baselines, which may change state level projections.
Frequently Asked Questions
1. Why are southern Indian states aging faster?
Earlier fertility decline, high survival and migration of younger adults, combined with large older cohorts.
2. Are northern Indian states guaranteed a demographic dividend?
No. Jobs, skills, health and productivity decide whether large cohorts produce economic gains.
3. Can migration offset population aging?
It changes workforce composition but cannot remove aging, and it has social and capacity limits.
4. What services do aging states need most?
Chronic disease care, geriatric and long term care, indexed pensions and accessible infrastructure.
5. Will the regional age divide widen by 2050?
It may narrow slowly as northern fertility falls, but the south is likely to remain older.
6. Which state has the highest elderly share?
Kerala, at about 15 percent in SRS 2023.
7. Is every northern state young?
No. Punjab, Himachal Pradesh, Delhi and Haryana have low fertility and older profiles.
8. Is every southern state aging at the same pace?
No. Kerala and Tamil Nadu lead, while Karnataka and Telangana are transitional.
9. Does aging mean economic decline?
No. It raises fiscal and care needs, but productivity and participation can offset smaller cohorts.
10. What data are best for comparing regions?
Census, SRS, NFHS, PLFS, the India Ageing Report and official projections with consistent years.
Sources and Data Notes
- SRS Statistical Reports 2023 and 2024; NFHS-3 and NFHS-5; Census of India 2011.
- UNFPA India and IIPS, India Ageing Report 2023; Longitudinal Ageing Study in India Wave 1.
- Finance Commission of India reports; Ministry of Finance, Economic Survey 2023 to 24.
- Lok Sabha records on the Constitution (131st Amendment) Bill 2026.
- Data note: comparisons mix survey and projection years. Verify against current releases.