
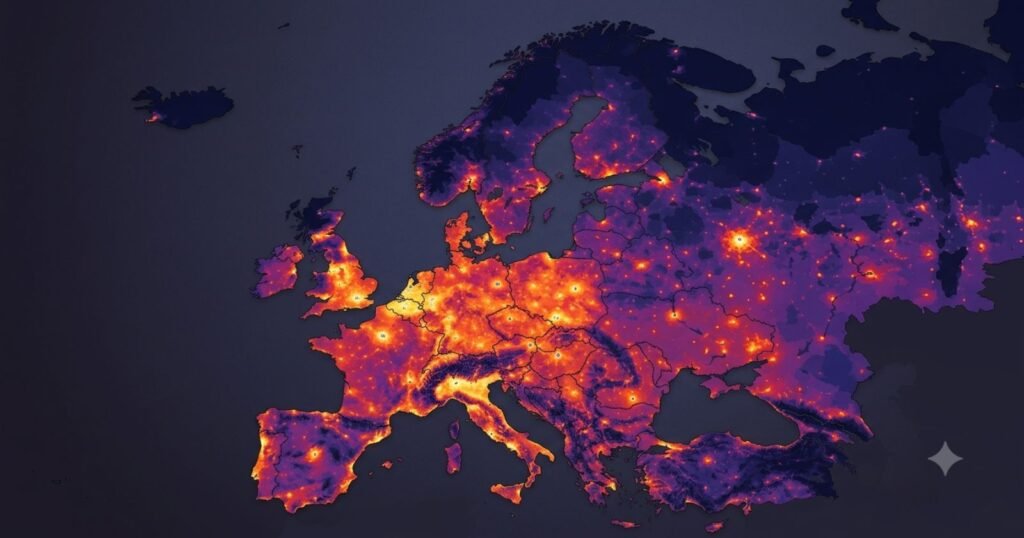
Monaco packs 25,562 people into every square kilometer of its territory. Iceland has just 4. Between those two extremes sits the entire story of European population density, a story that has almost nothing to do with which country has the most people and almost everything to do with geography, industrial history, and where jobs concentrated over the last two centuries.
Europe’s overall average density, 34 people per square kilometer, is close to meaningless on its own, since it blends places as different as the Netherlands, at 547 people per square kilometer, and Norway, at 15.
What Population Density Actually Measures
Population density is calculated as population divided by land area, expressed as people per square kilometer. It is a national average, and national averages hide enormous internal variation. A country can have a modest national density figure while still containing some of the most crowded urban areas on the continent, simply because its rural interior is nearly empty.
Land area, not total area including inland water, is the standard denominator used across the datasets in this article, since including large lakes or coastal waters would understate true density in countries with significant water surface.
Europe’s Most Densely Populated Countries
| Rank | Country | Density (people/km2) | Population 2026 | Land Area (km2) |
|---|---|---|---|---|
| 1 | Monaco | 25,562 | 38,087 | 1 |
| 2 | Gibraltar | 4,087 | 40,867 | 10 |
| 3 | Malta | 1,716 | 549,011 | 320 |
| 4 | Holy See | 1,265 | 506 | 0.44 |
| 5 | Netherlands | 547 | 18,448,775 | 33,720 |
| 6 | San Marino | 560 | 33,605 | 60 |
| 7 | Belgium | 389 | 11,774,642 | 30,280 |
| 8 | United Kingdom | 289 | 69,931,528 | 241,930 |
| 9 | Germany | 240 | 83,644,258 | 348,560 |
| 10 | Switzerland | 228 | 9,007,798 | 39,516 |
Source: UN World Population Prospects 2024 Revision.
Europe’s Least Densely Populated Countries
| Rank | Country | Density (people/km2) | Population 2026 | Land Area (km2) |
|---|---|---|---|---|
| 1 | Iceland | 4 | 402,329 | 100,250 |
| 2 | Norway | 15 | 5,652,989 | 365,268 |
| 3 | Russia | 9 | 143,394,458 | 16,376,870 |
| 4 | Finland | 18 | 5,621,739 | 303,890 |
| 5 | Sweden | 26 | 10,701,047 | 410,340 |
| 6 | Estonia | 31 | 1,331,062 | 42,390 |
| 7 | Latvia | 30 | 1,835,935 | 62,200 |
| 8 | Belarus | 44 | 8,937,018 | 202,910 |
| 9 | Lithuania | 45 | 2,797,338 | 62,674 |
| 10 | Montenegro | 47 | 626,233 | 13,450 |
Source: UN World Population Prospects 2024 Revision.
Russia’s ranking here is a useful correction to the population-by-country ranking, where it appears first by total population, since by density it is actually one of the emptiest countries in Europe, only narrowly denser than Iceland once its vast land area is accounted for.
Why Are Some Parts of Europe So Dense
Several forces built the density map, layered on top of each other over centuries rather than any single cause. Industrialization concentrated population near coalfields, ports, and manufacturing centers in the 18th and 19th centuries, which is why Belgium, the Netherlands, and parts of Germany and the UK remain among the densest parts of the continent today even though their heavy industry has since declined or shifted elsewhere.
Rivers and ports have shaped settlement for far longer than industrialization, since the Rhine, Thames, Seine, and Po valleys offered trade access and agricultural productivity that supported dense populations for centuries before factories existed.
Agricultural productivity itself matters independently, the flat, fertile plains of the Netherlands and Flanders could support far more people per hectare historically than the mountainous terrain of Norway or the Scottish Highlands ever could. Modern employment concentration reinforces all of the above, since jobs in finance, technology, and government cluster in and around the same historic urban centers that industrialization and trade built up generations ago.
Europe’s Major Population Corridors
Density is not evenly distributed even within the densest countries, it clusters into identifiable corridors.
- The Northwestern European urban belt, running roughly from London and the English Midlands through the Netherlands, Belgium, and into the Ruhr region of western Germany, is the single most continuously urbanized stretch of territory in Europe, sometimes referred to informally as the Blue Banana for the shape it traces on a map
- Major river valleys, particularly the Rhine corridor through Germany, France, and the Netherlands, and the Po Valley in northern Italy, concentrate population far above their surrounding regional averages
- Mediterranean coastal zones, especially in Spain, southern France, and Italy, combine dense year-round populations with additional seasonal tourism pressure that can multiply local density many times over during peak months
- Central European metropolitan areas, anchored by cities like Warsaw, Prague, and Vienna, form denser islands within otherwise moderately populated national territories
Urban Europe Versus Rural Europe
| Measure | Urban Europe | Rural Europe |
|---|---|---|
| Share of population, 2026 | 76.2% | 23.8% |
| General economic activity | Concentrated, services and finance dominant | More agriculture and resource dependent |
| Age structure | Generally younger, working-age skewed | Generally older, higher median age |
| Migration pattern | Net inward, both domestic and international | Frequently net outward, especially of younger residents |
| Infrastructure investment | Higher per capita historically | Often lagging, longer service distances |
Europe crossed the 76 percent urban threshold in 2026, up from just 54.6 percent in 1955. That shift did not happen evenly, Belgium is effectively 99 percent urban today, while the Faroe Islands remain only 40 percent urban and Liechtenstein just 15 percent, despite both being wealthy, developed territories, a reminder that urbanization percentage reflects settlement pattern and land use classification as much as it reflects development level.
Density Within Countries, Beyond the National Average
National density figures flatten enormous internal variation. France’s national density sits at 122 people per square kilometer, but Paris and its surrounding region hold over a fifth of the entire national population on a small fraction of French territory, while large stretches of rural central France sit far below the national average.
The same pattern holds in Spain, where Madrid and the Mediterranean coastal strip carry population densities many multiples of the near-empty interior region sometimes called the Spanish “empty quarter,” and in Sweden, where the vast majority of the population lives in the southern third of the country despite Sweden’s low national average of just 26 people per square kilometer.
How European Population Density Has Changed
| Period | Europe’s Approx Density (people/km2) | Context |
|---|---|---|
| 1900 | roughly 18 to 20 | Pre-industrial peak populations in much of rural Europe, minimal urbanization outside major capitals |
| 1950 | roughly 26 | Postwar reconstruction beginning, urbanization accelerating |
| 2000 | 33 | Urban share crossed 70%, density growth slowing as population growth itself slowed |
| 2026 | 34 | Density essentially flat for two decades as population growth stalls even as urban share keeps climbing |
Note, historical density figures before 2000 are approximate reconstructions based on Europe’s total population at each benchmark year, using Worldometer’s UN-sourced historical population series, divided by the continent’s stable land area of approximately 22.1 million square kilometers.
The most striking pattern in this table is that Europe’s overall density has barely moved since 2000, even as the urban population share climbed several more points, which means the density increase that used to accompany population growth has essentially stopped, and any further urbanization from here comes mainly from rural depopulation into existing cities rather than from population growth spilling into new areas.
Europe’s Population Density in 2030 and 2050
Given the continent-wide population is projected to fall from 743.5 million in 2026 to 703.0 million by 2050, overall density is projected to decline slightly over the same period, to roughly 32 people per square kilometer, even as urban density in specific corridors likely continues rising as rural depopulation concentrates a shrinking population into a smaller urban footprint.
Shrinking Regions Versus Crowded Regions, Existing at the Same Time
Europe can post a national population decline while its capital city keeps growing, and that is not a contradiction, it is currently the norm across much of the continent. Poland’s total population is shrinking by roughly 0.78 percent a year, but Warsaw’s metropolitan population has continued rising, pulled in by domestic rural-to-urban migration even as the national total falls through emigration and low fertility.
The same dynamic plays out in Portugal, Greece, and much of the Balkans, national decline sitting alongside continued urban concentration, which means rural depopulation is often running considerably faster than the national density figures alone suggest.
Population Density and Infrastructure
- Housing, high-density areas face persistent supply constraints and affordability pressure, particularly in corridor cities like London, Amsterdam, and Paris
- Transportation, dense regions support extensive public transit networks that would be uneconomical in low-density Nordic or Baltic territory
- Schools, rural depopulation is already forcing school consolidations across low-density regions of Portugal, Bulgaria, and the Baltic states
- Healthcare, low-density countries such as Norway and Finland maintain some of the longest average distances to hospital care in Europe despite high overall wealth
- Utilities, extending water, power, and broadband to sparsely populated areas costs far more per household than in dense urban corridors, a persistent policy challenge in Nordic and Baltic infrastructure planning
- Land use, dense corridor countries like the Netherlands and Belgium face the most acute competition between housing, agriculture, and industrial land use of anywhere in Europe
Density, Environment, and Sustainability
Higher density is not automatically worse for sustainability, and in several respects the opposite holds. Dense urban populations generally produce lower per capita transport emissions than dispersed rural populations, since shorter average trip distances and viable public transit reduce car dependency.
Agricultural land pressure, however, runs in the other direction in very dense small states, the Netherlands and Belgium both face significant tension between high-density urban expansion and preserving agricultural land, a pressure largely absent in low-density Nordic countries.
Green space access per capita tends to be lowest in the densest corridor cities, prompting policy responses ranging from strict urban growth boundaries to mandated green space minimums in cities including Amsterdam and Vienna.
Europe in Ten Density Facts
- Europe’s overall density is 34 people per square kilometer, unchanged in real terms for roughly two decades
- Monaco is the densest sovereign state on Earth at 25,562 people per square kilometer
- Iceland is Europe’s least dense country at just 4 people per square kilometer
- The Netherlands is the densest large country in Europe at 547 people per square kilometer
- Russia, the most populous country in Europe, ranks near the bottom for density at just 9 people per square kilometer
- 76.2 percent of Europeans now live in urban areas, up from 54.6 percent in 1955
- Belgium is effectively 99 percent urban, the highest urbanization rate of any sizable European country
- The Northwestern European urban corridor from London through the Netherlands and Belgium to the Ruhr is the most continuously urbanized stretch of territory on the continent
- National density figures can understate true crowding by several multiples in capital regions like Paris and Madrid
- Overall density is projected to fall slightly to roughly 32 people per square kilometer by 2050 as total population declines even as urban share keeps rising
Frequently Asked Questions
What is the population density of Europe?
Europe’s overall population density is 34 people per square kilometer in 2026, based on a total population of 743.5 million across roughly 22.1 million square kilometers of land area.
Which European country has the highest population density?
Monaco, at 25,562 people per square kilometer, has by far the highest density of any European territory. Among larger countries, the Netherlands leads at 547 people per square kilometer.
Which European country has the lowest population density?
Iceland, at 4 people per square kilometer, has the lowest density in Europe, followed closely by Russia at 9 despite Russia’s massive total population.
Why is Russia’s population density so low if it has the most people in Europe?
Because Russia’s land area is enormous, over 16.3 million square kilometers, far larger than its population can meaningfully fill outside a handful of major cities and the western third of the country.
Is Europe’s population density increasing or decreasing?
It has been roughly flat since 2000, and is projected to decline slightly toward 32 people per square kilometer by 2050 as the continent’s total population falls even while urban areas keep growing.
Sources
- United Nations, Department of Economic and Social Affairs, Population Division.
- World Population Prospects 2024 Revision, medium-fertility variant.





