
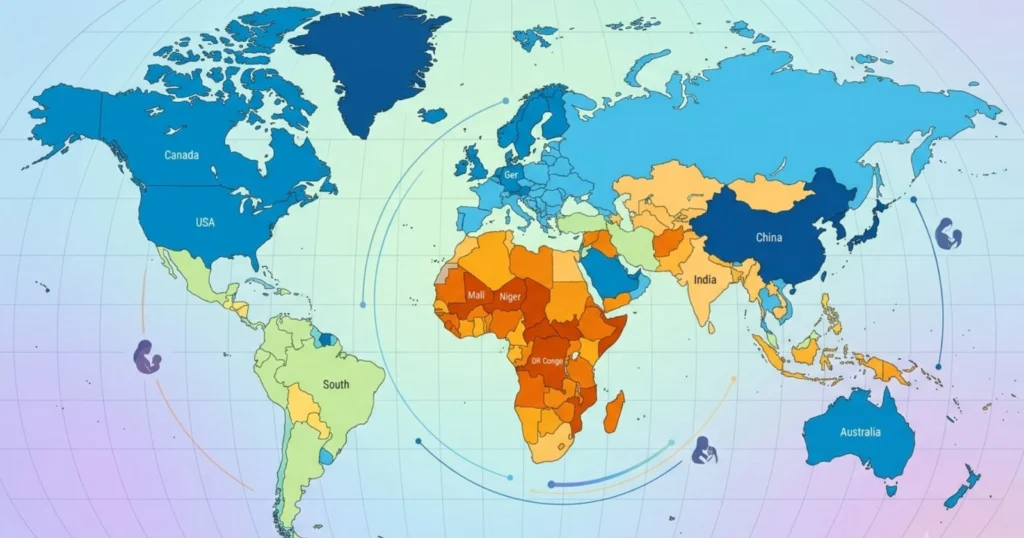
The total fertility rate, or TFR, is one of the most closely watched numbers in global demography. It measures the average number of children a woman would have over her lifetime if current age-specific birth rates held steady. In 2026, the world stands at a demographic turning point.
The global average has fallen from roughly five children per woman in the 1950s to close to two today, and the United Nations now expects the planet to cross below the replacement threshold of 2.1 within the next two decades. This article walks through where fertility has been, where it stands right now, and where it is headed for every major region and country, using data compiled from the United Nations World Population Prospects (2024 Revision), the World Bank, and the Population Reference Bureau.
What the Total Fertility Rate Actually Measures
The total fertility rate is not a headcount of births in a single year. It is a synthetic measure that adds up the age-specific birth rates for women aged 15 to 49 in a given year and treats that as if it represented one woman’s entire reproductive lifetime. A country with a TFR of 6.0 does not mean that six children were born to a single woman, but that if the current age-by-age birth pattern remained unchanged, the average woman would end up having six children by the end of her childbearing years.
A few reference points help make sense of the numbers used throughout this article:
- Replacement level fertility is generally set at 2.1 births per woman in countries with low child mortality, and can run as high as 3.5 in places where child mortality remains elevated.
- A TFR above 5.0 is considered very high and is now mostly confined to a handful of countries in Sub-Saharan Africa.
- A TFR below 1.5 is considered ultra-low and is associated with rapid population aging, most visible today in East Asia and parts of Southern and Eastern Europe.
- More than half of the world’s countries and territories now sit below the replacement threshold of 2.1.
Historical Fertility Trends, 1950 to 2020
Global fertility has undergone one of the fastest and most widespread transformations in human demographic history. In the early 1950s, the average woman worldwide had close to five children. That number held roughly steady through the 1960s, buoyed by high fertility across nearly every developing region and the post-war baby boom in North America and parts of Europe. The real decline began in the 1970s and accelerated through the following decades as contraception access expanded, child mortality fell, women’s education and labor force participation rose, and urbanization reshaped family size preferences across Asia and Latin America.
The table below tracks the trajectory of the world average alongside a representative group of the most populous and most demographically distinct countries, decade by decade, from 1950 through 2020. Figures are rounded to two decimal places and reflect UN World Population Prospects estimates.
Past Fertility Trends by Decade, 1950 to 2020
| Country / Region | 1950-1955 | 1970-1975 | 1990 | 2000 | 2010 | 2020 |
|---|---|---|---|---|---|---|
| World | 5.00 | 4.50 | 3.30 | 2.70 | 2.50 | 2.30 |
| Niger | 7.50 | 7.60 | 7.40 | 7.20 | 7.10 | 6.60 |
| Nigeria | 6.90 | 6.90 | 6.40 | 6.00 | 5.70 | 5.10 |
| DR Congo | 6.00 | 6.30 | 6.70 | 6.80 | 6.40 | 6.10 |
| Ethiopia | 7.20 | 6.90 | 7.00 | 6.10 | 4.80 | 4.10 |
| India | 5.90 | 5.40 | 3.80 | 3.30 | 2.60 | 2.10 |
| Pakistan | 6.60 | 6.60 | 6.00 | 5.00 | 3.90 | 3.60 |
| Bangladesh | 6.40 | 6.30 | 4.30 | 3.10 | 2.40 | 2.00 |
| Indonesia | 5.50 | 5.20 | 3.10 | 2.50 | 2.40 | 2.20 |
| China | 6.10 | 4.90 | 2.30 | 1.60 | 1.60 | 1.20 |
| Japan | 3.00 | 2.10 | 1.50 | 1.40 | 1.40 | 1.30 |
| South Korea | 5.10 | 4.30 | 1.60 | 1.50 | 1.20 | 0.80 |
| United States | 3.30 | 2.20 | 2.10 | 2.00 | 1.90 | 1.60 |
| Brazil | 6.10 | 4.70 | 2.80 | 2.30 | 1.80 | 1.70 |
| Mexico | 6.80 | 6.60 | 3.40 | 2.60 | 2.30 | 1.90 |
| Russia | 2.90 | 2.00 | 1.90 | 1.20 | 1.60 | 1.50 |
| Germany | 2.10 | 1.60 | 1.40 | 1.40 | 1.40 | 1.50 |
| United Kingdom | 2.20 | 2.00 | 1.80 | 1.70 | 1.90 | 1.60 |
| France | 2.90 | 2.30 | 1.80 | 1.90 | 2.00 | 1.80 |
| Italy | 2.40 | 2.30 | 1.30 | 1.30 | 1.40 | 1.30 |
| Spain | 2.50 | 2.90 | 1.40 | 1.20 | 1.40 | 1.20 |
Rounded figures based on UN World Population Prospects 2024 Revision, medium variant historical estimates.
Two patterns stand out. First, East Asia moved through the fertility transition faster than anywhere else in recorded history, with South Korea dropping from over five children per woman in 1950 to under one within a single lifetime. Second, Sub-Saharan Africa is still in the middle of its transition, with countries such as Niger and DR Congo holding fertility above six as recently as 2020, even as neighboring Ethiopia demonstrates that steep declines are achievable within a generation once access to family planning and education expands.
Current Global Fertility Landscape
As of the most recent United Nations estimates, the global total fertility rate sits at approximately 2.2 to 2.25 births per woman, roughly one full child fewer than the average of 3.3 recorded in 1990. This is a striking shift within a single generation, and it has been driven almost entirely by declines in the developing world, since fertility in wealthier nations was already low by the early 1990s.
Fertility today divides the world into three broad tiers:
- High fertility countries, mostly concentrated in Middle and Western Africa, where women still average four to six children. Chad, Somalia, the Democratic Republic of the Congo, the Central African Republic, and Niger anchor this group, each with above 5.7 births per woman.
- Moderate fertility countries clustered around or just above replacement level, including much of South Asia, Southeast Asia, the Middle East, and parts of Central Asia and Oceania.
- Low and ultra-low fertility countries, concentrated in East Asia, Southern and Eastern Europe, and parts of the Caribbean, where rates fall well below the 2.1 replacement threshold. South Korea, Hong Kong, Macau, Taiwan, and Puerto Rico all have one birth per woman.
Regional Averages in 2024
| Region | Total Fertility Rate |
|---|---|
| Sub-Saharan Africa | 4.20 |
| Middle East and North Africa | 2.90 |
| Central Asia | 3.10 |
| South Asia | 2.00 |
| Southeast Asia | 1.90 |
| Latin America and the Caribbean | 1.80 |
| Oceania | 2.10 |
| Northern America | 1.60 |
| Europe | 1.40 |
| East Asia | 1.00 |
Regional averages rounded from UN World Population Prospects and World Bank development group data.
Income level correlates closely with fertility. Low-income countries average around 4.4 to 4.6 births per woman, while high-income countries average roughly 1.4 to 1.5. The gap between the least developed countries, at close to 3.8, and more developed regions, near 1.5, illustrates how deeply tied fertility decline is to economic development, education access, healthcare quality, and urbanization.
Fertility Trends Over the Last 10 Years
The past decade has been marked by a faster-than-expected slowdown in fertility, particularly in some of the world’s most populous countries. China’s fertility rate fell well below what demographers projected even five years ago, and several middle-income countries in Latin America, Southeast Asia, and the Middle East recorded sharper declines than earlier UN revisions anticipated. Meanwhile, a small number of countries, including Uzbekistan, Bulgaria, and Armenia, bucked the broader trend with modest increases in recent years.
World Fertility Rate, Last 10 Years (2015 to 2024)
| Year | World Total Fertility Rate |
|---|---|
| 2015 | 2.50 |
| 2016 | 2.47 |
| 2017 | 2.44 |
| 2018 | 2.41 |
| 2019 | 2.38 |
| 2020 | 2.35 |
| 2021 | 2.32 |
| 2022 | 2.28 |
| 2023 | 2.25 |
| 2024 | 2.24 |
Rounded estimates reflecting the UN World Population Prospects 2024 Revision trend line for the global average.
Selected Country Fertility Rates, 2015 vs 2020 vs 2024
| Country | 2015 | 2020 | 2024 |
|---|---|---|---|
| Niger | 7.30 | 6.60 | 5.79 |
| Nigeria | 5.60 | 5.10 | 4.30 |
| DR Congo | 6.30 | 6.10 | 5.90 |
| India | 2.30 | 2.10 | 1.94 |
| Pakistan | 3.80 | 3.60 | 3.50 |
| Bangladesh | 2.10 | 2.00 | 2.11 |
| Indonesia | 2.30 | 2.20 | 2.10 |
| China | 1.60 | 1.30 | 1.02 |
| United States | 1.84 | 1.64 | 1.62 |
| Brazil | 1.75 | 1.70 | 1.60 |
| Mexico | 2.20 | 1.90 | 1.87 |
| Russia | 1.78 | 1.50 | 1.47 |
| Germany | 1.50 | 1.53 | 1.46 |
| United Kingdom | 1.81 | 1.56 | 1.54 |
| France | 1.96 | 1.79 | 1.64 |
| Italy | 1.35 | 1.24 | 1.20 |
| Japan | 1.45 | 1.34 | 1.23 |
| South Korea | 1.24 | 0.84 | 0.75 |
Figures drawn from UN World Population Prospects country-level estimates, rounded to two decimal places.
South Korea’s continued slide toward the lowest fertility rate ever recorded in a country of its size, and China’s fall below 1.1, have been the two most consequential stories in global demography over the past decade. Both nations now face rapidly shrinking workforces and accelerating population aging, prompting each government to introduce cash incentives, expanded parental leave, and childcare subsidies aimed at reversing the trend, so far with limited effect.
Future Fertility Projections, 2030 to 2100
United Nations projections indicate that global fertility will continue its downward trajectory for the remainder of the century, though the pace of decline is expected to slow considerably compared to the sharp drops of the late twentieth century.
According to the most recent UN Population Division report, the world is now expected to reach replacement-level fertility of 2.1 by the late 2040s, notably earlier than the 2073 timeline projected in earlier assessments. This acceleration reflects faster-than-anticipated fertility declines in several of the world’s most populous countries.
Future Fertility Rate Projections by Region and Country, 2030 to 2100
| Country / Region | 2030 | 2050 | 2075 | 2100 |
|---|---|---|---|---|
| World | 2.15 | 2.10 | 1.95 | 1.80 |
| Sub-Saharan Africa | 3.90 | 3.00 | 2.30 | 1.90 |
| South Asia | 1.90 | 1.75 | 1.70 | 1.70 |
| East Asia | 1.10 | 1.20 | 1.30 | 1.40 |
| Europe | 1.45 | 1.55 | 1.60 | 1.65 |
| Northern America | 1.60 | 1.65 | 1.70 | 1.75 |
| Latin America and the Caribbean | 1.75 | 1.70 | 1.70 | 1.70 |
| Niger | 5.20 | 3.90 | 2.80 | 2.20 |
| Nigeria | 3.90 | 3.00 | 2.30 | 1.90 |
| India | 1.85 | 1.70 | 1.70 | 1.70 |
| China | 1.00 | 1.20 | 1.30 | 1.40 |
| United States | 1.62 | 1.68 | 1.72 | 1.75 |
| Japan | 1.20 | 1.30 | 1.40 | 1.50 |
| South Korea | 0.85 | 1.05 | 1.25 | 1.40 |
Rounded medium variant projections based on the UN World Population Prospects 2024 Revision. The UN notes considerable uncertainty in long-range projections, with a 95 percent probability interval for the 2100 global figure spanning roughly 1.6 to 2.2.
A few important dynamics shape these projections:
- Sub-Saharan Africa will remain the primary driver of global population growth through the rest of the century, even as its fertility rate declines substantially from current levels near 4.2.
- East Asian fertility is projected to bottom out and then gradually recover somewhat in the second half of the century, though it is expected to remain below replacement level even in 2100.
- Several countries, including China, Germany, Japan, and Russia, have already passed their population peak, and their populations are projected to keep shrinking through the century as low fertility persists.
- Momentum from today’s relatively youthful population structure will keep the world’s population growing until roughly the 2080s, even after the global average fertility rate falls below replacement.
Combined Table: Fertility Rate Across Past, Current, and Future Periods
The table below draws together the full arc, from the earliest reliable postwar estimates through the UN’s medium variant projections for the end of the century, in a single reference view for the world and its major regions and countries.
Combined Fertility Rate Overview, 1950 to 2100
| Country / Region | 1950 | 1990 | 2010 | 2024 | 2050 | 2100 |
|---|---|---|---|---|---|---|
| World | 5.00 | 3.30 | 2.50 | 2.24 | 2.10 | 1.80 |
| Sub-Saharan Africa | 6.50 | 6.30 | 5.30 | 4.20 | 3.00 | 1.90 |
| Middle East and North Africa | 6.90 | 4.90 | 3.00 | 2.90 | 2.30 | 1.80 |
| South Asia | 6.00 | 4.20 | 2.90 | 2.00 | 1.75 | 1.70 |
| East Asia | 5.60 | 2.20 | 1.50 | 1.03 | 1.20 | 1.40 |
| Southeast Asia | 5.80 | 3.40 | 2.30 | 1.91 | 1.75 | 1.70 |
| Europe | 2.60 | 1.80 | 1.50 | 1.41 | 1.55 | 1.65 |
| Northern America | 3.30 | 2.00 | 1.90 | 1.59 | 1.65 | 1.75 |
| Latin America and the Caribbean | 5.90 | 3.20 | 2.20 | 1.78 | 1.70 | 1.70 |
| Oceania | 3.90 | 2.50 | 2.50 | 2.13 | 2.00 | 1.85 |
| Niger | 7.50 | 7.40 | 7.10 | 5.79 | 3.90 | 2.20 |
| Nigeria | 6.90 | 6.40 | 5.70 | 4.30 | 3.00 | 1.90 |
| India | 5.90 | 3.80 | 2.60 | 1.94 | 1.70 | 1.70 |
| China | 6.10 | 2.30 | 1.60 | 1.02 | 1.20 | 1.40 |
| United States | 3.30 | 2.10 | 1.90 | 1.62 | 1.68 | 1.75 |
| Brazil | 6.10 | 2.80 | 1.80 | 1.60 | 1.65 | 1.70 |
| Japan | 3.00 | 1.50 | 1.40 | 1.23 | 1.30 | 1.50 |
| Germany | 2.10 | 1.40 | 1.40 | 1.46 | 1.55 | 1.65 |
| South Korea | 5.10 | 1.60 | 1.20 | 0.75 | 1.05 | 1.40 |
Combines historical estimates, current figures, and medium variant projections from the UN World Population Prospects 2024 Revision, rounded for readability.
Total Fertility Rate by Country, 2024 Snapshot
To capture as much of the “every country” scope as possible in a single reference, the table below lists 2024 fertility rates for a broad cross-section of sovereign states spanning every region and every point along the fertility spectrum, from the world’s highest rate to its lowest.
| Country | TFR 2024 | Country | TFR 2024 |
|---|---|---|---|
| Chad | 5.94 | Vietnam | 1.88 |
| Somalia | 5.91 | Philippines | 1.88 |
| DR Congo | 5.90 | Mexico | 1.87 |
| Central African Republic | 5.81 | Tunisia | 1.80 |
| Niger | 5.79 | Ecuador | 1.79 |
| Mali | 5.42 | Bahrain | 1.78 |
| Angola | 4.95 | El Salvador | 1.75 |
| Afghanistan | 4.66 | Bulgaria | 1.74 |
| Mozambique | 4.62 | Romania | 1.71 |
| Nigeria | 4.30 | Qatar | 1.70 |
| Sudan | 4.19 | Iran | 1.67 |
| Cameroon | 4.19 | New Zealand | 1.65 |
| Uganda | 4.06 | Australia | 1.64 |
| Zambia | 3.97 | France | 1.64 |
| Ethiopia | 3.81 | United States | 1.62 |
| Senegal | 3.71 | Turkey | 1.62 |
| Zimbabwe | 3.62 | Brazil | 1.60 |
| Rwanda | 3.59 | Ireland | 1.60 |
| Pakistan | 3.50 | United Kingdom | 1.54 |
| Uzbekistan | 3.45 | Malaysia | 1.53 |
| Ghana | 3.30 | Denmark | 1.52 |
| Iraq | 3.17 | Portugal | 1.52 |
| Namibia | 3.17 | Argentina | 1.51 |
| Kenya | 3.12 | Iceland | 1.50 |
| Papua New Guinea | 3.03 | Hungary | 1.50 |
| Kazakhstan | 2.95 | Russia | 1.47 |
| Israel | 2.75 | Germany | 1.46 |
| Egypt | 2.71 | Switzerland | 1.44 |
| Algeria | 2.67 | Sweden | 1.44 |
| Syria | 2.66 | Netherlands | 1.44 |
| Haiti | 2.59 | Norway | 1.42 |
| Mongolia | 2.59 | Belgium | 1.39 |
| Jordan | 2.57 | Estonia | 1.38 |
| Cambodia | 2.51 | Canada | 1.33 |
| Bolivia | 2.50 | Austria | 1.33 |
| Saudi Arabia | 2.29 | Poland | 1.31 |
| Guatemala | 2.26 | Finland | 1.30 |
| Libya | 2.25 | Japan | 1.23 |
| Suriname | 2.21 | Spain | 1.21 |
| South Africa | 2.19 | Italy | 1.20 |
| Bangladesh | 2.11 | Thailand | 1.20 |
| Indonesia | 2.10 | Chile | 1.13 |
| Venezuela | 2.06 | China | 1.02 |
| Morocco | 1.98 | Ukraine | 1.00 |
| India | 1.94 | Singapore | 0.96 |
| Peru | 1.94 | Taiwan | 0.86 |
| Sri Lanka | 1.94 | South Korea | 0.75 |
| Nepal | 1.94 | Hong Kong | 0.74 |
| World Average | 2.24 | Macau | 0.69 |
Snapshot compiled from the United Nations World Population Prospects 2024 Revision. For the complete list of all 200-plus sovereign states and territories, the UN Population Division publishes downloadable country-level files at population.un.org.
Why Fertility Rates Are Falling Almost Everywhere
The near-universal decline in fertility, even in countries that still sit well above replacement level, reflects a consistent set of drivers observed across nearly every region:
- Expanded access to contraception and family planning services, which allows couples to have the number of children they actually intend to have.
- Rising female education levels, which are strongly associated with delayed marriage, delayed childbearing, and smaller completed family size.
- Growing female labor force participation, which raises the opportunity cost of additional children and shifts household economics.
- Declining child mortality, which reduces the incentive for families to have more children as insurance against early death.
- Urbanization, which shrinks the economic value of large families that were historically tied to agricultural labor.
- Rising costs of housing, education, and childcare in many middle- and high-income countries discourage larger families even where fertility intentions remain above the number of children couples end up having.
Why a Handful of Countries Are Bucking the Trend
Not every country is moving in the same direction. Uzbekistan, Bulgaria, Armenia, and a small number of others recorded modest fertility increases in recent years, generally tied to targeted family support policies, economic recovery, or shifting marriage age patterns. These exceptions remain rare against the broader global backdrop of decline, but they illustrate that fertility trends are not simply one-directional and can respond, at least at the margins, to policy and economic conditions.
Policy Responses to Falling Fertility
Governments facing sustained below-replacement fertility have introduced a range of interventions, though evidence on their long-term effectiveness remains mixed:
- Direct cash payments and baby bonuses are used in countries such as Hungary, Russia, and South Korea.
- Extended and better-paid parental leave, widely adopted across Scandinavian countries.
- Subsidized or free childcare and preschool are a central pillar of French and Nordic family policy.
- Housing subsidies and tax incentives targeted at young families are used in China and several Eastern European countries.
- Immigration policy adjustments, which several high-income countries, including Australia, Canada, and the United States, rely on as the primary driver of continued population growth despite below-replacement fertility.
What This Means for the Global Population Through 2100
Even as fertility falls below replacement level in most of the world, the global population is projected to keep growing for several more decades due to demographic momentum, the effect of a large cohort of young people already born who have not yet entered their prime childbearing years.
The number of women of reproductive age worldwide is expected to keep rising through the late 2050s before beginning to decline, which will continue to support birth totals even as the fertility rate itself falls. The world’s population is projected to peak sometime around the mid to late 2080s before beginning a gradual decline, driven primarily by falling fertility in Asia and eventually in Africa as well.
Conclusion
The story of global fertility over the past seventy years is one of the most consequential demographic shifts in human history, moving from an average of five children per woman in 1950 to close to two today, with the United Nations now projecting the world will fall below replacement level within the next two decades.
The picture varies enormously by region. Sub-Saharan Africa remains in the middle of its transition, with fertility still well above five in several countries, while East Asia and parts of Europe have moved into ultra-low fertility territory that is reshaping their economies and societies. Understanding where each country sits on this spectrum, and where it is projected to head through the end of the century, is essential for anyone tracking global population trends, workforce planning, healthcare demand, or long-term economic growth.
Frequently Asked Questions
What is the current global fertility rate?
The global total fertility rate stands at approximately 2.2 to 2.25 births per woman as of 2024, according to United Nations estimates.
Which country has the highest fertility rate in the world?
Chad, Somalia, and the Democratic Republic of the Congo currently record the world’s highest fertility rates, each above 5.8 births per woman.
Which country has the lowest fertility rate in the world?
South Korea holds the lowest fertility rate among sovereign states, at approximately 0.75 births per woman, with the territories of Hong Kong and Macau recording even lower rates.
When will global fertility fall below replacement level?
United Nations projections indicate the world average will cross below the replacement threshold of 2.1 by the late 2040s.
Why does replacement level fertility vary between countries?
Replacement level is generally 2.1 in countries with low child mortality, but can be higher in countries with elevated child mortality rates, since more births are needed to sustain population levels across generations.
Will world population keep growing even as fertility falls?
Yes. Demographic momentum from today’s relatively young global population structure is expected to support continued population growth until roughly the 2080s, even as the fertility rate itself falls below replacement almost everywhere.





