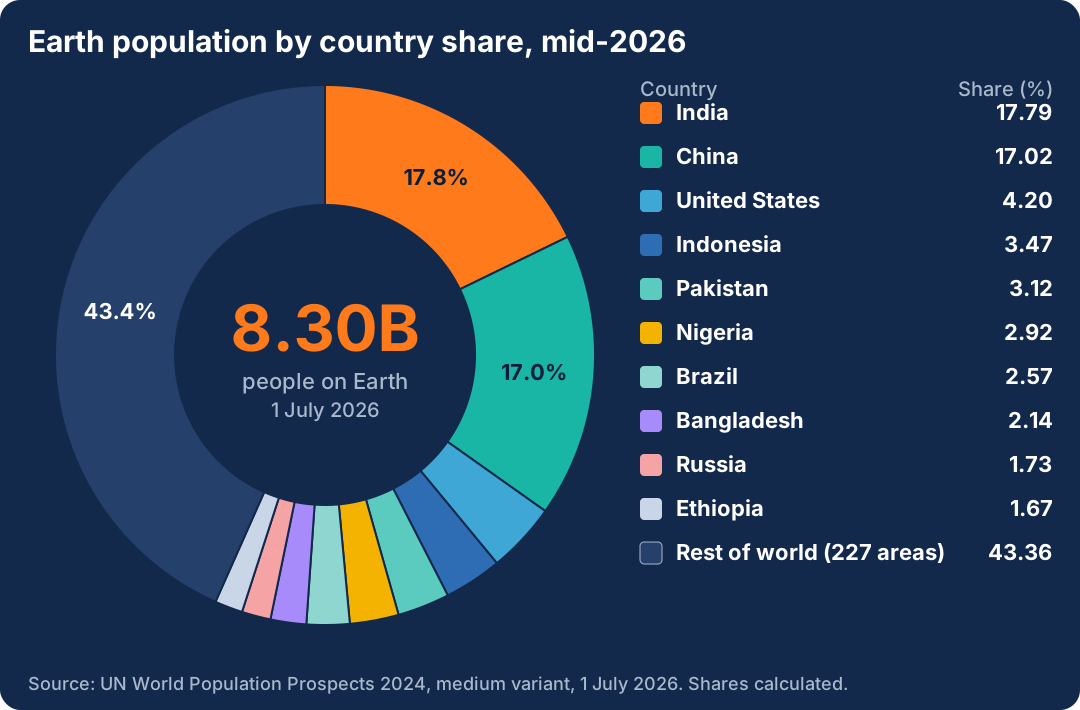
The UN puts Earth’s population at 8.30 billion in mid-2026, with India and China holding 34.8% and ten countries holding 56.6%.
Key Takeaways
- Earth’s population is 8.30 billion on 1 July 2026 (UN), up 69.1 million or 0.84% in a year, and live counts showed about 8.33 billion in November 2026.
- Ten countries hold 56.6% of Earth’s people, India and China together 34.8% (17.8% and 17.0%), while the other 227 countries and areas share the remaining 43.4%.
- Earth’s population has grown 2.75 times since 1960 (3.02 billion), is projected to pass 9 billion in 2037 and to peak near 10.29 billion in 2084.
Earth’s population stands at 8,300,678,396 people on 1 July 2026, according to the United Nations’ World Population Prospects 2024. That is 69.1 million more than a year earlier, a gain of 0.84%, or about 189,000 people a day. Live counters that interpolate the same UN series, such as Worldometer’s, had passed 8.32 billion by November 2026. The site’s own world population clock tracks the running total.
The Earth population total hides a sharp split in who is being added. Africa gains 35.1 million people a year, more than Asia’s 28.0 million, while Europe shrinks by 0.9 million. The figures below cover totals, history, country shares, regions and projections.
All numbers come from the UN Population Division’s 2024 revision, medium variant, the edition still in use across major data providers in November 2026. Values are mid-year (1 July) resident populations for 237 countries and areas. Country and regional figures are estimates built from censuses, surveys and registers of varying age, and 2030 onward figures are projections. Shares and per-day rates are calculated from the UN counts.
Earth Population Today at a Glance
| Metric | Figure | Year |
|---|---|---|
| Population | 8,300,678,396 | 2026 |
| Yearly change | +69,065,326 (+0.84%) | 2026 |
| Net gain per day (calculated) | About 189,000 | 2026 |
| Births | 132.5 million | 2026 |
| Deaths | 63.6 million | 2026 |
| Median age | 31.1 years | 2026 |
| Fertility rate | 2.23 births per woman | 2026 |
| Life expectancy at birth | 73.3 years | 2024 |
| Countries and areas in the UN data | 237 | 2026 |
Births and deaths for 2026 are the UN-based counts published by populationclock.org. They work out to about 4.2 births and 2.0 deaths every second, a net gain of roughly 2.2 people a second. The fertility rate of 2.23 is just above the 2.1 replacement level, and the median age of 31.1 means half of Earth’s people are younger than that. Median age is computed slightly differently by different providers, so compare figures within one series.
How Earth’s Population Grew From 1 Billion to 8 Billion
Earth took until 1804 to reach its first billion people and 218 more years to add seven more. Each of the last four billions arrived in 12 years.
| Milestone | Year | Years since previous billion |
|---|---|---|
| 1 billion | 1804 | n/a |
| 2 billion | 1930 | 126 |
| 3 billion | 1960 | 30 |
| 4 billion | 1974 | 14 |
| 5 billion | 1986 | 12 |
| 6 billion | 1998 | 12 |
| 7 billion | 2010 | 12 |
| 8 billion | 2022 | 12 |
| 9 billion | 2037 (projected) | 15 |
| 10 billion | 2060 to 2061 (projected) | About 24 |
These dates follow the UN’s 2024 revision, which moved some milestones earlier than the 1999 and 2011 dates still quoted for 6 and 7 billion. Some sources date 5 billion to 1987. The pace of each billion is projected to slow after 2022: 15 years to reach 9 billion and about 24 more to reach 10 billion. The longer record is covered in the world population history article.
| Year | Population | Added since previous row | Annual growth (%) | Median age | Fertility rate |
|---|---|---|---|---|---|
| 1960 | 3,015,470,894 | n/a | 1.93 | 21.5 | 4.70 |
| 1970 | 3,694,683,794 | 679.2 million | 2.07 | 20.3 | 4.83 |
| 1980 | 4,447,606,236 | 752.9 million | 1.79 | 21.5 | 3.74 |
| 1990 | 5,327,803,110 | 880.2 million | 1.82 | 22.9 | 3.31 |
| 2000 | 6,171,702,994 | 843.9 million | 1.39 | 25.1 | 2.75 |
| 2010 | 7,021,732,148 | 850.0 million | 1.29 | 27.2 | 2.60 |
| 2020 | 7,887,001,292 | 865.3 million | 1.09 | 29.6 | 2.32 |
| 2026 | 8,300,678,396 | 413.7 million (six years) | 0.84 | 31.1 | 2.23 |
Earth’s population has grown 2.75 times since 1960. The growth rate peaked at 2.07% in 1970 and has fallen to 0.84%, yet the absolute gain per decade stayed near 850 million from 1990 to 2020, because a lower rate applies to a much larger base. The 1980s added the most of any full decade in this table, 880.2 million. Fertility fell from 4.83 to 2.23 over the same period while the median age rose from 20.3 to 31.1.
India and China Hold 35% of Earth’s People
Two countries account for more than a third of Earth’s population. The ten largest account for 56.6%.
| Rank | Country | Population 2026 (millions) | Share of Earth (%) | Cumulative share (%) |
|---|---|---|---|---|
| 1 | 🇮🇳 India | 1,476.6 | 17.79 | 17.79 |
| 2 | 🇨🇳 China | 1,412.9 | 17.02 | 34.81 |
| 3 | 🇺🇸 United States | 349.0 | 4.20 | 39.02 |
| 4 | 🇮🇩 Indonesia | 287.9 | 3.47 | 42.48 |
| 5 | 🇵🇰 Pakistan | 259.3 | 3.12 | 45.61 |
| 6 | 🇳🇬 Nigeria | 242.4 | 2.92 | 48.53 |
| 7 | 🇧🇷 Brazil | 213.6 | 2.57 | 51.10 |
| 8 | 🇧🇩 Bangladesh | 177.8 | 2.14 | 53.24 |
| 9 | 🇷🇺 Russia | 143.4 | 1.73 | 54.97 |
| 10 | 🇪🇹 Ethiopia | 138.9 | 1.67 | 56.64 |
The other 227 countries and areas hold 3.60 billion people, 43.36% of the total. India leads China by 63.7 million, a gap that the India vs China population comparison traces back to the 2023 overtaking, and the largest population country page covers the ranking. The United States is a distant third at 4.20%.
| Rank | Country | Population 2026 (millions) | Share of Earth (%) | Cumulative share (%) |
|---|---|---|---|---|
| 11 | 🇲🇽 Mexico | 133.0 | 1.60 | 58.25 |
| 12 | 🇯🇵 Japan | 122.4 | 1.47 | 59.72 |
| 13 | 🇪🇬 Egypt | 120.1 | 1.45 | 61.17 |
| 14 | 🇵🇭 Philippines | 117.7 | 1.42 | 62.59 |
| 15 | 🇨🇩 DR Congo | 116.5 | 1.40 | 63.99 |
| 16 | 🇻🇳 Vietnam | 102.2 | 1.23 | 65.22 |
| 17 | 🇮🇷 Iran | 93.2 | 1.12 | 66.34 |
| 18 | 🇹🇷 Turkey | 87.9 | 1.06 | 67.40 |
| 19 | 🇩🇪 Germany | 83.6 | 1.01 | 68.41 |
| 20 | 🇹🇿 Tanzania | 72.6 | 0.87 | 69.28 |
Sixteen countries have more than 100 million people, and the top 20 hold 69.28% of Earth’s population. The distribution is steeply skewed: the average country has 35.0 million people, while StatRanker’s analysis of the UN data puts the median at 5.69 million. Full country figures are in the world population by country table.
Asia Holds Three of Every Five People, but Africa Adds the Most
Asia holds 58.6% of Earth’s people, but it is Africa that adds the most each year.
| Region | Population 2026 (millions) | Share of Earth (%) | Yearly change (millions) | Share of global growth (%) | Fertility rate |
|---|---|---|---|---|---|
| Asia | 4,863.3 | 58.6 | +28.0 | 40.6 | 1.87 |
| Africa | 1,585.0 | 19.1 | +35.1 | 50.8 | 3.89 |
| Americas | 1,061.8 | 12.8 | +6.3 | 9.2 | 1.72 |
| Europe | 743.5 | 9.0 | -0.9 | -1.3 | 1.41 |
| Oceania | 47.1 | 0.6 | +0.5 | 0.7 | 2.12 |
| Earth | 8,300.7 | 100.0 | +69.1 | 100.0 | 2.23 |
Africa supplies 50.8% of the net yearly gain with 19.1% of the people, while Asia supplies 40.6%. Fertility explains the gap: 3.89 births per woman in Africa against 1.87 in Asia and 1.41 in Europe. Africa’s median age is 19.5 years against 43.1 in Europe. The regional detail is on the continents population page, and the country-level fertility ranking on the world fertility rate page.
Projections for Earth’s Population to 2050 and the Peak
The UN medium variant has Earth’s population rising for roughly six more decades.
| Year | Population (billions) | Added since 2026 (millions) | Change since 2026 (%) |
|---|---|---|---|
| 2026 | 8.301 | n/a | n/a |
| 2030 | 8.569 | 268 | 3.2 |
| 2035 | 8.885 | 585 | 7.0 |
| 2040 | 9.177 | 876 | 10.6 |
| 2045 | 9.440 | 1,139 | 13.7 |
| 2050 | 9.664 | 1,364 | 16.4 |
Earth adds 1.36 billion people between 2026 and 2050, an average of 57 million a year, down from 69.1 million in 2026. The UN projects a peak of about 10.29 billion in 2084 and about 10.2 billion in 2100, with a 95% range for 2100 of 9.0 to 11.4 billion. The year-by-year path is in world population by 2050.
Why Earth Population Figures Differ Between Sources
Totals differ by a few tens of millions depending on the source and the date. The UN’s mid-year total is 8.30 billion on 1 July 2026, while live counters extend its series forward and show about 8.33 billion in November, a difference of 25 million that is only the passage of time. The accuracy of live population clocks is covered separately.
Milestones also differ. The UN’s 2022 edition dated 8 billion to 15 November 2022; its 2024 edition moved it earlier into 2022, and the US Census Bureau’s world clock reached 8 billion on 26 September 2023, as Worldometer notes. Country figures shift with revisions: an interim UN update on 19 January 2026 cut Togo to about 8.78 million from 9.93 million, so some tables carry the older figure. China’s official estimate for 31 December 2025 was 1.405 billion, below the UN’s 1.413 billion for mid-2026. This article uses the UN medium-variant series throughout.
Where Earth’s Population Is Heading
Earth’s population of 8.30 billion is concentrated, still growing, and unevenly distributed. India and China hold 34.8% of it, ten countries hold 56.6%, and Asia holds three of every five people. Growth has slowed from 2.07% in 1970 to 0.84%, yet 69.1 million people a year are still added, and Africa now supplies more of that gain than Asia while Europe shrinks. The UN projects 9 billion in 2037 and a peak near 10.29 billion in 2084, after which numbers decline slowly. The firmest part of that outlook is the near term, because most people who will be adults in 2050 are already alive. The least certain parts are the country figures and the timing of fertility declines, which have repeatedly moved between UN editions. Anyone comparing sources should check the edition, the date, and whether a figure is an estimate or a projection. The long view is set out in the future of world population.
Frequently Asked Questions
1. What is the population of Earth in 2026?
8,300,678,396 on 1 July 2026, according to the UN medium projection, or about 8.3 billion. Live counters showed roughly 8.33 billion in November 2026. The year-by-year numbers are in world population in 2026, and the UN total rose 69.1 million over the previous year.
2. How many people are added to Earth each day?
About 189,000 a day, or roughly 2.2 a second, based on the 69.1 million net gain in 2026. That is the balance of about 363,000 births and 174,000 deaths a day, calculated from the 132.5 million births and 63.6 million deaths the UN-based counts show for 2026.
3. Which country has the largest share of Earth’s population?
India, with 1,476.6 million people and a 17.79% share in mid-2026. China follows with 1,412.9 million and 17.02%. Together, the two hold 34.81% of Earth. The United States is third at 349.0 million, or 4.20%.
4. When did Earth’s population reach 8 billion?
In 2022, according to the UN: its 2022 edition said 15 November 2022, and its 2024 edition moved the mark earlier into the year. The US Census Bureau’s world clock reached 8 billion on 26 September 2023. The roughly year-long gap reflects different methods and base data.
5. When will Earth’s population reach 9 billion and 10 billion?
The UN medium variant has 9 billion in 2037, 15 years after 8 billion, and 10 billion in 2060 to 2061, about 24 years after that. The exact year depends on how the crossing date is set. Each additional billion takes longer than the last.
6. Which continent has the most people?
Asia, with 4,863 million people and 58.6% of Earth in 2026. Africa is second at 1,585 million (19.1%), then the Americas at 1,062 million (12.8%), Europe at 743 million (9.0%), and Oceania at 47 million (0.6%). Africa adds the most people each year, 35.1 million.
7. Will Earth’s population keep growing?
Yes, for decades. The UN projects a peak of about 10.29 billion in 2084, followed by a slow decline. Growth has already slowed from 2.07% in 1970 to 0.84% in 2026. The timing and size of the peak are examined in when the world population will peak.
8. How much of Earth’s population lives in the ten largest countries?
56.64%, or about 4.70 billion people. India and China account for 34.81% of Earth, and the top 20 countries account for 69.28%. The remaining 227 countries and areas share 43.36%, or about 3.60 billion people, so population is concentrated in a small group of countries.
9. Why do different websites show different Earth population numbers?
Sources use different editions, base years, and dates. The UN gives mid-year totals, live counters extend the trend to today, and the US Census Bureau uses its own estimates. The gap between the UN’s 1 July 2026 figure and a November counter is about 25 million, simply the passage of four months.
10. How fast is Earth’s population growing compared with the past?
Growth was 0.84% in 2026, or 69.1 million people, against a peak of 2.07% in 1970. The yearly gain peaked above 80 million in the late 1980s, and the fertility rate has fallen from 4.83 to 2.23 since 1970, which is why growth keeps slowing even as the total rises.
Sources
- United Nations, Department of Economic and Social Affairs, Population Division. World Population Prospects 2024: Summary of Results (2024).
- United Nations, Population Division. World Population Prospects 2024: Ten Key Messages (2024).
- United Nations. UN projects world population to peak within this century (July 2024).
- US Census Bureau. U.S. and World Population Clock.
- Wikipedia. List of countries and dependencies by population (China official estimate, 31 December 2025).