Key Findings
- The 2020 Census counted 2,611 urban areas, home to 265,149,027 people (80.0% of the country).
- New York’s urban area is the largest (19,426,449) and the largest by land (3,248 square miles), but only fourth for density.
- Los Angeles has the highest density among large urban areas, 7,476 per square mile.
- Miami’s urban area (6,077,522) is larger than Houston’s, Dallas-Fort Worth’s and Philadelphia’s.
- Atlanta covers 2,553 square miles and holds 5.1 million people, a density of 1,998.
- In New York, Los Angeles and Miami, more than 95% of metro residents live in the urban area.
- California holds eight of the 10 densest urban areas with 200,000 or more residents.
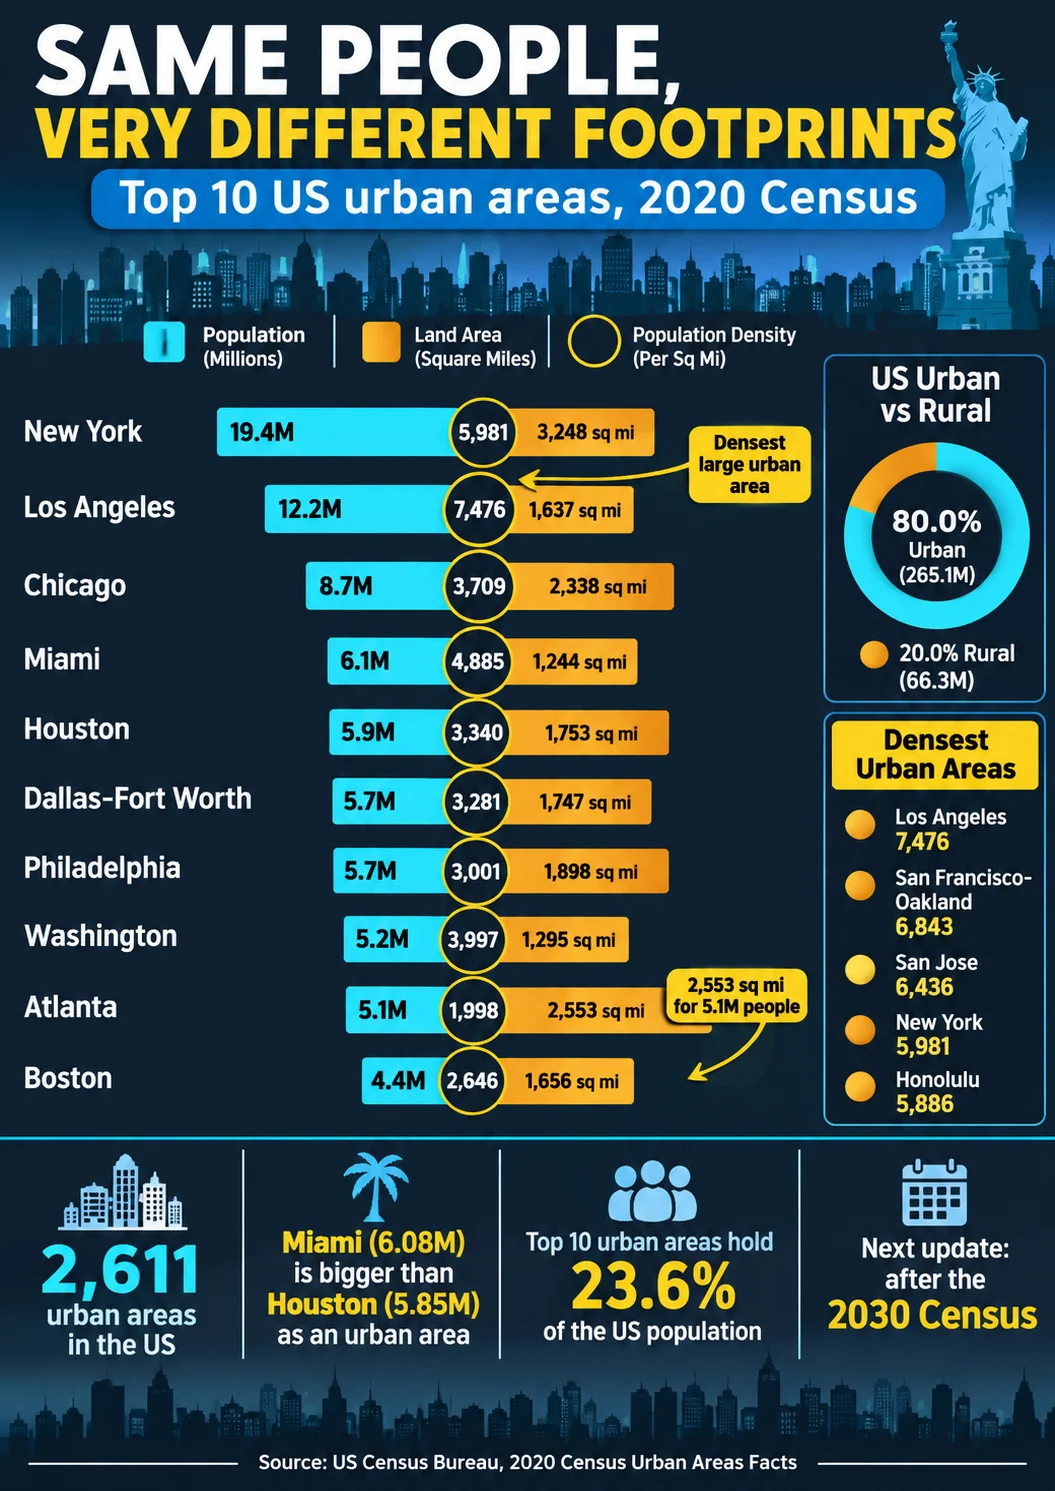
The Miami urban area, at 6,077,522 residents, was larger than the Houston urban area in the 2020 Census, yet Houston’s metropolitan area is ranked fifth in the 2025 estimates and Miami’s eighth. That reversal is not an error. Census urban areas measure continuous development, not commuting regions or city limits, and by that measure Miami’s compact footprint of 1,244 square miles holds more people than sprawling Houston, Dallas-Fort Worth or Philadelphia.
This article ranks urban areas using the 2020 Census delineation, the latest available. Urban areas are redrawn only after each decennial census, so there are no annual or 2027 urban area estimates, and the figures below are 2020 Census counts. Mixing them with the 2025 metro estimates in other articles requires caution, and where the two appear side by side, the difference in year is stated.
Data Snapshot
| Metric | Figure | Reference |
|---|---|---|
| Urban areas in the United States | 2,611 | 2020 Census |
| Urban population | 265,149,027 (80.0%) | 2020 Census |
| Rural population | 66,300,254 (20.0%) | 2020 Census |
| Largest urban area | New York-Jersey City-Newark, 19,426,449 | 2020 Census |
| Densest large urban area | Los Angeles-Long Beach-Anaheim, 7,476 per square mile | 2020 Census |
| Largest urban area by land | New York, 3,248 square miles | 2020 Census |
| Combined population of the 10 largest urban areas | 78.35 million (23.6% of the US) | 2020 Census |
The 10 Most Populous Urban Areas
| Rank | Urban area | Population | Land area (square miles) | Density per square mile |
|---|---|---|---|---|
| 1 | New York-Jersey City-Newark, NY-NJ | 19,426,449 | 3,248.12 | 5,981 |
| 2 | Los Angeles-Long Beach-Anaheim, CA | 12,237,376 | 1,636.83 | 7,476 |
| 3 | Chicago, IL-IN | 8,671,746 | 2,337.89 | 3,709 |
| 4 | Miami-Fort Lauderdale, FL | 6,077,522 | 1,244.18 | 4,885 |
| 5 | Houston, TX | 5,853,575 | 1,752.69 | 3,340 |
| 6 | Dallas-Fort Worth-Arlington, TX | 5,732,354 | 1,746.90 | 3,281 |
| 7 | Philadelphia, PA-NJ-DE-MD | 5,696,125 | 1,898.19 | 3,001 |
| 8 | Washington-Arlington, DC-VA-MD | 5,174,759 | 1,294.51 | 3,997 |
| 9 | Atlanta, GA | 5,100,112 | 2,553.04 | 1,998 |
| 10 | Boston, MA-NH | 4,382,009 | 1,655.89 | 2,646 |
Together these 10 areas held 78,352,027 people on 19,368 square miles, an average of about 4,045 per square mile. The order differs from the metro ranking in three places: Miami is fourth by urban area but eighth by metro area, Boston is 10th by urban area (11th by metro), and Phoenix is in the 2025 metro top 10 but not in the urban area top 10.
Footprint Is Not Population
Atlanta’s urban area covers 2,553 square miles, 56% more land than Los Angeles’s 1,637, yet holds only 42% as many people (5,100,112 versus 12,237,376). Miami fits 6.1 million residents on 1,244 square miles, while Philadelphia needs 1,898 for 5.7 million and Chicago 2,338 for 8.7 million. The ranking by land area runs New York, Atlanta, Chicago, Philadelphia, Houston, Dallas-Fort Worth, Boston, Los Angeles, Washington and Miami, a different order from population. A compact urban area uses less land per resident and tends to rank higher on population than on land.
Densest Urban Areas
Among urban areas with 200,000 or more residents, California holds eight of the 10 densest places.
| Rank | Urban area | Population | Land area (square miles) | Density per square mile |
|---|---|---|---|---|
| 1 | Los Angeles-Long Beach-Anaheim, CA | 12,237,376 | 1,636.83 | 7,476 |
| 2 | San Francisco-Oakland, CA | 3,515,933 | 513.80 | 6,843 |
| 3 | San Jose, CA | 1,837,446 | 285.48 | 6,436 |
| 4 | New York-Jersey City-Newark, NY-NJ | 19,426,449 | 3,248.12 | 5,981 |
| 5 | Honolulu, HI | 853,252 | 144.97 | 5,886 |
| 6 | Modesto, CA | 357,301 | 70.38 | 5,077 |
| 7 | Las Vegas-Henderson-Paradise, NV | 2,196,623 | 435.29 | 5,046 |
| 8 | Oxnard-San Buenaventura (Ventura), CA | 376,117 | 76.61 | 4,910 |
| 9 | Miami-Fort Lauderdale, FL | 6,077,522 | 1,244.18 | 4,888 |
| 10 | San Diego, CA | 3,070,300 | 674.72 | 4,551 |
The largest urban area is not the densest. New York ranks fourth for density at 5,981 per square mile, below Los Angeles (7,476), San Francisco-Oakland (6,843) and San Jose (6,436). This is the reverse of the city-limit picture, in which New York City is about 3.5 times as dense as Los Angeles city, because the urban area includes the sprawling suburbs of New Jersey, Long Island and the Hudson Valley while Los Angeles’s built-up area is relatively uniform.
Housing Unit Density
The Census Bureau also ranks urban areas by housing units per square mile, a measure less affected by household size.
| Urban area | Housing units | Housing units per square mile |
|---|---|---|
| San Francisco-Oakland, CA | 1,391,873 | 2,709 |
| Los Angeles-Long Beach-Anaheim, CA | 4,354,341 | 2,660 |
| New York-Jersey City-Newark, NY-NJ | 7,657,903 | 2,358 |
| San Jose, CA | 658,649 | 2,307 |
| Honolulu, HI | 315,727 | 2,178 |
By housing density, San Francisco-Oakland edges Los Angeles, though by population density Los Angeles leads, a difference explained by larger household sizes in Southern California.
Urban Area Versus Metropolitan Area
Urban areas sit inside metro areas, so they are always smaller than the metro that contains them. The ratio tells how much of a region’s population lives in the continuously built core.
| Region | Urban area 2020 | Metro area July 2025 | Urban area as share of metro |
|---|---|---|---|
| New York | 19,426,449 | 20,112,448 | 96.6% |
| Los Angeles | 12,237,376 | 12,844,441 | 95.3% |
| Miami | 6,077,522 | 6,391,072 | 95.1% |
| Chicago | 8,671,746 | 9,434,123 | 91.9% |
| Philadelphia | 5,696,125 | 6,329,118 | 90.0% |
| Boston | 4,382,009 | 5,034,221 | 87.0% |
| Washington | 5,174,759 | 6,465,724 | 80.0% |
| Atlanta | 5,100,112 | 6,482,182 | 78.7% |
| Houston | 5,853,575 | 7,904,627 | 74.1% |
| Dallas-Fort Worth | 5,732,354 | 8,477,157 | 67.6% |
The two columns are five years apart, which overstates the gap slightly because metro populations grew between 2020 and 2025. Even so, the pattern is clear: in New York, Los Angeles and Miami more than 95% of metro residents live in the urban core by this measure, while in Houston and Dallas-Fort Worth roughly a quarter to a third do not, reflecting large outer counties with rural and exurban territory. A fuller comparison of the four geographies appears in the companion article on largest metropolitan areas.
Urbanization Over Time
By the Census Bureau’s definition, 80.0% of the 331,449,281 US residents lived in urban areas in 2020, compared with 249,253,271 of 308,754,538 (about 80.7%) in 2010. Urban population grew 6.4% over the decade, slower than total population (7.4%). Urban land area shrank 2.4% while urban density rose 9.0%, which reflects the way urban territory is defined. The 2010 and 2020 rural shares are not strictly comparable because the Bureau changed its criteria.
How the Census Bureau Defines an Urban Area
The 2020 delineation defines an urban area from groups of densely developed census blocks and requires at least 2,000 housing units or 5,000 people. It dropped the 2010 distinction between urbanized areas (50,000 or more people) and urban clusters (2,500 to 49,999), so every qualifying area is simply an urban area. The result was 2,611 urban areas in the 2020 Census, down from 3,573 urban areas and clusters delineated after 2010, partly because of the higher minimum threshold. The Bureau now uses housing units as the primary measure of density, which makes the classification more consistent across areas with different household sizes.
Because the rules changed, 2010 and 2020 urban counts should not be compared as if they used one definition. The Census Bureau says urban areas are delineated after each decennial census, and the next delineation will follow the 2030 Census.
Conclusion
Urban area rankings correct a common impression created by city and metro lists. New York’s lead is overwhelming, but Los Angeles, not New York, is the densest large region, Miami outranks Houston, and Atlanta’s 2.5 thousand square miles shelter fewer people than Los Angeles’s 1.6 thousand. Because these figures are frozen at the 2020 Census, they will not move until the next delineation after the 2030 Census, and they should be labeled as 2020 data wherever they appear.
Frequently Asked Questions
1. What is the largest urban area in the United States?
New York-Jersey City-Newark, with 19,426,449 residents in the 2020 Census.
2. What are the top 10 largest urban areas in America?
New York, Los Angeles, Chicago, Miami, Houston, Dallas-Fort Worth, Philadelphia, Washington, Atlanta, and Boston.
3. Is an urban area larger than a city?
Usually, because an urban area includes the surrounding developed territory. New York’s urban area (19,426,449) is more than twice the population of New York City (8.8 million in 2020).
4. What is the difference between an urban area and a metropolitan area?
An urban area is continuously developed land as defined by the Census, while a metro area is a group of whole counties tied to an urban core by commuting. The metro area is almost always larger.
5. Which US urban area has the highest population density?
Among those with 200,000 or more people, Los Angeles-Long Beach-Anaheim, at 7,476 per square mile.
6. How does the Census Bureau define urban areas?
As densely developed groups of census blocks with at least 2,000 housing units or 5,000 people, using housing-unit density as the main measure in the 2020 delineation.
7. How many urban areas are there in the United States?
The 2020 Census delineated 2,611, plus 26 in Puerto Rico and seven in the Island Areas.
8. Are urban area population figures updated every year?
No. The Census Bureau delineates them after each decennial census and publishes counts, not annual estimates. The next set follows the 2030 Census.
9. Why is Miami’s urban area larger than Houston’s?
Miami packs 6.1 million residents into 1,244 square miles, while Houston’s 5.9 million are spread across 1,753. The urban area measures continuous development, so compact regions rank higher than their metro rankings suggest.
10. What share of Americans live in urban areas?
80.0% in the 2020 Census (265,149,027 people), with 66,300,254 (20.0%) in rural areas.
Sources
- U.S. Census Bureau, “2020 Census Urban Areas Facts” (urban area counts, populations, land areas and densities; updated June 2023).
- Business Stats, “The 25 Largest US Metro Areas in 2025” (July 2025 metro populations and 2020 urban area criteria summary).
- U.S. Census Bureau, 2020 Census total population (331,449,281).