France’s political landscape is shaped less by raw population size than by who actually turns out to vote, how different groups prioritize issues, and how demographic structures interact with economic and geographic realities. A group’s share of the total population does not equal its share of the electorate or its influence at the ballot box. Turnout gaps by age, education, and income, combined with citizenship rules and regional differences, determine which voices weigh most heavily in presidential, legislative, and local contests.
As of early 2026, France had roughly 50.2 million people registered on the electoral rolls. The next presidential election is scheduled for 18 April 2027 (first round) and 2 May 2027 (second round if needed). Understanding the composition of actual voters rather than the resident population matters more than ever amid recent social tensions, including the large-scale protests and unrest of October 2026 that highlighted cost-of-living pressures, education standards, and youth discontent.
How does France’s electorate work?
Who is eligible to vote in French elections?
Only French citizens aged 18 or over may vote in presidential and legislative (National Assembly) elections. Registration on the electoral roll is required. Since reforms, young people are automatically registered upon reaching 18 in most cases, though voluntary updates remain common after moves.
For municipal and European Parliament elections, EU citizens residing in France can vote under certain conditions, but they cannot vote in presidential or National Assembly elections. French citizens living abroad vote via consular lists for national elections. Overseas territories follow adapted rules but remain part of the national framework. The Constitutional Council and Ministry of the Interior oversee the integrity of the process.
How many registered voters are there?
According to INSEE data released in March 2026, 50.2 million people were registered on the electoral lists as of mid-February 2026 (close of registration for the March 2026 municipal elections). This includes approximately 48.2 million French citizens on main communal lists (mainland and overseas departments), plus French citizens abroad on consular lists (around 1.7 million) and a smaller number of other EU citizens eligible for local and European votes.
The figure rose by about 847,000 since the 2024 European elections, driven mainly by young people reaching voting age outnumbering deaths, plus voluntary re-registrations after address changes. Roughly 95% of French citizens of voting age in mainland France and the overseas departments were registered.
How turnout changes the composition of the electorate
Registered voters form the denominator for official turnout rates. Actual voters (those who cast a ballot) and valid ballots (excluding blank or spoiled votes) produce different pictures. In the 2022 presidential election, turnout was approximately 74% in the first round and 72% in the second among registered voters. Legislative elections that year saw much lower participation (around 47% in the first round).
Because younger, less-educated, and lower-income groups participate less consistently, the effective electorate is older, more educated, and more settled than the eligible population as a whole. Systematic voters (those who vote in every round of major elections) are disproportionately older. Intermittent and systematic abstention is higher among the young. These patterns mean that policy platforms appealing to high-turnout groups carry greater weight than population shares alone would suggest.
Track Real-time Population Growth @ FRANCE POPULATION CLOCK
How does age influence electoral participation?
Young voters and first-time voters
Young people (18–24 and 25–34) show consistently lower turnout. INSEE analysis of the 2022 presidential and legislative elections found that only about 28% of those under 30 voted in the second round of the legislative elections, compared with far higher rates among older groups. In the presidential first round, roughly three-quarters of 18–24-year-olds who were registered participated in at least one round, but many were intermittent voters.
Surveys (Ipsos, INJEP) show that when young people do vote, preferences have often leaned toward left or radical-left options (such as Jean-Luc Mélenchon’s La France Insoumise in 2022) or, in some cases, the far right, reflecting concerns about economic insecurity, education quality, housing, and the future. The October 2026 protests initially driven by high-school students over education standards and later joined by cost-of-living demonstrators illustrated this generational frustration. Violence on the fringes does not represent the majority of young people, yet it underscored deeper anxieties about public services and opportunities that surface in both streets and polling data.
Automatic registration has increased the pool of young registered voters, but it has also amplified measured abstention rates because many newly registered individuals do not turn out.
Older voters and electoral participation
Turnout rises steadily with age until advanced old age. In 2022, systematic voting peaked among those aged 70–79. Voters aged 65 and over consistently show the highest participation rates in both presidential and legislative contests. Pension policy, healthcare access, purchasing power for retirees, and security feature prominently in their priorities according to post-election surveys.
Because older cohorts both participate more and form a growing share of the population due to ageing, their preferences exert outsized influence on outcomes. Macron performed strongly among older voters in 2022; similar patterns appear in subsequent legislative and European contests.
Generational differences in political priorities
Documented differences exist without implying uniformity within age groups. Younger cohorts more frequently cite climate, education quality, housing costs, and job insecurity. Older cohorts emphasize pensions, healthcare, immigration control, and economic stability. These are associations observed in surveys, not deterministic rules. Cross-cutting factors such as education and place of residence often matter as much as age alone.
How do education and income relate to voting behavior?
Education levels and electoral participation
INSEE’s long-term analysis shows that gaps by educational attainment have widened. In 2022, excluding students, only 29% of registered voters without a diploma voted in every round of the presidential and legislative elections, versus 44% of those with higher education a 15-point gap (compared with a smaller 9-point gap in 2002).
Higher-educated voters have tended to favor centrist or left-liberal options (Macron in 2022, certain European lists). Lower-educated voters have shown stronger support for the Rassemblement National (RN) in recent cycles. Ipsos exit polls for the 2024 European elections and legislative contests confirmed that RN support declined sharply with higher diplomas, while left and centrist lists performed better among the highly educated.
Income, employment, and economic insecurity
Participation rises with income. Analyses of 2024 legislative voting offices showed turnout as low as around 49% in the poorest polling stations and up to 76% in the wealthiest a 27-point gap. Economic insecurity correlates with higher support for protest or radical options (both left and right), though the relationship is not uniform. Working-class and employee categories have given substantial support to the RN in recent elections, while higher-income professionals lean toward the center.
Association is not causation. Local economic decline, job quality, and public-service access interact with individual circumstances.
Urban professionals, industrial areas, and rural communities
Urban professionals (especially in large metropolitan areas) show higher education levels, higher incomes, and stronger support for centrist or progressive lists. Former industrial areas and certain peri-urban zones have registered stronger RN performances. These patterns appear consistently in official results from 2022 and 2024.
What role do immigration background and citizenship play?
French citizens with immigrant backgrounds
“Immigrant” (immigré) in INSEE statistics means a person born abroad who was not French at birth. Many later acquire citizenship. “Foreigner” (étranger) refers to non-citizens. Only French citizens vote in presidential and legislative elections. Descendants of immigrants born in France are French by birth in most cases and appear in ordinary voter statistics without special ethnic or religious markers.
Official electoral data do not record ancestry or religion. Surveys sometimes explore self-reported origin, but these are sample-based and subject to response bias.
Naturalization and political participation
Naturalized citizens are fully eligible once registered. INSEE and related studies indicate that registration and turnout rates among naturalized citizens and their descendants can lag behind those of the population without recent migration background, though rates vary by origin and length of residence. Some recent surveys and analyses have suggested higher declared support for certain left-wing lists among voters with extra-European parental origins, but these remain survey findings rather than official electoral statistics. Claims about bloc voting by origin must be treated cautiously.
Why assumptions about religious or ethnic voting are unreliable
Ecological inference inferring individual behavior from area-level results is methodologically flawed. High support for a party in a neighborhood with many residents of immigrant background does not prove that those residents drove the result. Individual-level surveys, when carefully designed, provide better (though still imperfect) evidence. French law and statistical practice deliberately limit collection of ethnic or religious data in official electoral contexts precisely to avoid such over-interpretation.
How does geography reshape France’s political map?
Paris and major metropolitan areas
Large cities concentrate higher education, professional employment, and younger adults. In 2022, Macron won overwhelming majorities in Paris and strong results in other major cities. Left lists also perform relatively well in dense urban cores. High housing costs and public-transport dependence shape local priorities.
Rural France and smaller towns
Rural and small-town areas tend to be older on average, with different employment structures and greater sensitivity to public-service closures, agricultural policy, and security. RN support has been stronger in many of these zones and especially in peri-urban rings around cities. However, careful analyses show that much of the apparent urban-rural gap reflects social composition (education, occupation, age) rather than pure geography. After controlling for these factors, residual territorial effects shrink significantly.
Regional differences and overseas territories
Hauts-de-France, parts of the southeast, and certain eastern departments have shown elevated RN scores. Brittany and parts of the west have been more resistant. Overseas territories display distinct patterns, often with higher support for left or local lists and lower turnout in some cases. Population structure, historical political cultures, and economic conditions all contribute.
Electoral participation (selected recent elections)
| Election | Registered voters (approx.) | Turnout (first/relevant round) | Notes |
|---|---|---|---|
| 2022 Presidential (1st) | 48.7 million | ~74% | High for recent cycles |
| 2022 Legislative (1st) | ~49 million | ~48% | Sharp drop |
| 2024 European | ~49.3 million | ~51% (France) | Variable by age |
| 2024 Legislative (1st) | ~49.3 million | ~67% | Elevated by political context |
| 2026 Municipal (eligible) | 48.7 million | Forthcoming | Includes some EU citizens |
Sources: Ministry of the Interior, INSEE, International IDEA.
How could demographic change affect future elections?
Ageing and the changing electorate
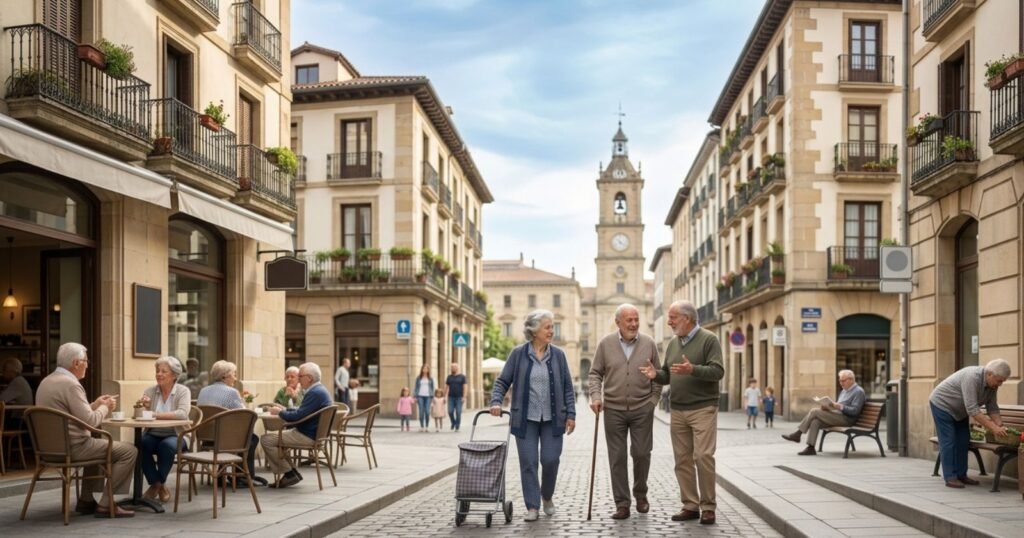
France’s population is ageing. The share of older eligible voters is rising. Because older cohorts turn out at higher rates, the effective electorate is likely to remain tilted toward senior priorities unless youth participation rises substantially. Automatic registration of 18-year-olds expands the young registered pool, but conversion into actual votes remains the decisive variable.
Migration, naturalization, and future voter eligibility
Net migration contributes to population growth, yet only those who acquire French citizenship become eligible for national elections. Naturalization numbers have been significant over the past two decades, adding citizens of diverse origins. The gap between resident population growth and the citizen electorate is therefore large. Future eligibility depends on naturalization policy, residency duration, and individual decisions to seek citizenship not on immigration volumes alone.
The 2027 presidential election and demographic analysis
The first round is set for 18 April 2027 and the second for 2 May 2027. Registration deadlines will fall in March 2027. Current polling exists, but demographic trends alone cannot predict winners. Turnout differentials, campaign issues (cost of living, education, security, climate), candidate supply, and short-term events will matter more. The October 2026 protests illustrated how education quality and economic pressure can mobilize younger cohorts outside the ballot box; whether that energy converts into higher youth turnout in 2027 remains an open question.
Turnout patterns by age (illustrative, 2022)
| Age group | Approximate participation notes |
|---|---|
| 18–24 / under 30 | Lowest; ~28% in 2022 legislative 2nd round |
| 65+ | Highest; often 20–30 points above young adults |
Source: INSEE Première analyses of 2022 elections.
Regional and territorial context
Major metropolitan areas tend toward higher education levels and centrist/left results. Peri-urban and many rural zones show stronger RN support, largely explained by social composition. Overseas territories follow distinct trajectories.
Voter characteristics (survey-based associations)
Higher education and income correlate with higher turnout and greater centrist support. Lower education and greater economic insecurity correlate with higher RN support in recent cycles. These are observed associations from Ipsos, INSEE, and related post-election surveys.
Recommended Articles Related to France Population & Policy:
- France’s Immigration Challenges and Future
- How Religion Is Changing in France
- Can France Reverse Its Population Decline?
- France’s Growing Ageing Population
- Immigration’s Role in France’s Population Growth
- How Second Generation Immigrants Are Shaping France
- France’s Regional Population Winners and Losers
- France’s Pension Crisis: Fewer Workers, More Retirees
- France’s Religious Diversity and the Future of Laïcité
- Why French Households Are Getting Smaller
- Why Are Fewer French Families Having Children?
- Migrants in France Today: The Numbers Behind the Headlines
FAQs
1. How many people can vote in France?
Approximately 50.2 million were registered in early 2026. Only French citizens aged 18+ can vote in presidential and legislative elections.
2. Which age groups have the highest turnout in France?
Voters aged roughly 65–79 typically show the highest and most consistent participation.
3. How does age affect voting in France?
Younger voters participate less and, when they vote, have shown stronger support for radical-left or protest options in recent cycles. Older voters participate more and have leaned toward the center or right depending on the contest.
4. Can immigrants vote in French presidential elections?
Only if they have acquired French citizenship. Non-citizen residents, including most immigrants, cannot vote in presidential or National Assembly elections.
5. How does urban and rural population change affect French elections?
Urban cores favor higher-education and centrist/left patterns; many peri-urban and rural areas show stronger RN support. Much of the difference reflects social composition rather than pure location.
6. How are second-generation immigrants counted in voter statistics?
They are counted as ordinary French citizens. Official electoral statistics do not track ancestry.
7. When is the next French presidential election?
First round: 18 April 2027. Second round (if needed): 2 May 2027. France’s elections are shaped by the interaction of eligibility rules, differential turnout, education and income gradients, and geographic settlement patterns. Demographic change will alter the pool of eligible voters, but who actually shows up and what issues they prioritize will continue to decide outcomes.