
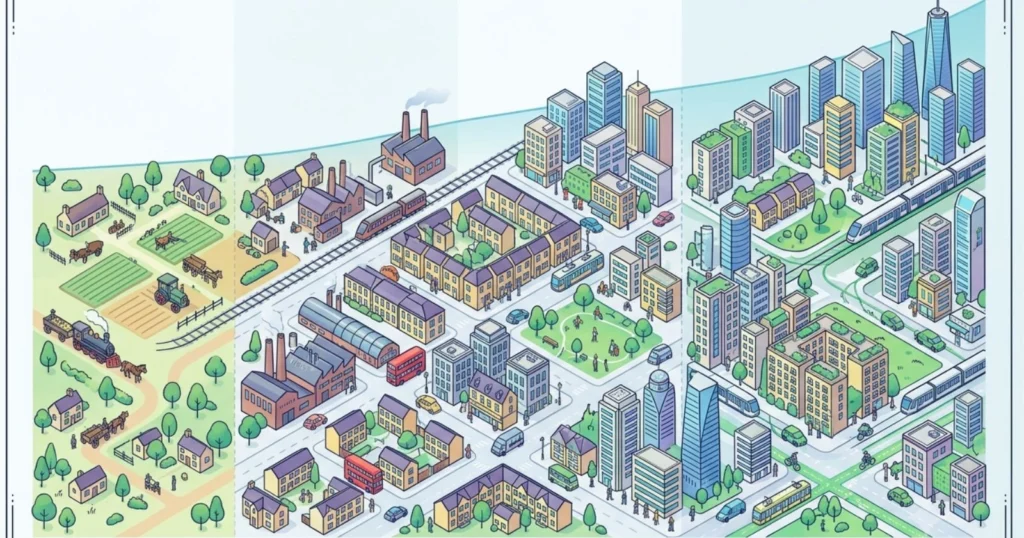
The United Kingdom is one of the most densely settled large countries in Europe. With a relatively small land area supporting nearly 70 million residents, population density has become a central theme in discussions about housing, infrastructure, healthcare capacity, and regional planning.
Population density is calculated by dividing the total population by land area. For the UK, the commonly used land area figure is approximately 241,930 square kilometres, which excludes inland water bodies. Using this measure, the UK density has climbed steadily for nearly a century, moving from roughly 190 people per square kilometre in the early 1930s to close to 286 people per square kilometre today.
What Is Population Density and Why Does It Matter
Population density measures how many people live within a given unit of land, typically expressed as persons per square kilometre. It is a useful indicator for governments and planners because it reflects pressure on housing stock, transport networks, schools, hospitals, and green space. A rising density figure generally signals urban expansion, increased demand for services, and greater competition for land, while a falling figure can point to depopulation or boundary changes.
The UK average masks enormous internal variation. London recorded a density of roughly 5,782 people per square kilometre in 2024, while large parts of the Scottish Highlands support fewer than 10 people per square kilometre. England alone is far more densely populated than Scotland, Wales, or Northern Ireland, and the south east of England contains almost a third of the entire UK population.
Past Trends in UK Population Density
Long before the modern era of migration-driven growth, the UK’s population density rose gradually through natural increase, improved healthcare, and the pull of industrial cities. The table below traces population and density figures at roughly decade intervals from 1931 through 2011, using the UK’s current territorial boundaries.
Past Trends (1931 to 2011)
| Year | UK Population (approx) | Land Area (sq km) | Population Density (per sq km) |
|---|---|---|---|
| 1931 | 46.0 million | 241,930 | 190 |
| 1951 | 50.2 million | 241,930 | 207 |
| 1961 | 52.8 million | 241,930 | 218 |
| 1971 | 55.9 million | 241,930 | 231 |
| 1981 | 56.4 million | 241,930 | 233 |
| 1991 | 57.4 million | 241,930 | 237 |
| 2001 | 59.1 million | 241,930 | 244 |
| 2011 | 63.2 million | 241,930 | 261 |
A few patterns stand out from this longer view.
- Density grew fastest between 1961 and 1971 and again between 2001 and 2011, both periods coinciding with strong economic growth and rising net migration.
- The 1970s and 1980s were comparatively slow growth decades, with density rising by only a few points across each ten-year span, reflecting lower fertility and periods of net emigration.
- The jump from 244 to 261 people per square kilometre between 2001 and 2011 was one of the largest single-decade increases on record, driven largely by inward migration following European Union enlargement.
- Land area has stayed essentially fixed across the whole period, so almost all of the change in density is a direct reflection of population growth rather than any change in territory.
UK Population Density Over the Last Ten Years
The most recent decade offers a more granular, year-by-year view of how quickly density has been rising. Annual mid-year population estimates from the Office for National Statistics show consistent growth apart from a brief slowdown around the pandemic years.
Last Ten Years (2015 to 2024)
| Year | UK Population (approx) | Population Density (per sq km) | Annual Change |
|---|---|---|---|
| 2015 | 65.11 million | 269.1 | baseline |
| 2016 | 65.65 million | 271.4 | +2.3 |
| 2017 | 66.06 million | 273.1 | +1.7 |
| 2018 | 66.44 million | 274.6 | +1.5 |
| 2019 | 66.80 million | 276.1 | +1.5 |
| 2020 | 67.08 million | 277.3 | +1.2 |
| 2021 | 67.03 million | 277.1 | negative 0.2 |
| 2022 | 67.60 million | 279.4 | +2.3 |
| 2023 | 68.35 million | 282.5 | +3.1 |
| 2024 | 69.30 million | 286.4 | +3.9 |
Key observations from the last decade include the following points.
- Density rose from about 269 to about 286 people per square kilometre over nine years, an increase of roughly 6 percent.
- Growth briefly stalled between 2020 and 2021, the only year-on-year dip in the table, largely because international travel restrictions during the pandemic reduced net migration to near zero.
- Growth accelerated sharply from 2022 onward, with the 2023 and 2024 increases among the largest annual gains in the entire dataset, driven by a surge in net international migration following changes to the UK immigration system after Brexit.
- By 2024, UK density had already moved well past the levels recorded at the 2011 census, confirming that population growth in the 2010s and early 2020s outpaced almost every prior decade.
Regional Density Snapshot for Context
While national figures dominate the headlines, density varies enormously across the UK’s constituent nations and regions.
- London remains the clear outlier, with a density of roughly 5,782 people per square kilometre in 2024, many times higher than any other region.
- North West England is the next most densely populated region outside London, reflecting the concentration of population around Manchester, Liverpool, and surrounding urban areas.
- Scotland is the most sparsely populated constituent nation, with vast rural and highland areas pulling its average density far below the UK figure.
- Around 84 percent of the UK population lived in areas classified as urban as of 2022, underscoring how concentrated the density figures really are once rural land is factored out.
Future Projections for UK Population Density
Looking ahead, the Office for National Statistics publishes national population projections that combine assumptions about fertility, mortality, and net migration. The most recent 2024-based projections point to continued but slowing growth through the 2030s, followed by a peak in the middle of the century and a gradual decline afterward.
Future Projections (2025 to 2074)
| Year | Projected UK Population | Population Density (per sq km) | Notes |
|---|---|---|---|
| 2025 | 69.6 million | 287.7 | early projection period |
| 2030 | 70.4 million | 291.0 | steady migration driven growth |
| 2034 | 71.0 million | 293.5 | end of ten year projection window |
| 2040 | 71.7 million | 296.4 | growth rate slowing further |
| 2050 | 72.4 million | 299.2 | approaching the projected peak |
| 2054 | 72.5 million | 299.7 | projected peak population year |
| 2064 | 72.1 million | 298.1 | population begins to fall |
| 2074 | 71.4 million | 295.1 | continued gradual decline |
The projections carry several important qualifications.
- Net international migration is the sole driver of projected growth over the next decade. The ONS expects natural change, meaning births minus deaths, to turn negative from around 2026 onward.
- Under the principal projection, the UK population is expected to grow from about 69.3 million in mid 2024 to 71.0 million in mid 2034, an increase of roughly 1.7 million people.
- Population growth is expected to slow steadily through the 2030s and 2040s before the UK reaches its projected peak of about 72.5 million people in 2054.
- After the mid 2050s peak, the population is projected to decline slowly, falling to about 72.1 million by 2064 and 71.4 million by 2074, as deaths continue to outnumber births even with ongoing net migration.
- These figures are projections rather than forecasts. Small changes in migration policy, fertility rates, or life expectancy can shift the numbers considerably, and the ONS revises its projections periodically as new data becomes available.
- If net migration were to fall to zero, independent analysis suggests the UK population could fall to around 66 million by 2050 rather than continuing to grow, illustrating how central migration has become to the country’s demographic trajectory.
Combined Table Spanning Past, Current, and Future Density
The table below brings together selected data points from the historical record, the most recent decade, and the official future projections into a single continuous view of UK population density from 1931 through 2074.
Combined Historical and Projected Density Table
| Year | UK Population | Population Density (per sq km) | Period |
|---|---|---|---|
| 1931 | 46.0 million | 190 | Historical |
| 1951 | 50.2 million | 207 | Historical |
| 1971 | 55.9 million | 231 | Historical |
| 1991 | 57.4 million | 237 | Historical |
| 2001 | 59.1 million | 244 | Historical |
| 2011 | 63.2 million | 261 | Historical |
| 2015 | 65.11 million | 269.1 | Recent |
| 2019 | 66.80 million | 276.1 | Recent |
| 2021 | 67.03 million | 277.1 | Recent |
| 2024 | 69.30 million | 286.4 | Current |
| 2034 | 71.0 million | 293.5 | Projected |
| 2054 | 72.5 million | 299.7 | Projected peak |
| 2074 | 71.4 million | 295.1 | Projected decline |
Viewed across the full span of more than 140 years of coverage, the trajectory is clear. Density has roughly climbed from around 190 people per square kilometre in 1931 to a projected peak near 300 people per square kilometre in the mid 2050s, before easing back slightly through the following two decades.
Why UK Population Density Keeps Rising
Several structural factors explain the long-run increase in density.
- Net international migration has been the single largest contributor to UK population growth for more than two decades, consistently outweighing the balance of births and deaths.
- Fixed land area means every additional resident directly raises the density figure, unlike countries that have expanded through territorial annexation or land reclamation.
- Urbanisation continues to concentrate population growth in and around existing cities rather than spreading evenly across the country, which pushes local densities in places like London, Manchester, and Birmingham far above the national average.
- Rising life expectancy has added to population totals independently of migration, since people are living longer after retirement than in previous generations.
- Falling fertility rates, now estimated at around 1.6 children per woman on a long-term basis, are gradually reducing the contribution of births to population growth, shifting the balance of future growth even more heavily toward migration.
What Rising Density Means for Housing and Infrastructure
Higher population density has direct consequences for everyday life across the UK.
- Housing demand continues to outstrip supply in the most densely populated regions, particularly London and the wider south east, contributing to persistently high property prices and rents.
- Transport networks in dense urban areas face growing strain, prompting continued investment in rail, underground, and bus capacity in major cities.
- Healthcare and school place planning must account for both natural population growth and net migration when forecasting local demand for services.
- Green space and land use planning face increasing pressure as local authorities balance new housing targets against environmental protection commitments.
- Regional disparities in density are likely to widen further, with England’s south east continuing to grow faster than Scotland, Wales, or Northern Ireland under current projections.
Conclusion
UK population density has followed a long and largely uninterrupted upward path for close to a century, climbing from around 190 people per square kilometre in 1931 to close to 286 today. The last ten years have shown that growth is far from over, with a sharp acceleration in 2022, 2023, and 2024 driven by historically high levels of net migration.
Official projections suggest density will keep climbing through the 2030s and 2040s before reaching a peak of around 300 people per square kilometre in the mid 2050s, after which a slow decline is expected to follow as the country’s underlying birth and death rates settle into a pattern where deaths exceed births.
For planners, policymakers, and residents alike, understanding this trajectory is essential for anticipating future demand on housing, transport, healthcare, and public services across the UK.
Frequently Asked Questions
What is the current population density of the UK?
As of the most recent estimates, UK population density stands at approximately 286 people per square kilometre, based on a population of around 69.3 million and a land area of about 241,930 square kilometres.
How has the UK population density changed since the 1930s?
Density has risen from roughly 190 people per square kilometre in 1931 to close to 286 people per square kilometre today, an increase of more than 50 percent over roughly nine decades.
Which part of the UK has the highest population density?
London has by far the highest density in the UK, recorded at approximately 5,782 people per square kilometre in 2024, far above any other region or nation within the UK.
Is the UK population density expected to keep rising?
Yes, in the near term. The Office for National Statistics projects density will keep rising through the 2030s and 2040s before peaking around 2054, after which it is expected to decline gradually as deaths outnumber births even with continued net migration.
What is driving UK population growth and rising density?
Net international migration is currently the dominant driver of UK population growth, more than offsetting a natural change that has already turned negative in recent projections, meaning deaths now exceed births in the underlying population.
How does UK population density compare with the rest of Europe?
The UK is among the more densely populated large countries in Europe, with a density well above the European Union average, though still below city-states and a handful of small, highly urbanised European nations.





