
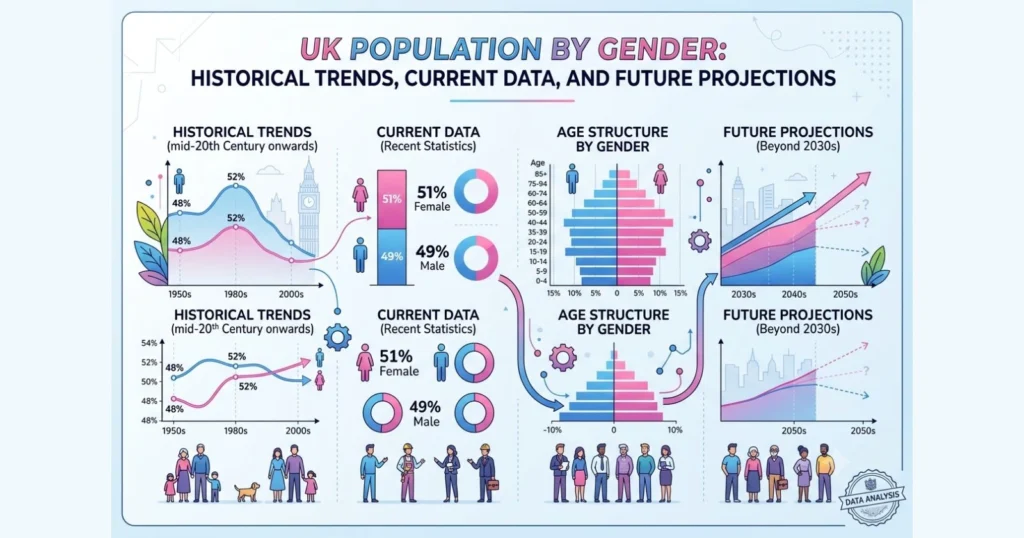
The United Kingdom has long shown a consistent demographic pattern in which women slightly outnumber men across the general population. This gap, while narrowing in recent decades, remains a defining feature of the country’s population structure and carries implications for healthcare planning, pension policy, labor markets, and social services.
Current UK Population by Gender Snapshot
As of the most recent official Office for National Statistics mid-year estimate for mid-2024, the total UK population reached approximately 69.3 million people, marking an increase of about 755,300 from the previous year. This represents one of the largest annual numerical increases the country has recorded in over 75 years, driven mainly by net international migration rather than natural change.
Based on United Nations demographic modeling for 2026, the UK population by gender breaks down as follows:
- Male population: approximately 34.45 million, or 49.27 percent of the total
- Female population: approximately 35.48 million, or 50.73 percent of the total
- Sex ratio: about 97.1 males for every 100 females
- Numerical gap: roughly 1.03 million more women than men
This pattern of a female majority has held steady for well over a century in the UK, though the size of the gap has been shrinking gradually since the 1950s.
Why Females Outnumber Males in the UK
Several structural factors explain the persistent female majority in the UK population.
- Higher male mortality at older ages. Men tend to have shorter average life expectancy than women, meaning fewer men survive into their seventies, eighties, and beyond.
- Sex ratio at birth favors males slightly. Around 105 boys are born for every 100 girls, but this early male surplus is offset over the lifespan.
- War-related losses in older cohorts. Older generations still reflect the demographic scars of the two World Wars, when a disproportionate number of young men were lost.
- Migration patterns. Net international migration to the UK in recent decades has included a relatively balanced but at times male-skewed inflow among working-age adults, which has slowly nudged the overall sex ratio closer to parity.
- Improvements in male health outcomes. Declining smoking rates and better treatment of cardiovascular disease among men have narrowed the mortality gap, which is one reason the female majority has been shrinking rather than widening.
Historical Trends in the UK Population by Gender
Looking back across seven decades reveals how the UK population by gender has evolved. In the early 1950s, the female share of the population was noticeably higher than it is today, a legacy of wartime male mortality. Since then, the gap has steadily narrowed even as the total population has grown substantially.
Past Trends Table (1950 to 2020)
| Year | Male Population | Female Population | Total Population | Female Share | Sex Ratio (M per 100F) |
|---|---|---|---|---|---|
| 1950 | 24.10 million | 26.02 million | 50.12 million | 51.9% | 92.6 |
| 1960 | 25.38 million | 27.16 million | 52.54 million | 51.7% | 93.4 |
| 1970 | 27.03 million | 28.64 million | 55.66 million | 51.5% | 94.4 |
| 1980 | 27.39 million | 28.89 million | 56.28 million | 51.3% | 94.8 |
| 1990 | 27.66 million | 29.70 million | 57.37 million | 51.8% | 93.1 |
| 2000 | 28.63 million | 30.43 million | 59.06 million | 51.5% | 94.1 |
| 2010 | 30.78 million | 32.23 million | 63.01 million | 51.1% | 95.5 |
| 2020 | 33.13 million | 34.22 million | 67.35 million | 50.8% | 96.8 |
A few observations stand out from this long-run data. The total UK population grew by roughly 17.2 million people between 1950 and 2020, an increase of about 34 percent. Over the same period, the female share of the population declined from around 51.9 percent to 50.8 percent, showing a gradual narrowing of the historic gender imbalance. The sex ratio, meaning the number of men per 100 women, rose from 92.6 in 1950 to 96.8 in 2020, reflecting improved male survival rates and shifting migration patterns.
Notably, the 1988 to 1990 period marked one of the widest points in the gender gap for several decades, as the sex ratio dipped to around 93.1, before resuming its long-term upward trajectory through the 1990s and 2000s.
UK Population by Gender: The Last 10 Years
The most recent decade of data shows a population that continues to grow overall, while the proportional gender balance keeps drifting slowly toward parity. This period also captures the effects of the coronavirus pandemic on mortality and migration, along with a strong rebound in net migration inflows after 2021.
Last 10 Years Table (2014 to 2023)
| Year | Male Population | Female Population | Total Population | Female Share | Sex Ratio (M per 100F) |
|---|---|---|---|---|---|
| 2014 | 31.78 million | 33.08 million | 64.87 million | 51.0% | 96.1 |
| 2015 | 32.06 million | 33.32 million | 65.38 million | 51.0% | 96.2 |
| 2016 | 32.35 million | 33.55 million | 65.89 million | 50.9% | 96.4 |
| 2017 | 32.59 million | 33.76 million | 66.35 million | 50.9% | 96.5 |
| 2018 | 32.80 million | 33.95 million | 66.75 million | 50.9% | 96.6 |
| 2019 | 32.99 million | 34.12 million | 67.11 million | 50.8% | 96.7 |
| 2020 | 33.13 million | 34.22 million | 67.35 million | 50.8% | 96.8 |
| 2021 | 33.30 million | 34.37 million | 67.67 million | 50.8% | 96.9 |
| 2022 | 33.56 million | 34.62 million | 68.18 million | 50.8% | 96.9 |
| 2023 | 33.81 million | 34.87 million | 68.68 million | 50.8% | 97.0 |
Between 2014 and 2023, the total UK population increased by around 3.82 million people, a growth rate of roughly 5.9 percent over the decade. The male population grew slightly faster in percentage terms than the female population during this window, which is why the female share edged down from 51.0 percent to 50.8 percent.
According to ONS official mid-year estimates, the population reached 69.28 million by mid 2024, continuing this same upward trajectory, with growth in that single year alone reaching 1.1 percent, one of the fastest annual increases recorded in the past 75 years.
It is worth noting that the official ONS mid 2021 count, based on the 2021 census, recorded a total UK population of 67,026,292, made up of 34,214,835 females and 32,811,457 males. This official census-based figure differs slightly from the UN modeled estimate for the same year but confirms the same underlying pattern of a female majority narrowing gradually over time.
Future Projections for the UK Population by Gender
Looking ahead, the Office for National Statistics ‘ 2024-based national population projections indicate that the UK population will keep growing through the 2030s and 2040s before plateauing and beginning a gradual decline.
The UK population is projected to grow from 69.3 million in mid 2024 to 71.0 million in mid 2034, an increase of 1.7 million people, or 2.5 percent, driven entirely by net international migration since natural change (the difference between births and deaths) is expected to turn negative. Longer-term modeling suggests the population will likely peak at around 72.5 million in the mid 2050s before beginning to decline.
On the gender front, the long-term UN projections suggest the sex ratio will continue moving toward parity and may eventually tip toward a slight male majority in the second half of the century, largely because of continuing improvements in male life expectancy relative to female life expectancy and the age structure of migration flows.
Future Projected Table (2025 to 2050)
| Year | Male Population | Female Population | Total Population | Female Share | Sex Ratio (M per 100F) |
|---|---|---|---|---|---|
| 2025 | 34.26 million | 35.29 million | 69.55 million | 50.7% | 97.1 |
| 2026 | 34.45 million | 35.48 million | 69.93 million | 50.7% | 97.1 |
| 2030 | 35.16 million | 36.13 million | 71.29 million | 50.7% | 97.3 |
| 2035 | 35.90 million | 36.76 million | 72.66 million | 50.6% | 97.6 |
| 2040 | 36.53 million | 37.25 million | 73.77 million | 50.5% | 98.1 |
| 2045 | 37.11 million | 37.65 million | 74.75 million | 50.4% | 98.6 |
| 2050 | 37.58 million | 37.92 million | 75.50 million | 50.2% | 99.1 |
Under this modeling, the female share of the UK population is projected to fall from around 50.7 percent in 2026 to about 50.2 percent by 2050, while the sex ratio climbs from roughly 97.1 to 99.1 males per 100 females. This means the gender gap, while still favoring women numerically for the foreseeable future, is expected to keep narrowing steadily rather than reversing sharply within this timeframe.
Key Drivers Behind the Projected Shift
- Rising male life expectancy. Public health improvements and lower smoking prevalence among younger male cohorts are expected to continue narrowing the mortality gap between men and women.
- Migration age and gender composition. Net migration, which is now the sole source of UK population growth according to ONS projections, tends to skew slightly toward working-age adults, which affects the overall sex balance.
- Aging population structure. As the population ages, particularly among the baby boomer generation now entering their seventies and eighties, the very old age groups where women heavily outnumber men will continue to have an outsized effect on the total female share, even as younger cohorts trend closer to balance.
- Declining births relative to deaths. Natural change is expected to turn negative in the coming years, meaning migration will increasingly determine both the size and the gender composition of future population growth.
Combined Table: Past, Current, and Future UK Population by Gender
The table below brings together the full sweep of data from the historical baseline of 1950 through to the projected figures for 2050, offering a single reference point for how the UK population by gender has evolved and where it is heading.
| Year | Male Population | Female Population | Total Population | Female Share | Sex Ratio (M per 100F) | Period |
|---|---|---|---|---|---|---|
| 1950 | 24.10 million | 26.02 million | 50.12 million | 51.9% | 92.6 | Historical |
| 1970 | 27.03 million | 28.64 million | 55.66 million | 51.5% | 94.4 | Historical |
| 1990 | 27.66 million | 29.70 million | 57.37 million | 51.8% | 93.1 | Historical |
| 2010 | 30.78 million | 32.23 million | 63.01 million | 51.1% | 95.5 | Historical |
| 2020 | 33.13 million | 34.22 million | 67.35 million | 50.8% | 96.8 | Recent |
| 2024 | 34.04 million | 35.09 million | 69.14 million | 50.8% | 97.0 | Current |
| 2026 | 34.45 million | 35.48 million | 69.93 million | 50.7% | 97.1 | Current |
| 2030 | 35.16 million | 36.13 million | 71.29 million | 50.7% | 97.3 | Projected |
| 2040 | 36.53 million | 37.25 million | 73.77 million | 50.5% | 98.1 | Projected |
| 2050 | 37.58 million | 37.92 million | 75.50 million | 50.2% | 99.1 | Projected |
Across this full 100-year span, the total UK population is projected to grow by roughly 25.4 million people, more than 50 percent above the 1950 baseline. Meanwhile, the female share of the population is expected to decline from just under 52 percent in 1950 to just above 50 percent by 2050, illustrating a century long trend toward a more balanced, though still female-leaning, gender distribution.
Regional and Age Group Patterns Worth Noting
The national figures mask meaningful variation across regions and age groups.
- Older age groups skew heavily female. In the 90 to 99 age bracket, women outnumber men by roughly two to one, and among centenarians the ratio widens to around four to one, a direct reflection of the long-standing female life expectancy advantage.
- Younger age groups skew slightly male. Because more boys are born than girls, the UK currently has more males than females in every age group under 34, with the male to female ratio peaking at around 105.8 per 100 in the 25 to 29 age bracket.
- The crossover point sits around the mid-thirties. From roughly age 35 onward, female populations begin to exceed male populations in each successive age band, a pattern that becomes increasingly pronounced with age.
- Regional median age varies widely. The South West of England has the oldest median age in the country at 43.7 years, while London has the youngest at 35.7 years, a gap that also shapes local-level gender ratios given the concentration of older women in less urban regions.
Conclusion
The UK population by gender tells a story of gradual convergence rather than dramatic change. Women have outnumbered men consistently for more than a century, a legacy shaped by wartime losses, differences in life expectancy, and the natural sex ratio at birth. Yet the gap has been narrowing steadily, from a female share of nearly 52 percent in 1950 to just under 51 percent today, with projections pointing toward a figure closer to 50 percent by mid-century.
As migration continues to be the dominant driver of UK population growth in the years ahead, the country’s gender balance will likely keep drifting toward parity, even as the overall population climbs toward and eventually passes 72 million before its projected peak in the 2050s.
Frequently Asked Questions
Are there more men or women in the UK?
There are more women than men in the UK. As of the most recent estimates, women make up around 50.7 to 50.8 percent of the population, compared to around 49.2 to 49.3 percent for men, a gap of roughly 1 million people.
Why does the UK have more women than men overall?
The primary reason is that women tend to live longer than men on average, so despite slightly more boys being born each year, women accumulate a numerical advantage in the older age brackets that outweighs the early male surplus.
Is the gender gap in the UK population growing or shrinking?
The gap has been shrinking steadily since the 1950s and is projected to continue narrowing through 2050, mainly because of improving male life expectancy and the age composition of net migration.
What is the UK population expected to be by 2034?
According to the Office for National Statistics 2024-based projections, the UK population is expected to reach around 71.0 million by mid 2034, an increase of 1.7 million from the 2024 estimate.
When is the UK population projected to peak?
Current ONS projections suggest the UK population will peak at around 72.5 million in the mid 2050s before beginning a gradual decline, a notable shift from earlier projections that had shown continuous growth through to 2096.
Sources: Office for National Statistics (ONS) mid-year population estimates and 2024-based national population projections; United Nations World Population Prospects 2024 Revision.





